



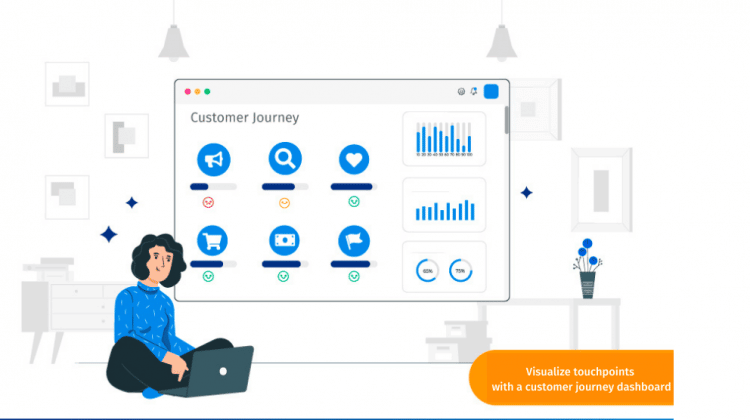
A customer journey dashboard is a visual workspace that tracks how customers feel and behave at every touchpoint, from first contact to renewal. A touchpoint is any moment a customer interacts with your brand, such as a website visit, a support call, or a delivery.
Without one, teams see isolated scores and miss where the experience breaks. With one, they spot the weak step, find the cause, and fix it before customers leave.
In this blog, we’ll cover what a journey dashboard includes, which metrics matter, real examples, and a step-by-step plan to build your own.
What is a customer journey dashboard?
A customer journey dashboard is a single view that combines survey scores, behavior data, and customer comments across every stage of the customer journey. It shows what customers experience at each touchpoint, how that experience changes over time, and which steps cost you the most customers.
The data comes from several places:
- Surveys and open-ended comments
- A CRM (customer relationship management system)
- Web and app analytics
- Support tickets
- Point-of-sale records
Teams can drill into a weak step, read the comments behind a low score, and assign an owner to fix it. Most dashboards refresh in near real time, so teams react while a problem is still small.
How is a customer journey dashboard different from a journey map or a CX dashboard?
These terms overlap, and teams often mix them up. The short version: a journey map shows the path, and a dashboard measures how well customers travel it.
| Tool | What it shows | Best for | Update rhythm |
|---|---|---|---|
| Customer journey map | Stages, actions, thoughts, and emotions customers go through | Planning the ideal path and aligning teams | Static, revised periodically |
| Customer journey dashboard | Live metrics and feedback for each stage and touchpoint | Finding where the journey breaks and tracking fixes | Continuous or near real time |
| Customer journey analytics | Analysis of paths, sequences, and drop-offs behind the numbers | Learning why journeys succeed or fail | Ongoing analysis |
| Customer experience dashboard | Business-wide scores such as NPS and CSAT | Executive health checks | Continuous |
A map is the plan. A dashboard is the scoreboard.
What are the benefits of a customer journey dashboard?
A journey dashboard turns scattered feedback into one picture that teams can act on. An analysis found that brands improving the customer journey saw revenue rise as much as 10 to 15 percent while cutting cost to serve by 15 to 20 percent.
- Clearer experience measurement.
You see end-to-end scores instead of one blended number, and you can trace low scores to root causes. - Higher retention.
You spot the steps and behaviors that come before abandonment, then step in early. - Lower cost to serve.
You find steps that add effort, repeat contacts, or manual work. - More revenue.
You tailor offers to where the customer is in the journey, which supports customer lifetime value (the total revenue one customer generates over the relationship). - Shared ownership.
Every team sees the same view, so no team optimizes its own step at another team’s expense.
What are the key components of a customer journey dashboard?
Five components make a dashboard useful rather than decorative. Each one answers a single question.
Business timeline
The timeline answers: where does each team fit? Companies organize around departments, but customers experience one continuous relationship.
Lay out the stages so every team sees its place:
- Awareness and consideration
- Purchase and onboarding
- Usage, support, and renewal
- Advocacy
Mark the handoffs between teams. Customers most often fall through the gaps there.
Customer-centered framework
The framework answers: what is the customer trying to do? Build the structure around what customers do, think, and feel, not around your org chart.
Voice of the customer (VoC) is feedback collected directly from customers in their own words. It belongs in the framework from day one, because it explains the numbers beside it.
Customer data
Data answers: what is actually happening? Combine three kinds so each one checks the others:
- Behavioral: Clicks, purchases, feature use, repeat visits
- Operational: Wait times, ticket counts, resolution times
- Attitudinal: Survey scores and open-ended comments
Showing positive and negative emotion next to behavior explains why customers act as they do.
Data analysis
Analysis answers: why does it happen? It reveals which paths lead to a purchase, which end in churn, and where customers loop back. Text analysis of open-ended comments surfaces emotional highs and lows that scores hide.
This is where customer journey analytics does its work. The dashboard presents the findings, and analytics produces them.
Actionable insight
Insight answers: what do we do next? Ask three things of every tile:
- Who owns this metric?
- What threshold triggers action?
- What is the first step when it drops?
Design around the decisions stakeholders must make, not around what is easy to chart.
Which metrics belong on a customer journey dashboard?
Pick metrics by journey stage, not by what is easy to measure. Pair one attitude metric with one behavior metric at each stage, so you see both how customers feel and what they do.
Three attitude metrics appear often. Net Promoter Score (NPS) is the percentage of promoters (scores 9 to 10) minus the percentage of detractors (scores 0 to 6). CSAT is the customer satisfaction score, the share of customers who rate an interaction as satisfying. CES is the customer effort score, which measures how easy an interaction felt.
| Stage | Question it answers | Example metrics |
|---|---|---|
| Awareness | Are the right people finding us? | Traffic by source, branded search, first-visit engagement |
| Consideration | Are prospects exploring deeper? | Return visits, demo or trial requests, comparison page views |
| Purchase | Where do buyers stall or leave? | Conversion rate, cart or form abandonment, CES at checkout |
| Onboarding | Do new customers reach value quickly? | Time to first value, activation rate, onboarding CSAT |
| Retention | Are customers staying and satisfied? | Churn rate, renewal rate, NPS at key moments, usage trends |
| Advocacy | Are happy customers spreading the word? | Referral rate, review volume and sentiment, promoter share |
Drop-off rate is the share of customers who leave at a given step. Churn rate is the share who stop buying or renewing in a period. For more path-based measures, see this guide to customer journey analytics metrics.
What do real customer journey dashboards reveal?
Examples show what a journey view exposes that a blended score hides. Two come from published McKinsey research, and one is an illustrative scenario.
Car rental pick-up journey
A car rental company redesigned its airport pick-up journey. According to the McKinsey analysis, the results were:
- Customer service scores doubled
- Upselling revenue rose 5 percent
- Cost of serving customers fell 10 percent
European energy provider
An energy company treated moving into a new home as one journey instead of a set of separate tasks. McKinsey reported that it cut the process from 18 steps to five and reduced costs by 40 to 50 percent. Complaint-handling staff dropped from 109 to 20.
SaaS onboarding scenario
This one is hypothetical, with invented numbers. Picture a US software company with an overall NPS of 45. Its dashboard shows a different story by stage:
- Sign-up: NPS 58
- Onboarding: NPS 31, with long gaps between setup steps
- Renewal: NPS 40
The blended score hid the real problem. The team fixes onboarding first and watches that one tile.
Step-by-step guide to building a customer journey dashboard
Start with the decision the dashboard supports, then add data. These six steps keep the build focused.
- Define the decision and the audience.
Write one sentence, such as “Show the product team where new users stall.” - Map stages and touchpoints.
List every stage and the touchpoints inside it. Start with the five to ten that matter most. - Choose two metrics per stage.
Pair one attitude metric with one behavior metric. - Connect your data sources.
Pull in survey, CRM, support, and web data so the dashboard is not built on a single source. - Design the layout.
Place stages left to right in the order customers experience them. - Assign owners and a review rhythm.
Every tile gets a named owner. Review operational tiles weekly and strategic ones quarterly.
What makes a customer journey dashboard easy to read?
A dashboard that takes five minutes to decode will not get used. It is a single-page view of data visualizations built for quick action, not for deep exploration.
Length and two-dimensional position are the most accurate ways to show quantities. So use bar charts to compare touchpoints and line charts to show trends over time. Pie charts, donut charts, and radial gauges are slower to read. Linear bullet charts work better.
Color needs care too. Up to 4.5 percent of people have some form of color blindness. Pair every red or green signal with a label or shape.
Show change against the last period, not just the current value. Then link each tile to the comments behind it, so a viewer can go from a number to a reason in one click.
How do you choose a customer journey dashboard tool?
Choose a tool that matches your data and your teams, not the longest feature list. Small teams can start with fewer connections. Larger organizations should weigh governance and role-based access first.
| Criterion | What to ask | Red flag |
|---|---|---|
| Data connections | Can it pull survey, CRM, support, and web data without custom code? | Relies on manual file uploads |
| Feedback capture | Can it collect feedback at touchpoints itself? | Needs a separate survey tool |
| Role-based views | Can executives, managers, and agents each see their own metrics? | One layout for everyone |
| Drill-down | Can you click from a score to the comments behind it? | Scores only |
| Action workflows | Can a low score open a case with an owner? | Insight stops at the chart |
| Security | Does it meet your privacy and compliance requirements? | Vague answers |
How do you turn dashboard signals into action?
A dashboard changes outcomes only when a signal triggers a response. Here is an illustrative example with invented numbers. A retailer’s overall NPS is 62, which looks healthy. The touchpoint view shows store pick-up at 71, website checkout at 64, and returns at 31.
Returns become the first fix. The team follows a simple loop:
- Diagnose: Read the comments behind the low returns score.
- Assign: Give one owner the fix and a target date.
- Re-measure: Check the same tile after the change ships.
Set the rhythm by purpose. Operational dashboards support time-sensitive tasks, while analytical dashboards support decisions with less urgency. Review operational tiles often and analytical ones on a longer cycle.
What are the most common customer journey dashboard mistakes?
Most failed dashboards share a few patterns. Each one is fixable once you can name it.
| Mistake | Why it hurts | Fix |
|---|---|---|
| Tracking too many KPIs | Teams cannot agree on priorities. One energy provider in the McKinsey study had 150 KPIs and cut them to eight. | Limit each stage to one or two metrics |
| Showing blended scores | A healthy overall score hides a failing stage | Break every score out by stage |
| Celebrating conversion only | Customers who buy but never succeed still churn | Track onboarding and early usage |
| Relying on churn alone | Churn is a lagging signal and shows up late | Add usage trends as early warnings |
| Keeping feedback and behavior apart | You see what happened but not why | Put scores, comments, and behavior in one view |
| No owner or threshold | Nobody acts on a red tile | Name an owner and a trigger for each metric |
How does QuestionPro support a customer journey dashboard?
QuestionPro Customer Experience connects feedback collection, journey building, and dashboards in one place, which closes the gap between a score and a fix.
Three capabilities do the work:
- Journey building from feedback.
Response to Journey AI turns survey responses into a journey map linked to the underlying questions and comments. Qual-to-Maps builds a journey from a single interview or open-ended comment. - Metrics on the journey itself.
The Journey Management tool adds NPS, CSAT, CES, sentiment scores, and operational KPIs to any journey phase, with scoring down to the individual interaction. - Role-based views.
Teams build touchpoint surveys with survey software, then see results in dashboards set up by role. AI can also draft a dashboard from a plain-language description.
Closed-loop feedback then routes detractor responses to an owner, so a low score on the dashboard becomes a case someone can close.
A journey dashboard earns its place when it changes a decision
A customer journey dashboard is only worth building if someone acts on what it shows. The most useful ones are small, stage-based, and owned. They pair a score with a reason, and a reason with a next step.
Start with one journey and one decision. Prove it there, then expand to the next. A focused dashboard that teams open every week beats a complete one that nobody trusts.
Frequently Asked Questions (FAQs)
Aim for two metrics per stage, so roughly 10 to 15 in total. Fewer is better when a team is new to journey tracking. Add metrics only when someone owns them and a clear decision depends on the result.
Review operational tiles, such as support wait times and checkout drop-off, every week. Review strategic tiles, such as retention and advocacy, every quarter. Match the rhythm to how quickly a team can act on the signal.
Typical sources include surveys, CRM records, web and app analytics, support tickets, point-of-sale systems, and review sites. Start with two sources you trust, such as survey scores and support tickets, then add others as the team matures.
An operational dashboard supports time-sensitive tasks, such as spotting a spike in complaints today. An analytical dashboard supports slower decisions, such as choosing next quarter’s onboarding changes. Most journey programs need one of each, aimed at different audiences.
Yes. Start with one journey, such as order to delivery, and a handful of survey and support metrics. Choose a tool with built-in survey collection and prebuilt views, so no one needs to write queries or manage data pipelines.



