• Skip to main content
  • Skip to primary sidebar
  • Skip to footer
QuestionPro

QuestionPro

questionpro logo
  • Products
    survey software iconSurvey softwareEasy to use and accessible for everyone. Design, send and analyze online surveys.research edition iconResearch SuiteA suite of enterprise-grade research tools for market research professionals.CX iconCustomer ExperienceExperiences change the world. Deliver the best with our CX management software.WF iconEmployee ExperienceCreate the best employee experience and act on real-time data from end to end.
  • Solutions
    IndustriesGamingAutomotiveSports and eventsEducationGovernment
    Travel & HospitalityFinancial ServicesHealthcareCannabisTechnology
    Use CaseAskWhyCommunitiesAudienceContactless surveysMobile
    LivePollsMember ExperienceGDPRPositive People Science360 Feedback Surveys
  • Resources
    BlogeBooksSurvey TemplatesCase StudiesTrainingHelp center
  • Features
  • Pricing
Language
  • English
  • Español (Spanish)
  • Português (Portuguese (Brazil))
  • Nederlands (Dutch)
  • العربية (Arabic)
  • Français (French)
  • Italiano (Italian)
  • 日本語 (Japanese)
  • Türkçe (Turkish)
  • Svenska (Swedish)
  • Hebrew IL (Hebrew)
  • ไทย (Thai)
  • Deutsch (German)
  • Portuguese de Portugal (Portuguese (Portugal))
Call Us
+1 800 531 0228 +1 (647) 956-1242 +52 999 402 4079 +49 301 663 5782 +44 20 3650 3166 +81-3-6869-1954 +61 2 8074 5080 +971 529 852 540
Log In Log In
SIGN UP FREE

Home QuestionPro New Features

Correlation analysis customization and strength of correlation highlights

Correlation analysis customization QuestionPro

What if you wanted to know if a person’s household income will directly influence their decision to purchase a new smartphone. When determining if one data point is strongly associated with other results from a different question, then you run a correlation analysis. This is a bivariate analysis that measures the strength of association between two variables and the direction of the relationship. In terms of the strength of the relationship, the value of the correlation coefficient (rs) varies between+1 and -1. As the correlation coefficient value goes towards 0, the relationship between the two variables will be weaker.

The direction of the relationship is indicated by the sign of the coefficient. A positive + sign to +1 indicates a direct relationship and a negative – sign to -1 indicates an inverse relationship.

With our latest update to the correlation analysis tool, you can now self-select and generate the correlation output for the required questions of your choosing. Strong correlations will automatically be highlighted based on the strength of the correlation found from the results. This will allow you to differentiate highly correlated cells and inversely correlated cells and provide quick insights.

The setup

Go to: My Surveys » Select Survey » Analytics

Click on Correlation Analysis under the Analysis drop down

Setup correlation analysis

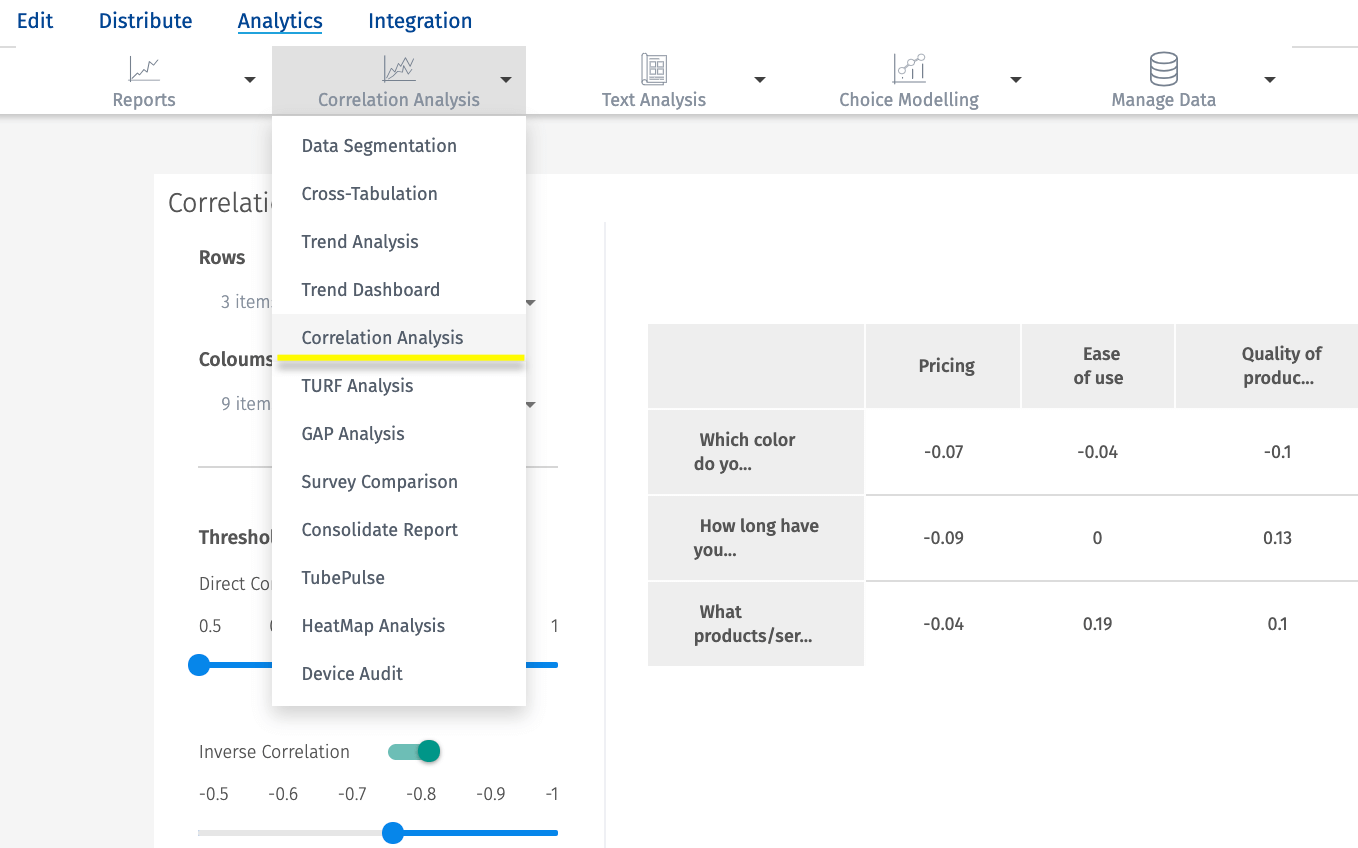
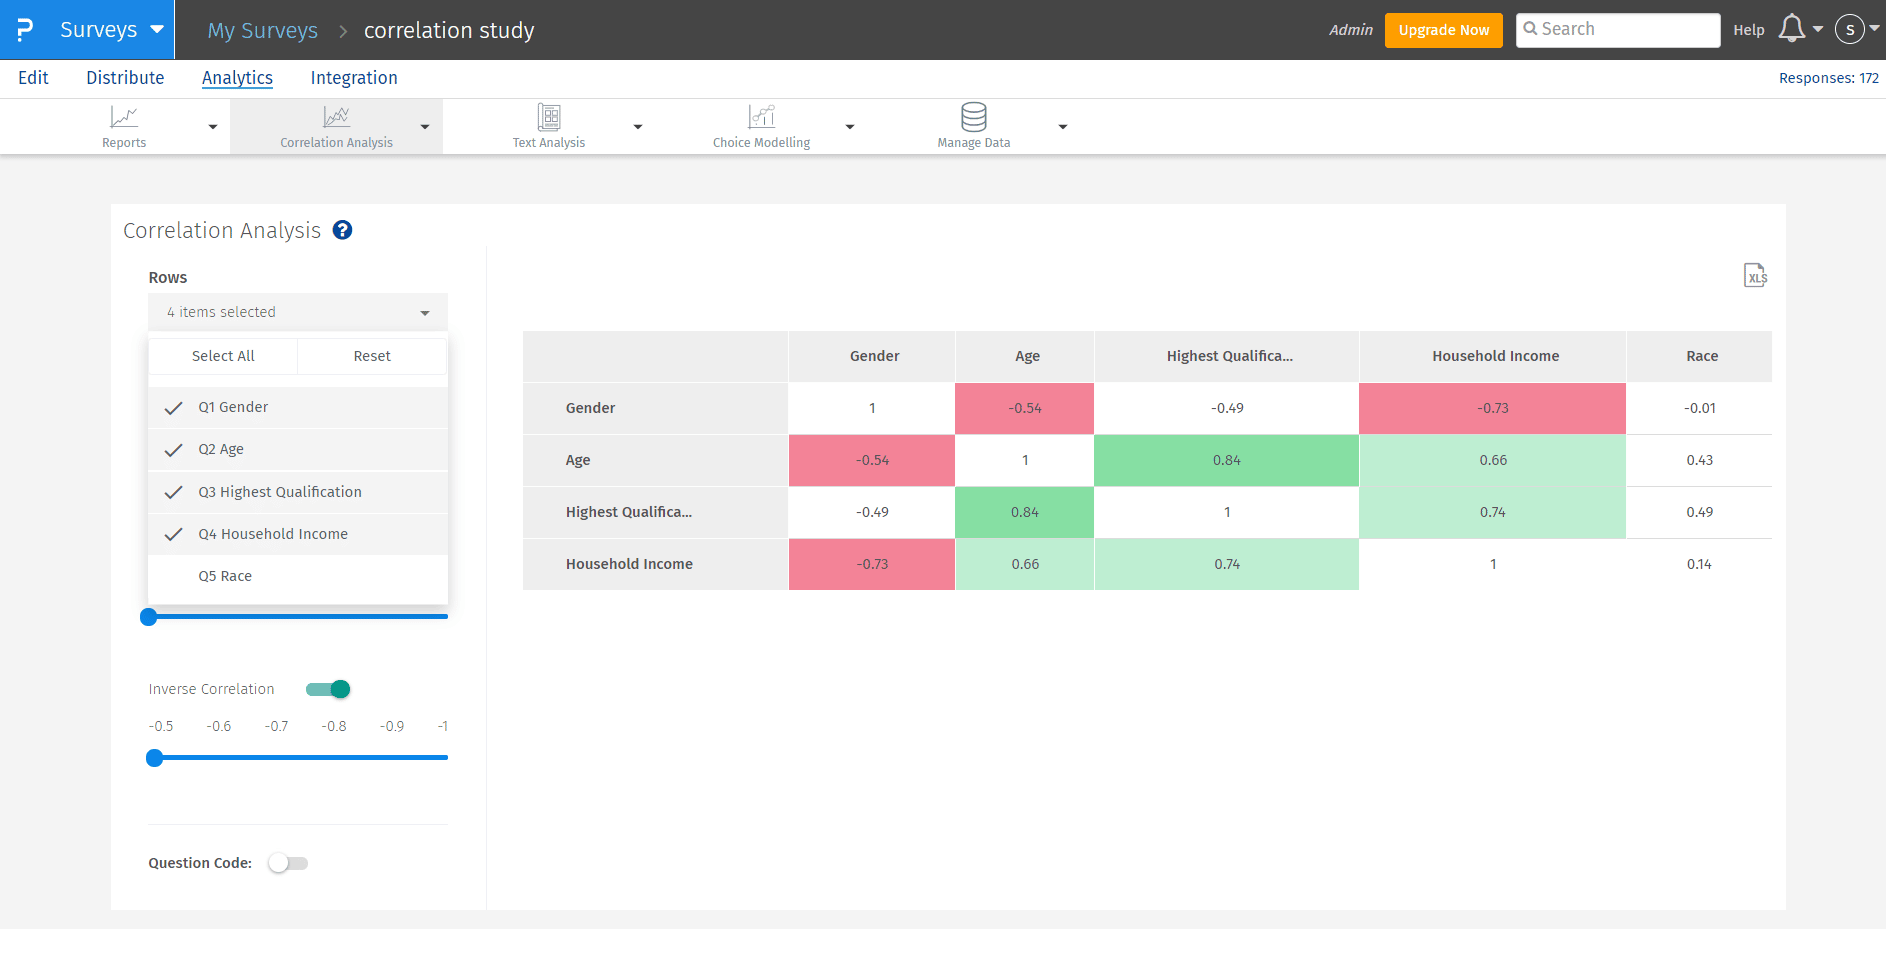
Next, select the specific questions to add in the row and columns on the left side. This will allow you to set up different questions and find strong or weaker correlations between them.

Select questions for correlation analysis

Setting thresholds

Once you have selected your row and columns, you can dictate the threshold of strength for the correlation tool to highlight. The lowest is 0.5 and the highest is 0.99. The default is 0.65 but you can move it up or down as you wish. Set the threshold for high and inverse correlation by slides both scales.

Highlighting the results

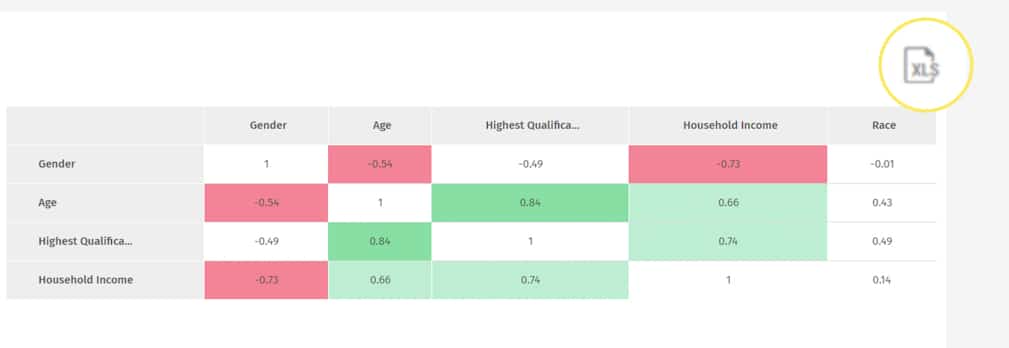
The positive correlation highlights fall into three buckets:

  • Values till 0.8 is highlighted in light green
  • 0.8 to 0.9 is highlighted in medium green
  • 0.9 and above are highlights in a dark green

The negative correlation highlights fall into three buckets:

  • Values till 0.8 is highlighted in light red
  • 0.8 to 0.9 is highlighted in medium red
  • 0.9 and above are highlights in a dark red
Highlight Correlation analysis results

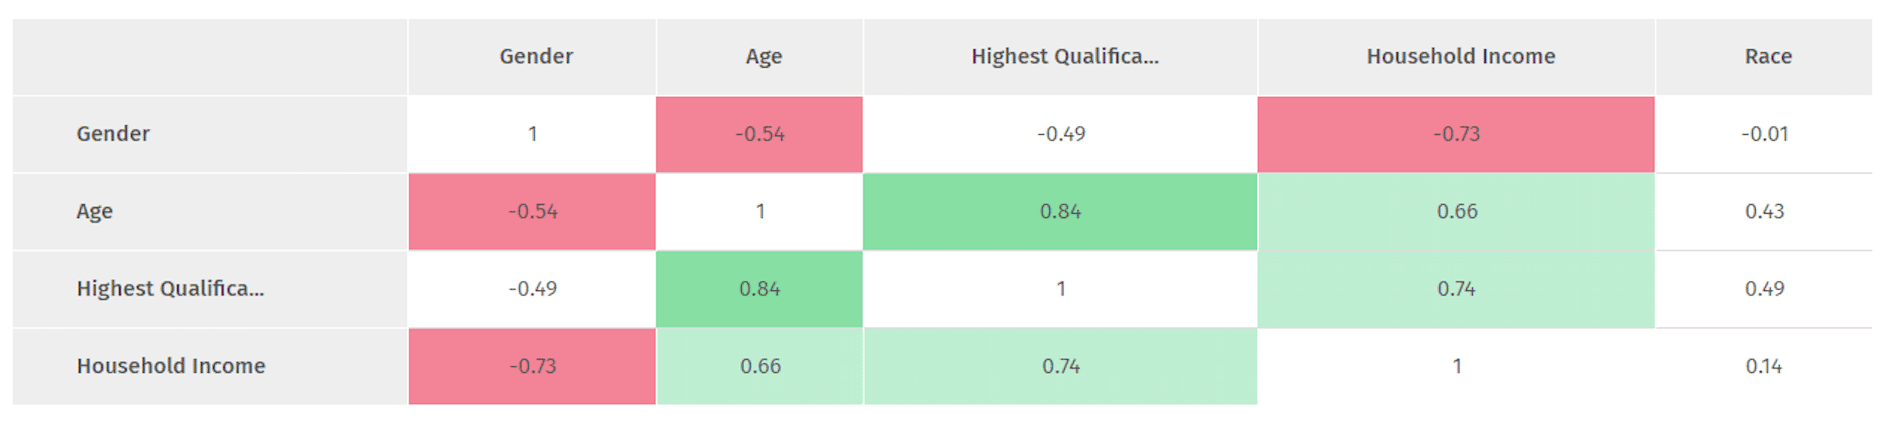
Keep in mind that moving the threshold slider will change the highlighted results.

Curious to learn about correlation matrix? QuestionPro recently published a blog aboutt it. Explore to learn about it.

Output for analysis

In addition to the highlighted online report, you can download an offline excel. To download go to the top right side of the correlation report and click on the xls icon to download the offline report.

Download correlation analysis reports

Correlation analysis is available for all licensed users with a corporate, team, and enterprise license.  

To learn more about correlation analysis or you would like to upgrade your license to have access to this tool, contact our sales team and we’ll be happy to get you started.

SHARE THIS ARTICLE:

About the author
Anup Surendran
VP Product Growth at QuestionPro. Focused SaaS Companies. Growth Marketing, Marketing Strategy, Pricing Strategy, and Product Marketing.
View all posts by Anup Surendran

Primary Sidebar

Gain insights with 80+ features for free

Create, Send and Analyze Your Online Survey in under 5 mins!

Create a Free Account

RELATED ARTICLES

HubSpot - QuestionPro Integration

Top Usability Testing Methods: Unleash User-Centric Insights

Jul 14,2023

HubSpot - QuestionPro Integration

Patient Experience: Massachusetts General Hospital (MGH)

Jul 21,2023

HubSpot - QuestionPro Integration

Hilton Customer Experience: Exploring Notable Programs

Sep 18,2023

BROWSE BY CATEGORY

  • Academic
  • Academic Research
  • Artificial Intelligence
  • Assessments
  • Audience
  • Brand Awareness
  • Business
  • Case Studies
  • Communities
  • Consumer Insights
  • Customer effort score
  • Customer Engagement
  • Customer Experience
  • Customer Loyalty
  • Customer Research
  • Customer Satisfaction
  • CX
  • Employee Benefits
  • Employee Engagement
  • Employee Engagement
  • Employee Retention
  • Enterprise
  • Events
  • Forms
  • Friday Five
  • General Data Protection Regulation
  • Guest Post
  • Insights Hub
  • Life@QuestionPro
  • LivePolls
  • Market Research
  • Marketing
  • Mobile
  • Mobile App
  • Mobile diaries
  • Mobile Surveys
  • New Features
  • non-profit
  • NPS
  • Online Communities
  • Polls
  • Question Types
  • Questionnaire
  • QuestionPro
  • QuestionPro Products
  • Release Notes
  • Research Tools and Apps
  • Revenue at Risk
  • Startups
  • Survey Templates
  • Surveys
  • Tech News
  • Tips
  • Training
  • Training Tips
  • Trending
  • Tuesday CX Thoughts (TCXT)
  • Uncategorized
  • VOC
  • Webinar
  • Webinars
  • What’s Coming Up
  • Workforce
  • Workforce Intelligence

Footer

MORE LIKE THIS

Medtech Market Research

MedTech Market Research: Fueling Innovation in 2025

May 8, 2025

customer-retention-strategies

15 Top Customer Retention Strategies to Boost Loyalty in 2025

May 8, 2025

the-home-depot-nps-2025

The Home Depot NPS & Customer Satisfaction 2025

May 7, 2025

panel-research-companies

Top 8 Panel Research Companies for Quality Research in 2025

May 6, 2025

Other categories

  • Academic
  • Academic Research
  • Artificial Intelligence
  • Assessments
  • Audience
  • Brand Awareness
  • Business
  • Case Studies
  • Communities
  • Consumer Insights
  • Customer effort score
  • Customer Engagement
  • Customer Experience
  • Customer Loyalty
  • Customer Research
  • Customer Satisfaction
  • CX
  • Employee Benefits
  • Employee Engagement
  • Employee Engagement
  • Employee Retention
  • Enterprise
  • Events
  • Forms
  • Friday Five
  • General Data Protection Regulation
  • Guest Post
  • Insights Hub
  • Life@QuestionPro
  • LivePolls
  • Market Research
  • Marketing
  • Mobile
  • Mobile App
  • Mobile diaries
  • Mobile Surveys
  • New Features
  • non-profit
  • NPS
  • Online Communities
  • Polls
  • Question Types
  • Questionnaire
  • QuestionPro
  • QuestionPro Products
  • Release Notes
  • Research Tools and Apps
  • Revenue at Risk
  • Startups
  • Survey Templates
  • Surveys
  • Tech News
  • Tips
  • Training
  • Training Tips
  • Trending
  • Tuesday CX Thoughts (TCXT)
  • Uncategorized
  • VOC
  • Webinar
  • Webinars
  • What’s Coming Up
  • Workforce
  • Workforce Intelligence

questionpro-logo-nw
Help center Live Chat SIGN UP FREE
  • Sample questions
  • Sample reports
  • Survey logic
  • Branding
  • Integrations
  • Professional services
  • Security
  • Survey Software
  • Customer Experience
  • Workforce
  • Communities
  • Audience
  • Polls Explore the QuestionPro Poll Software - The World's leading Online Poll Maker & Creator. Create online polls, distribute them using email and multiple other options and start analyzing poll results.
  • Research Edition
  • LivePolls
  • InsightsHub
  • Blog
  • Articles
  • eBooks
  • Survey Templates
  • Case Studies
  • Training
  • Webinars
  • All Plans
  • Nonprofit
  • Academic
  • Qualtrics Alternative Explore the list of features that QuestionPro has compared to Qualtrics and learn how you can get more, for less.
  • SurveyMonkey Alternative
  • VisionCritical Alternative
  • Medallia Alternative
  • Likert Scale Complete Likert Scale Questions, Examples and Surveys for 5, 7 and 9 point scales. Learn everything about Likert Scale with corresponding example for each question and survey demonstrations.
  • Conjoint Analysis
  • Net Promoter Score (NPS) Learn everything about Net Promoter Score (NPS) and the Net Promoter Question. Get a clear view on the universal Net Promoter Score Formula, how to undertake Net Promoter Score Calculation followed by a simple Net Promoter Score Example.
  • Offline Surveys
  • Customer Satisfaction Surveys
  • Employee Survey Software Employee survey software & tool to create, send and analyze employee surveys. Get real-time analysis for employee satisfaction, engagement, work culture and map your employee experience from onboarding to exit!
  • Market Research Survey Software Real-time, automated and advanced market research survey software & tool to create surveys, collect data and analyze results for actionable market insights.
  • GDPR & EU Compliance
  • Employee Experience
  • Customer Journey
  • Synthetic Data
  • About us
  • Executive Team
  • In the news
  • Testimonials
  • Advisory Board
  • Careers
  • Brand
  • Media Kit
  • Contact Us

QuestionPro in your language

  • English
  • Español (Spanish)
  • Português (Portuguese (Brazil))
  • Nederlands (Dutch)
  • العربية (Arabic)
  • Français (French)
  • Italiano (Italian)
  • 日本語 (Japanese)
  • Türkçe (Turkish)
  • Svenska (Swedish)
  • Hebrew IL (Hebrew)
  • ไทย (Thai)
  • Deutsch (German)
  • Portuguese de Portugal (Portuguese (Portugal))

Awards & certificates

  • survey-leader-asia-leader-2023
  • survey-leader-asiapacific-leader-2023
  • survey-leader-enterprise-leader-2023
  • survey-leader-europe-leader-2023
  • survey-leader-latinamerica-leader-2023
  • survey-leader-leader-2023
  • survey-leader-middleeast-leader-2023
  • survey-leader-mid-market-leader-2023
  • survey-leader-small-business-leader-2023
  • survey-leader-unitedkingdom-leader-2023
  • survey-momentumleader-leader-2023
  • bbb-acredited
The Experience Journal

Find innovative ideas about Experience Management from the experts

  • © 2022 QuestionPro Survey Software | +1 (800) 531 0228
  • Sitemap
  • Privacy Statement
  • Terms of Use