



A customer satisfaction rating is the score a customer gives when you ask how well a purchase, product, or support interaction met their expectations. Teams usually collect it on a 1 to 5 scale and report it as the percentage of satisfied customers, known as the customer satisfaction score (CSAT).
The number looks simple. Yet the scale you pick, the formula you use, and the benchmark you compare against all change what the rating means.
In this guide, we’ll cover scales, calculation, benchmarks, examples, and the mistakes that skew results.
What is a customer satisfaction rating?
A customer satisfaction rating is one customer’s score for how well a product, service, or interaction met their expectations. Companies collect it with a single survey question, then combine many ratings into a CSAT percentage.
The rating can follow any moment in the customer journey, such as:
- A purchase or checkout
- A delivery
- A support chat or call
- An onboarding session
The survey question stays short. Customers answer on a scale, for example, 1 (very dissatisfied) to 5 (very satisfied).
Two terms often get mixed up. The rating is one person’s answer. The CSAT score is the combined result of many ratings.
Sample customer satisfaction rating questions
Good questions name the specific experience. Vague questions produce vague data.
- “How satisfied are you with your purchase experience?”
- “How would you rate the help you received from our support team today?”
- “How satisfied are you with the setup process?”
- “What is the main reason for your rating?” (open-text follow-up)
How is a customer satisfaction rating different from NPS, CES, and other metrics?
A customer satisfaction rating measures how a customer felt about one experience. Other metrics measure loyalty, effort, or behavior, so they answer different questions.
| Metric | What it measures | Typical scale | Best used for |
|---|---|---|---|
| Customer satisfaction rating (CSAT) | Satisfaction with one interaction or experience | 1 to 5 | Support, delivery, onboarding |
| Net Promoter Score (NPS) | Likelihood to recommend, a loyalty signal | 0 to 10 | Overall relationship health |
| Customer Effort Score (CES) | How easy it was to get something done | Varies, often 1 to 5 or 1 to 7 | Checkout, self-service, support |
| Customer Service Satisfaction (CSS) | Satisfaction with service staff only | 1 to 5 | Agent coaching |
| Customer churn rate | Share of customers who leave in a period | Percentage | Retention trends |
| Customer health score | Blend of usage, engagement, and churn risk | Index, varies by company | Account management |
| Online customer reviews | Public ratings and comments on review sites | Often 1 to 5 stars | Reputation and unprompted feedback |
| ACSI | National and industry satisfaction index | 0 to 100 | External benchmark |
Think of CSAT as a snapshot and NPS as a relationship check. A customer can rate one support call a 5 and still never recommend you.
Customer Effort Score fills a third gap. It shows how hard customers worked to get an outcome, which often predicts repeat behavior better than a mood rating does.
Why does a customer satisfaction rating matter?
A customer satisfaction rating matters because it links how customers feel to what they do next, which is stay, spend, or leave. It also tells you where to fix the experience first.
Retention and revenue
Keeping customers costs far less than replacing them. Two figures from Harvard Business Review show the scale:
- Winning a new customer can cost five to 25 times more than keeping an existing one.
- Bain & Company research cited in the same article found that a 5% rise in retention can lift profits by 25% to 95%.
Falling ratings can also signal customer churn risk. That makes them an early warning, not just a report card.
Feedback you can act on
Every low rating points to a pain point. Segment ratings by channel, product, or team, and patterns appear fast. Say chat support averages 4.5 while phone support averages 3.1. That gap tells you where to look first.
Advocacy and engagement
Satisfied customers talk. A steady rating helps you track whether that goodwill is growing. Engaged customers tend to:
- Leave positive reviews
- Join loyalty programs
- Answer later surveys
- Refer friends
When every team sees the same rating, customer satisfaction stops being a support-only concern. Each team can tie its work to one number customers actually gave them:
- Product uses it to rank fixes.
- Operations uses it to spot delivery gaps.
- Marketing uses it to find proof points.
What types of customer satisfaction rating scales exist?
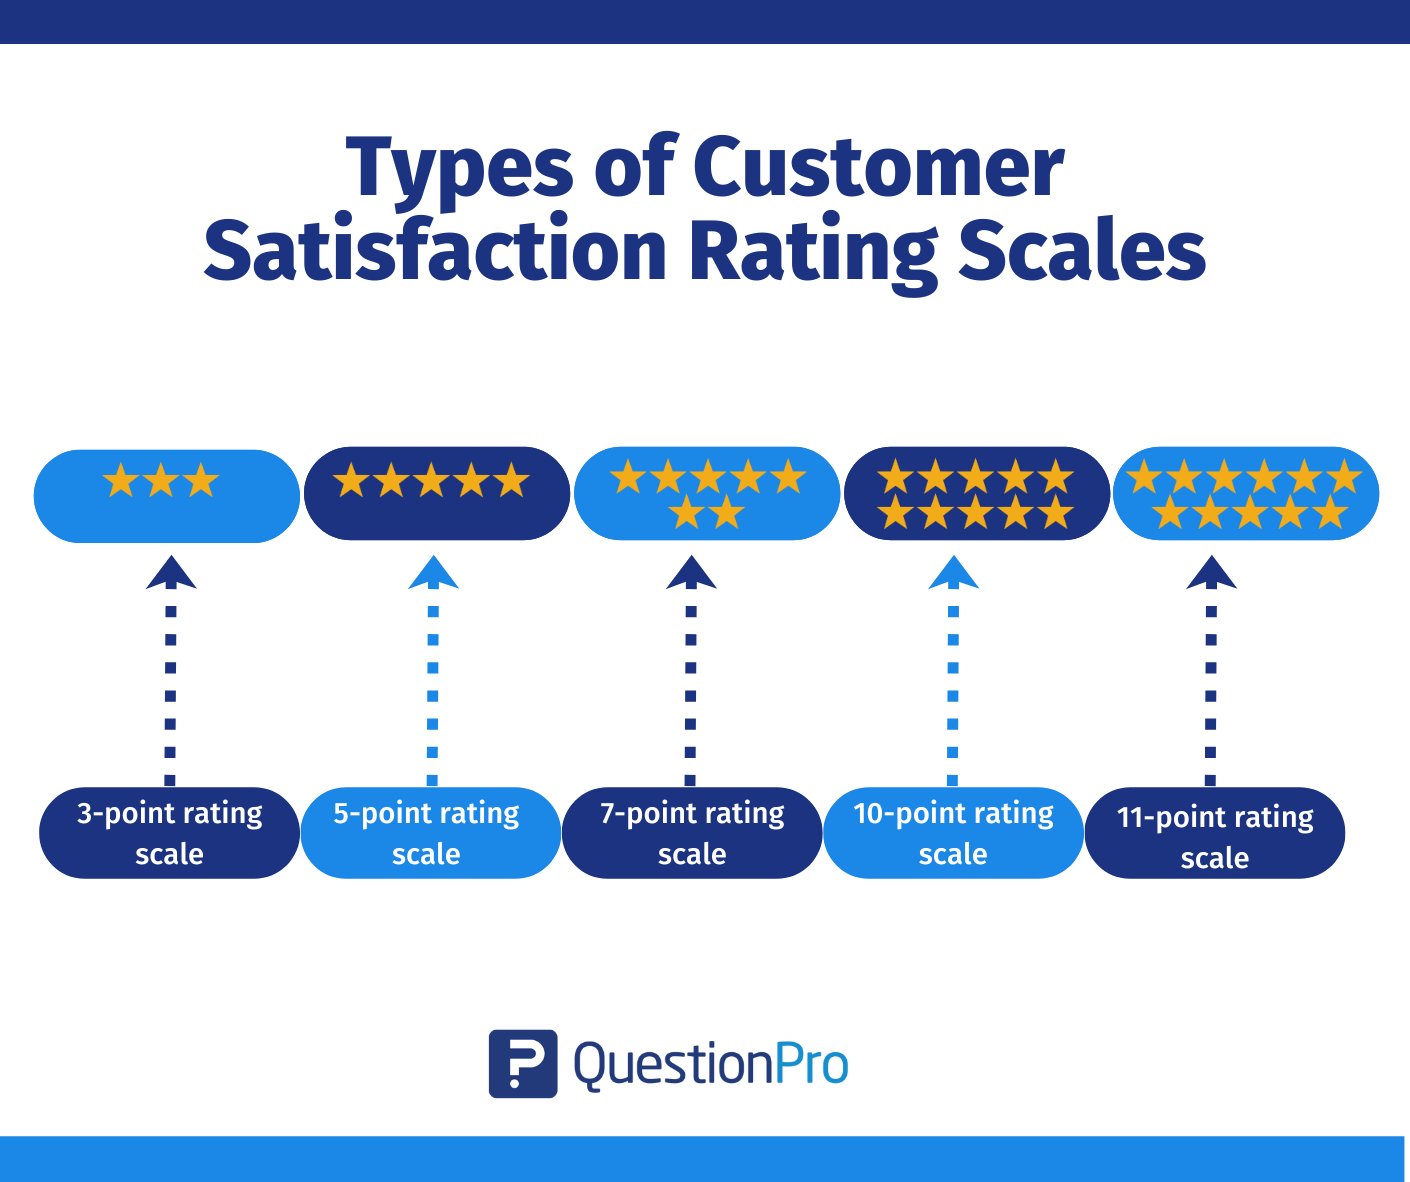
Customer satisfaction rating scales range from 3 to 11 points. More points give finer detail, while fewer points make answering faster.
3-point scale
The 3-point scale offers positive, neutral, and negative answers, often as smiley faces.
- Best for: Tight spaces, such as a kiosk or a text message.
- Limit: “Satisfied” and “very satisfied” collapse into one answer.
5-point scale
The 5-point scale is the most common choice for CSAT. The labels run:
- 1 = very dissatisfied
- 2 = dissatisfied
- 3 = neutral
- 4 = satisfied
- 5 = very satisfied
Most teams count 4s and 5s as “satisfied.” It balances detail with speed, and customers understand it at a glance.
7-point scale
A 7-point scale adds shades between the extremes. Researchers use it when they want to separate mild from strong opinions, for example, on a newly launched product. It takes longer to answer, especially on a phone.
10-point scale
A 10-point scale captures fine differences, but customers struggle to tell a 6 from a 7. Teams that use it often group scores.
- Grouping example: Zendesk’s guide treats 9 and 10 as very satisfied and 7 and 8 as satisfied.
- Trade-off: More detail, but slower and harder to answer.
11-point scale (0 to 10)
The 0 to 10 scale is the one NPS uses. It adds a true zero for “not at all.” Use it when you want your satisfaction question to match your NPS question, so results line up in one report.
How do you choose the right customer satisfaction rating scale?
Choose the scale that fits your channel, your audience, and the decision the data will drive. Then keep it the same for as long as you want to compare results over time.
| Situation | Recommended scale | Why |
|---|---|---|
| Quick post-support survey | 5-point | Fast to answer and easy to read in reports |
| Mobile or SMS survey | 3-point or 5-point with icons | Fits small screens and lifts completion |
| Product research with detailed opinions | 7-point | Separates mild from strong views |
| Match your NPS program | 0 to 10 | One scale across both metrics |
| Executive reporting | 5-point, top-2-box | A single clear percentage |
Three rules apply whatever you pick:
- Label every point or at least both ends, so “5” always means the same thing.
- Decide on a neutral midpoint. Odd scales allow “neutral,” while even scales force a lean.
- Never change the scale mid-year. A switch breaks every trend line you built.
How do you calculate a customer satisfaction rating?
You calculate a customer satisfaction rating by dividing the number of satisfied responses by total responses, then multiplying by 100. This is the standard CSAT formula. For a full walkthrough of collection and reporting, see how to measure customer satisfaction.
The percentage method (top-2-box)
On a 5-point scale, “satisfied” means a 4 or 5. That grouping is called top-2-box because it counts the top two answer options.
CSAT (%) = (satisfied responses ÷ total responses) × 100
Example: 150 of 200 respondents answered 4 or 5. That gives (150 ÷ 200) × 100 = 75%.
The average method
Some teams report the mean rating instead, such as 3.98 out of 5. The mean uses every answer, but it hides the split between happy and unhappy customers. Pick one method and state it in every report.
A worked example
| Rating | Responses |
|---|---|
| 1 (very dissatisfied) | 10 |
| 2 (dissatisfied) | 15 |
| 3 (neutral) | 25 |
| 4 (satisfied) | 70 |
| 5 (very satisfied) | 80 |
| Total | 200 |
Top-2-box: (70 + 80) ÷ 200 = 75%. Average: (10 + 30 + 75 + 280 + 400) ÷ 200 = 3.98 out of 5.
Both numbers describe the same data. They are not interchangeable, so never compare one team’s percentage against another team’s average.
What is a good customer satisfaction rating?
A good customer satisfaction rating is commonly 75% to 85% on a top-2-box basis, with scores above 90% treated as exceptional.
Your industry, channel, and customer mix shift the target. A software trial and a hospital visit do not produce comparable numbers.
Use external indexes as context, not targets
In the US, the American Customer Satisfaction Index (ACSI) publishes national and industry scores on a 0 to 100 scale. ACSI uses its own model, so you cannot compare it directly with your CSAT percentage. Treat it this way:
- Use it to understand the wider mood of US customers.
- Expect outside conditions to move ratings. The Q2 2026 release said national satisfaction declined sharply.
- Do not set your CSAT target from an ACSI number.
Set your own benchmark
The most useful benchmark is your own history. Follow this order:
- Record 3 to 6 months of baseline data.
- Set a target slightly above the baseline.
- Compare against competitors only when the question and scale match.
When should you send a customer satisfaction survey?
Send a customer satisfaction survey right after the experience you want to rate, while the memory is fresh. Long delays make it harder for customers to recall the details.
Good trigger points include:
- Within minutes of a closed support ticket or call
- A day or two after delivery
- After onboarding finishes
- After a key feature rollout
- Ahead of a renewal, early enough to fix problems
Which channels work best for collecting ratings?
Match the channel to where the experience happened. Email suits purchases and renewals. SMS and in-app prompts suit quick, mobile interactions. A rating button inside a live chat or a short phone prompt catches support feedback while it is fresh.
Frequency matters as much as timing. Surveying the same customer after every touchpoint causes survey fatigue, which lowers both response rates and honesty. Many teams cap surveys at one per customer per month, though the right limit depends on how often your customers interact with you.
Customer satisfaction rating examples by industry
Real examples show how the same rating changes with context. Each business below asks one clear question at the moment of the experience.
| Business | Trigger | Sample question | Scale |
|---|---|---|---|
| Online retailer | 24 hours after delivery | “How satisfied are you with your order?” | 5-point |
| SaaS company | End of onboarding | “How satisfied are you with the setup process?” | 5-point |
| Bank contact center | Right after a call | “How satisfied are you with the help you received today?” | 5-point |
| Hotel | At checkout | “How satisfied were you with your stay?” | 3-point icons |
| Outpatient clinic | Text message after a visit | “How satisfied were you with your visit today?” | 5-point |
Take the SaaS row. Suppose 62 of 80 new users score setup a 4 or 5. That gives 77.5%, a healthy result. The open-text answers from the 18 others might reveal that one integration step confuses people. Fixing it is cheaper than losing those accounts.
Step-by-step guide to collecting and acting on customer satisfaction ratings
Collecting ratings only pays off when you analyze them and change something. Follow these five steps in order.
- Collect.
Send a short survey by email, SMS, in-app prompt, or after a live chat. Keep it to one rating question and one open-text follow-up.
- Analyze.
Calculate the CSAT percentage, then split it by channel, product, region, and agent. Report the number of responses beside every score.
- Interpret.
Compare against your baseline and any fair external benchmark. Read the open-text comments for the reasons behind low scores.
- Act.
Assign each theme to an owner, such as a product fix, a training gap, or a policy change. Tell customers what you changed.
- Monitor.
Track the rating monthly. Pair it with other customer satisfaction matrics so that one number never drives every decision.
As a working rule, avoid reporting a segment score built on fewer than about 30 responses. Small samples swing wildly. A single angry customer can move a 10-response score by ten points.
What are the limits and common mistakes of customer satisfaction ratings?
Customer satisfaction ratings are quick and clear, but they capture a moment, not the whole relationship. Knowing the limits keeps you from over-reading a score.
Pros and cons
Pros
- Fast for customers to answer, which lifts response rates
- Easy to calculate and explain to leadership
- Flexible across channels and touchpoints
- Tied to a specific experience, so fixes are clear
Cons
- Reflects a single interaction, not long-term loyalty
- Skews toward very happy and very unhappy customers
- Subject to response bias when only some customers reply
- Varies by culture, since some market researchers note that customers from different backgrounds rate more harshly or more moderately
Mistakes that skew results
Most bad CSAT data comes from process errors, not customers. Watch for these:
- Changing the scale or wording mid-year
- Mixing the percentage method and the average method in one report
- Asking leading questions, such as “How great was our service?”
- Surveying only after good outcomes
- Reporting a score without the response count
- Collecting ratings and never closing the loop with customers
How can you improve your customer satisfaction rating?
You improve a customer satisfaction rating by fixing the causes behind low scores, not by chasing the number. Start with the touchpoint that has the lowest rating and the most customers.
Four moves tend to pay off:
- Read the comments weekly.
Tag themes such as wait time, billing errors, or unclear instructions.
- Shorten the path to a resolution.
Cut handoffs, set honest wait-time messages, and give agents the authority to solve problems on the first contact.
- Close the loop.
Reply to unhappy customers within a day and say what you will change.
- Coach with the data.
Share team-level ratings and best-scoring examples, not just a leaderboard.
Small, visible fixes build trust. When customers see their feedback change something, they have a reason to answer the next survey.
How does QuestionPro connect a customer satisfaction rating to its reason?
A rating tells you how satisfied a customer is. It rarely tells you why. QuestionPro AskWhy closes that gap by combining a rating question, a root-cause question, and a comment box in one survey flow.
A customer who gives a 2 can pick the cause, such as price, delivery, or product quality, and add a comment. Your team then sorts low ratings by cause instead of reading every comment by hand.
QuestionPro Customer Experience carries that data into dashboards where you can track ratings across touchpoints and route issues to the right owner. You can also build the underlying CSAT surveys with QuestionPro survey software and reuse the same scale across every channel.
A rating is where the question starts
A customer satisfaction rating is a useful number only when you know how it was built. The scale, the formula, the timing, and the sample all shape the result.
Three habits keep a rating trustworthy:
- Pick one scale and keep it.
- Use a top-2-box for a clear percentage.
- Compare against your own history before you compare against anyone else.
Most of all, ask why behind every low score. The rating shows you where to look, and the customer’s words show you what to fix.
Frequently Asked Questions (FAQs)
No fixed threshold exists, but sample size matters more than rate. Aim for at least 30 responses per segment you report. Compare responders with your overall customer mix to check that happy or angry customers are not overrepresented.
Use whichever customers read fastest on your channel. Emojis and stars suit mobile and SMS, while numbers suit email and reports. Always map icons to the same numeric values behind the scenes so your CSAT calculation stays consistent.
ACSI is a US index built from its own multi-question model and reported on a 0 to 100 scale. Your CSAT is a percentage from your own survey. Use ACSI as industry context, not as a direct target for your score.
Survey after meaningful moments, not every interaction. Many teams cap requests at one per customer per month. High-contact customers may need a longer gap, and a recent complaint should trigger a follow-up call instead of another survey.
Compare only with caution. Customers in different cultures use scales differently, and each channel reaches a different mix of people. Track each country and channel against its own baseline first, then compare the direction of change instead of raw scores.



