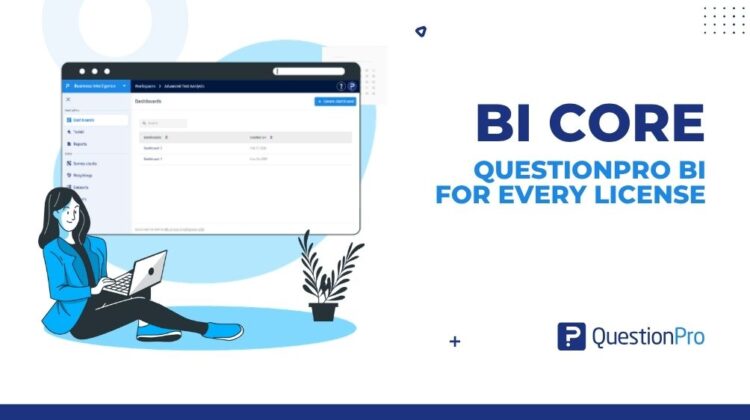
With BI Core, QuestionPro BI is now accessible to everyone with a professional QuestionPro license. You can turn survey responses into visual dashboards, explore the questions behind the results, and share a clearer view with your team, all within the platform you already use. It is an opportunity to get more from the feedback you collect and make those findings part of everyday decisions.
Think about the conversation that follows a survey. A customer experience manager wants to understand satisfaction, a researcher needs to explain the key findings, and a team lead wants to know where to focus next. BI Core gives those conversations a useful starting point: a dashboard that brings relevant results together and helps people explore them with confidence.
See your results come together
A useful dashboard gives your survey a clear focus. With BI Core, you can bring key questions into one view and choose bar, line, pie, or donut widgets to present the answers. Thoughtful data visualization makes comparisons easier to follow, helping colleagues understand the findings and recognize patterns that deserve a closer look. You can organize the dashboard around the purpose of your review, so each chart contributes to the discussion.
For a customer feedback review, that could mean presenting satisfaction results alongside a regional breakdown. For a research project, it could mean bringing the most relevant questions together before a stakeholder meeting. In both cases, a clear visual structure helps you spend less time explaining where to look and more time discussing what the responses mean for your team.
Follow your curiosity
Once the overall picture is clear, the next questions often come naturally. How did customers in different regions respond? Do new customers see things differently from returning ones? Filters and data slicers help you explore those groups and put the headline result in context. As the discussion develops, you can focus on the responses that matter to the question at hand.
For a closer look at relationships between answers, cross-tabulation brings survey variables together for comparison. This gives your team another way to investigate differences across groups and build a more considered interpretation of the results. BI Core makes that exploration part of the reporting process, with room to follow up on an interesting finding while it is still fresh in the conversation.
Bring everyone into the conversation
A dashboard becomes especially useful when the people responsible for the next step can review it together. With dashboard sharing links and PDF exports, BI Core helps you bring findings into team reviews, presentations, and project discussions. Colleagues can work from a common view of the results, making it easier to discuss what stands out and which questions need more attention.
That shared context is also at the heart of workspace collaboration in BI. A chart can show a finding, while the surrounding discussion connects it to the customer experience, research question, or business decision that prompted the survey. By making the evidence easier to present and understand, BI Core helps more people contribute their knowledge and agree on what to explore next.
Start with a win
Your first dashboard can begin with one survey and one decision your team wants to make. Keep it focused, build something useful, and give your colleagues a reason to open it again:
- Pick your question. Start with something your team is already trying to understand.
- Build the view. Choose a few charts that make the relevant results easy to follow.
- Bring someone in. Explore a useful segment together and decide what deserves a closer look.
For example, a team reviewing customer feedback might start with satisfaction results and compare responses across regions. That focused dashboard can help the group recognize what is going well, identify questions for follow-up, and build confidence in using feedback during regular reviews.
Build on the data you already have
As your questions develop, BI Core gives you ways to work with data beyond a single chart. BI datasets help you organize information for reporting, including reusable groups and data from external files. These options bring more context to your findings and help you build reports around the way your team understands its customers, projects, or areas of responsibility.
You can develop that approach at your own pace. Start with a useful dashboard, build a rhythm around reviewing the results, and explore more of QuestionPro BI as new needs emerge. Each review is a chance to refine the questions you ask and make the next discussion more informed.
Your next insight starts here
BI Core brings business intelligence closer to the people who use feedback every day. Through your professional QuestionPro license, you have a place to turn survey responses into clear dashboards, explore meaningful differences, and bring colleagues into the discussion. Open QuestionPro BI, choose a survey, and create a dashboard around a question your team is already asking. It is a practical first step toward making more of the feedback you have.