Raw data does not speak for itself. Whether you are running a customer satisfaction study for an FMCG brand in India, modelling quarterly demand for a retail chain, or analysing employee feedback across five business units of a large enterprise, the quality of your insight depends almost entirely on the tools you use to process, interrogate, and visualise your data. This article focuses on the top data analysis tools, top data analytics tools, and top data solutions that are shaping the analytics landscape for Indian teams today.
The problem is not a shortage of options. It is the opposite. The landscape of popular data analysis tools in 2026 spans everything from free spreadsheet software to enterprise-grade statistical platforms, from no-code dashboards to full programming environments. Identifying the best data analytics tool for your needs can be challenging in such a crowded field. India’s analytics ecosystem is an active participant in this complexity, with teams making tool decisions that affect everything from market research methodology to enterprise AI deployment. Choosing the wrong tool wastes time, limits analytical depth, and often means repeating work.
This guide covers the 13 best tools for analysis of data across every major category: survey and research analytics, statistical computing, business intelligence (BI), qualitative analysis, and digital analytics. Data analysts, data scientists, and data engineers rely on these tools for data visualization, data mining, and predictive analytics to extract actionable insights. The increasing adoption of Python, supported by its strong open-source community and readability, continues to drive innovation across India’s growing data science ecosystem, from product analytics teams to academic computing labs. Each tool is evaluated on its strengths, limitations, and relevance for Indian researchers, business analysts, and data teams. If you are looking to understand the broader process first, start with our guide on data analysis in research before returning here to compare tools.
What Are Data Analysis Tools?
Data analysis tools are software platforms, programming languages, or applications that help users collect, clean, process, model, and visualise data to extract meaningful insights. These tools enable data analysts and other professionals to analyze data, derive meaningful insights, and gain valuable insights from raw data. They are the practical instruments through which raw data, such as survey responses, transaction records, web events, and experimental results, is transformed into decisions.
In the Indian context, this transformation is happening at scale and speed. India produces large volumes of digital and transactional data across payments, commerce, public services, mobile apps, and online behaviour. The organisations that extract competitive advantage from this data are those that have chosen their analysis tools deliberately and built workflows to match.
A data analysis tool typically enables one or more of the following:
- Data ingestion: Importing data from multiple sources such as spreadsheets, databases, APIs, and survey platforms.
- Data cleaning: Identifying and resolving missing values, duplicates, outliers, and formatting inconsistencies.
- Extracting data: Pulling relevant data from various sources as a fundamental step in the analysis workflow.
- Statistical analysis: Running descriptive statistics, inferential tests, regression models, or machine learning algorithms.
- Visualisation: Generating charts, dashboards, and reports that communicate findings to non-technical stakeholders.
- Collaboration: Sharing analyses, annotating findings, and exporting results across teams.
These tools convert raw data and transform raw data into actionable insights and valuable insights, streamlining data pipeline management and reducing manual work and errors. This is essential for effective decision-making in environments ranging from a market research agency in Mumbai to a credit risk modelling team at an Indian bank. Modern data analysis tools fall into several categories, including statistical software, business intelligence platforms, database analytics software, programming environments, and visualization applications, each serving different needs in the data processing pipeline.
It is important to distinguish between data analysis and data analytics. Data analysis focuses on examining and interpreting a specific dataset. Data analytics is the broader discipline that encompasses data pipelines, predictive modelling, and strategic decision-making. Most tools discussed here serve both, but their primary strength lies in analysis.
Types of Data Analysis Tools
Before selecting a tool, it helps to understand the category it belongs to. Each type serves a different analytical need, and different tools are designed to handle both structured data, such as tables in relational databases, and unstructured data, like text, images, or social media feeds. In India, where analytical teams often span a wide range of technical skill levels, from trained data scientists at product companies to non-technical business analysts at traditional enterprises, understanding these categories is the first step toward a practical tool selection.
- Survey and research analytics platforms collect primary data and provide built-in analysis: cross-tabulation, significance testing, text analytics, and dashboards. These are core tools for India’s market research, CX, EX, and academic research teams.
- Statistical computing tools such as R, Python, SPSS, and SAS are used for advanced modelling, hypothesis testing, machine learning, statistical modeling, data modeling, and compatibility with various data formats. R programming is widely used for statistical computing and data modeling, making it useful for research, academic projects, and industry-level analytics at Indian universities and research institutes. Its packages support analytical tasks including statistical modeling, machine learning, and text mining.
- BI and visualisation tools such as Tableau, Power BI, and Looker Studio are used for dashboards, data storytelling, data integration, and data warehouse capabilities. Power BI is especially common in Indian enterprises because many teams already use Microsoft 365.
- Qualitative analysis tools such as NVivo and MAXQDA are used for thematic analysis of interviews, focus groups, and open-ended text. These are useful for academic institutions, public policy research, UX research, and qualitative market research teams in India.
- Spreadsheet tools such as Excel and Google Sheets are used for exploratory analysis, pivot tables, basic charting, structured data management, and complex data manipulation. Excel remains dominant in India’s SMB sector, finance teams, operations teams, and consulting workflows.
- Digital analytics tools such as Google Analytics 4 and Adobe Analytics are used for web, app, and marketing performance, often supporting data integration and various data formats. These are essential for India’s e-commerce, SaaS, fintech, D2C, and digital marketing teams.
- Visual workflow and data engineering tools such as KNIME and Alteryx are used for designing data pipelines without writing code, supporting data integration, data storage, and compatibility with multiple data formats.
Relational databases and structured query language (SQL) are foundational for database analytics software, enabling efficient management, querying, and transformation of structured data. SQL proficiency is consistently important for data analyst roles in India because it helps analysts, data scientists, and data engineers extract, transform, and load data effectively. SQL allows users to perform complex queries, join multiple datasets, and conduct data transformations, which are crucial for deriving insights from structured data.
Data science tools, including programming environments like Python and R, are essential for advanced analytics, machine learning, and integrating with various data storage and data warehouse solutions.
Most organisations use a combination of these. A common setup is a survey or research platform for primary data, a BI tool for dashboards, and a statistical tool for deeper modelling. For a comprehensive comparison of tools, see our post on data analysis tools.
The 13 Best Tools for Analysis of Data in India in 2026
The following tools are evaluated across research, business, and academic contexts. Each has been selected based on capability, adoption relevance in the Indian market, and usefulness for the key analytical tasks organisations face today. When evaluating tools for analysis of data, it is crucial to consider data quality, data security, and the ability to handle real-time data, as these factors ensure accurate, reliable, and timely insights. India’s Digital Personal Data Protection Act, 2023, has also added a compliance dimension to tool selection, particularly for organisations handling survey responses, consumer profiling data, or employee feedback. Choosing the right data analysis tool is essential to maximize efforts and meet professional goals, so it is important to assess your organisation’s specific needs and the level of technical expertise required.
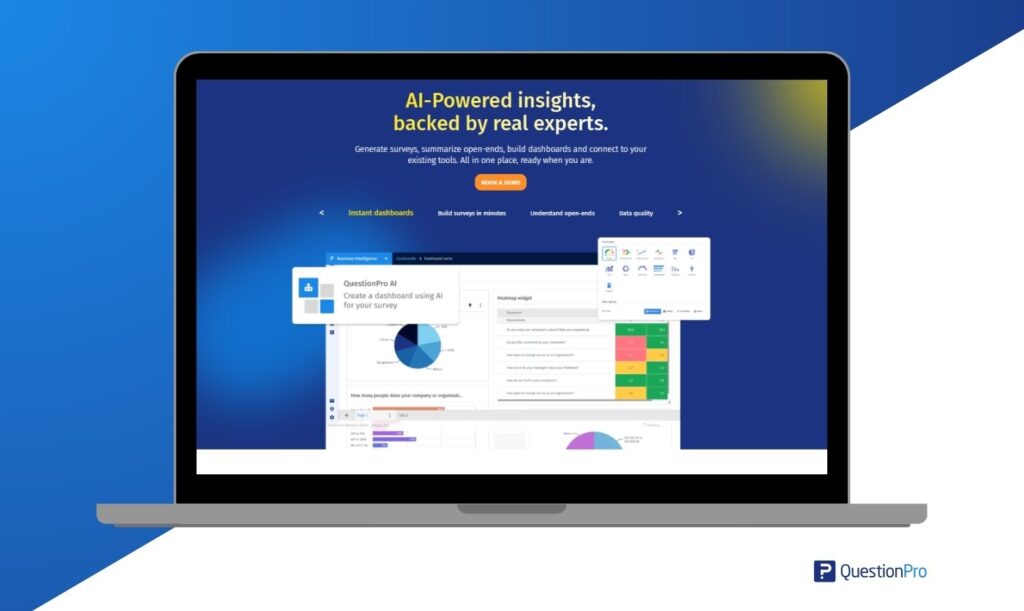
1. QuestionPro
QuestionPro is a survey and research analytics platform purpose-built for collecting and analysing primary data, the data that comes directly from customers, employees, and research respondents. It is a strong fit for research and corporate settings across India, particularly for market research agencies, FMCG companies, BFSI institutions, HR functions, academic researchers, and CX teams. QuestionPro enables data analysts to interpret and act on business data, empowering professionals to uncover actionable insights from company-wide information.
| Category | Survey and Research Analytics |
|---|---|
| Best For | Market research, customer experience (CX), employee experience (EX), academic research |
| India Pricing | Free plan available; paid plans and Research Suite pricing vary by requirements |
| Key Strength | End-to-end: survey design → data collection → built-in analytics → BI integrations |
What distinguishes QuestionPro from generic survey tools is the depth of its analytical layer. The platform supports:
- Cross-tabulation and banner tables for segmentation analysis.
- Statistical significance testing across demographic and attitudinal variables.
- TextAI for sentiment analysis and keyword extraction from open-ended responses, useful for survey data analysis at scale, including large-sample consumer research across India’s diverse regional markets.
- Driver analysis and MaxDiff / conjoint for advanced market research studies.
- InsightsHub, a centralised research repository that stores, tags, and makes past study data searchable, enabling longitudinal analysis across multiple projects.
- API integrations with Power BI, Tableau, Salesforce, and HubSpot for pushing research data into your broader analytics stack.
- Data integration with other analytics platforms to streamline workflows and enable real-time analytics.
For Indian organisations, QuestionPro’s multilingual survey support, covering Indian languages such as Hindi, Tamil, Telugu, Bengali, Marathi, Gujarati, Kannada, and more, is a practical requirement, not just a feature differentiator. India’s FMCG and consumer goods researchers often run studies in multiple languages across metro and tier-2 markets. The platform’s offline CAPI mode enables fieldwork in locations where internet connectivity is inconsistent, which is useful for research beyond India’s largest metros. India-specific pricing and enterprise options make it a practical choice across organisational scales, from a startup research function to a pan-India CX programme.
2. Microsoft Excel
Excel remains one of the most widely used data programs in the world, not because it is the most powerful tool, but because it is ubiquitous, versatile, and familiar. In India, Excel is the de facto standard across SMBs, CA and CS firms, banking back-office operations, operations teams, and family-run enterprises that form the backbone of the MSME sector. Its user-friendly interface and widespread familiarity make it a popular choice for data analysis, especially for quick analysis and financial modeling. For exploratory analysis, basic statistical summaries, pivot tables, and quick visualisations, Excel is often the fastest path from raw data to insight.
| Category | Spreadsheet / Basic Analytics |
|---|---|
| Best For | Exploratory analysis, pivot tables, financial modelling, quick charts |
| India Pricing | Affordable, included in Microsoft 365 plans |
| Key Strength | Accessible to non-technical users; supports various data formats; offers strong visualization capabilities for charts and dashboards; handles most day-to-day analytical tasks |
Excel’s limitations become apparent with large datasets, complex statistical modelling, and reproducible research workflows. In India’s analytics job market, Excel proficiency is treated as a baseline expectation, but candidates who position it as their primary analytical tool for anything beyond basic operations may need to show additional skills. For anything requiring statistical rigour, such as hypothesis testing, regression analysis, or machine learning, Excel should be used as a starting point, not the final analytical environment.
3. Python
Python has become the default language for data science and advanced analytics in corporate environments globally and is highly relevant in India’s growing data science ecosystem. Product companies, IT services firms, analytics consultancies, and startups in cities such as Bengaluru, Hyderabad, Pune, Chennai, and Gurugram use Python for client-facing analytics, automation, product analytics, and machine learning workflows. Its core libraries, including Pandas for complex data manipulation and data mining, NumPy for numerical computing, Matplotlib and Seaborn for visualisation, and Scikit-learn for machine learning, predictive analytics, and building predictive models, cover the full data analysis process from ingestion to model deployment.
| Category | Statistical Programming Language |
|---|---|
| Best For | Machine learning, predictive modelling, data engineering, automation |
| India Pricing | Free, open source |
| Key Strength | Unmatched flexibility; the standard for ML, AI-driven analysis, complex data manipulation, data mining, predictive analytics, predictive models, and statistical modeling |
Python’s primary limitation is its learning curve. Non-technical business users in Indian enterprises, particularly in traditional industries such as manufacturing, logistics, and distribution, cannot pick it up quickly, and results are not directly presentation-ready without additional visualisation work. It is best suited to organisations that have, or are building, a dedicated data science capability. Python is also one of the most valuable skills for professionals building careers in analytics across India.
4. R and RStudio
R is a leading data science tool preferred by academic researchers, biostatisticians, and quantitative market researchers worldwide. In India, R is commonly used in universities, business schools, research institutions, and quantitative research teams where statistical rigour and methodological reproducibility are important. Indian market research agencies and BFSI quantitative teams may also use R for psychometric testing, conjoint analysis, and complex segmentation studies where paid statistical packages are not always practical. RStudio, the companion IDE, further enhances accessibility and workflow efficiency.
| Category | Statistical Computing Environment / Data Science Tool |
|---|---|
| Best For | Academic research, statistical modeling, data modeling, psychometrics, market research |
| India Pricing | Free, open source |
| Key Strength | Deep statistical and graphical toolkit, with broad support for data formats and advanced modeling capabilities |
R’s weakness is its steep learning curve for general business users and its relatively weaker performance on very large datasets compared to Python. However, for market research agencies and academic institutions in India, R is widely used for survey data analysis, particularly for SPSS-equivalent work at zero licensing cost. This makes it a practical recommendation for price-sensitive research teams and doctoral researchers across Indian universities.
5. IBM SPSS Statistics
SPSS has been a mainstay of quantitative data analysis in social science research, market research agencies, and academic institutions for over five decades. In India, it is common in university curricula across social sciences, psychology, management, and commerce programmes. Government research units and research teams working with large-sample survey data may also rely on SPSS for structured statistical processing. Its graphical interface allows researchers and data analysts to run complex statistical procedures, such as regression, ANOVA, factor analysis, cluster analysis, and chi-square tests, without writing code.
| Category | Statistical Analysis Software |
|---|---|
| Best For | Social science research, survey analysis, BFSI, academic studies |
| India Pricing | Premium, contact IBM for India pricing |
| Key Strength | Point-and-click statistical analysis for non-programmers; robust handling of structured data and SQL-based data management |
SPSS is useful in Indian universities, market research agencies, and BFSI companies where statistical rigour is required but programming skills are limited. Its primary drawback is cost. Organisations with programming capacity can replicate many SPSS workflows in R or Python for free, and this trade-off is well understood in India’s research community. Institutional licences may remain the most cost-effective route for Indian universities.
6. SAS
SAS, or Statistical Analysis System, is entrenched in pharma, BFSI, and large enterprise sectors. In India, it is relevant for clinical trial data analysis, regulatory submissions, credit risk modelling, anti-money laundering analytics, and enterprise data governance workflows. Regulated industries often prefer tools with strong auditability, documentation, and long-standing compliance acceptance.
| Category | Enterprise Analytics and Statistical Software |
|---|---|
| Best For | Pharma, BFSI, regulated industries, enterprise data management |
| India Pricing | Enterprise pricing, contact SAS for India rates |
| Key Strength | Regulatory compliance, enterprise data governance, data security, data quality, advanced predictive modelling |
SAS is among the most expensive tools on this list. For organisations that do not operate in regulated industries, the cost is rarely justified. Python and R replicate many SAS workflows at zero licensing cost for teams with the relevant technical capability. However, for Indian pharma and BFSI firms with existing SAS infrastructure and regulatory workflows built around it, migration costs and compliance risk make switching a multi-year decision rather than a straightforward one.
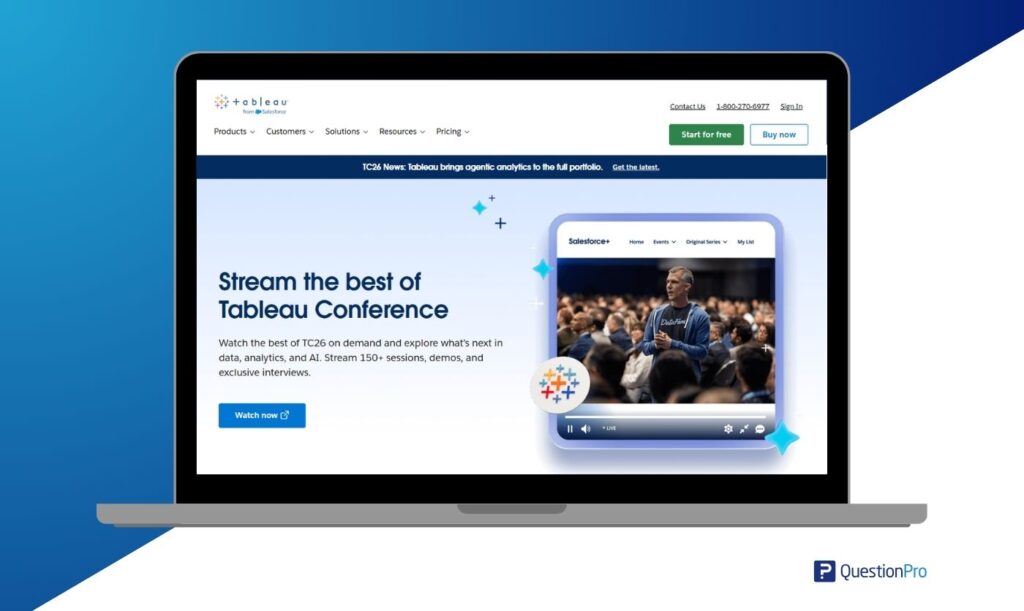
7. Tableau
Tableau is one of the leading tools for data visualization and interactive dashboarding. It is widely adopted across India’s enterprise, consulting, and analytics sectors for client-facing analytics dashboards, data storytelling, and executive performance reporting. Its user-friendly drag-and-drop interface makes it accessible for non-technical users to build visually appealing dashboards and reports, and it connects to hundreds of data sources, producing presentation-quality visuals that stakeholders can explore independently.
| Category | BI and Data Visualization |
|---|---|
| Best For | Interactive dashboards, executive reporting, multi-source data analysis |
| India Pricing | Premium, Tableau Creator pricing varies by plan and region |
| Key Strength | Strong visualization capabilities; drag-and-drop interface for complex data; real-time data analytics |
Tableau’s main strength lies in data visualization and exploration, transforming raw data into meaningful and comprehensive visual representations, making it easier to spot patterns and trends. For organisations that need advanced statistical analysis, Tableau works best as the reporting layer on top of Python, R, or a survey analytics platform. Tableau skills are relevant for Indian data analyst and BI developer roles, especially in IT services, consulting, and analytics teams.
8. Microsoft Power BI
Power BI is one of the most widely used BI tools in India’s enterprise market, driven largely by its inclusion in the Microsoft ecosystem that many large and mid-market Indian organisations already licence. It has strong use cases across BFSI, IT services, manufacturing, retail, and the public sector. Power BI’s AI-assisted capabilities, including natural language querying in some plans, are useful for business analysts who need analytical output without deep technical training.
| Category | BI and Visualisation |
|---|---|
| Best For | Enterprise dashboards, Microsoft ecosystem integration, self-service reporting |
| India Pricing | Affordable for many Microsoft 365 customers; pricing depends on licence type |
| Key Strength | Deep Microsoft ecosystem integration; cost-effective for M365 customers; advanced visualization capabilities; strong data integration and real-time data support; connects to data warehouse solutions |
Power BI is excellent for operational reporting and executive dashboards. However, it is less suited to exploratory statistical analysis or qualitative data. Its visualisation quality, while strong, is generally considered less flexible than Tableau for complex, bespoke analytical presentations. Many Indian enterprise teams accept this trade-off because Power BI can offer lower total cost of ownership within an existing Microsoft 365 environment.
9. Google Looker Studio
Formerly Google Data Studio, Looker Studio is a free, cloud-native BI and reporting tool that is commonly used among India’s digital marketing teams, D2C brands, agencies, startups, and SMBs. India’s digital-first brands, performance marketing agencies, and growth teams rely on Looker Studio for campaign performance reporting, SEO dashboards, and growth tracking, especially because it integrates well with Google Analytics, Google Ads, Google Search Console, and BigQuery.
| Category | BI and Visualisation, Cloud-Native |
|---|---|
| Best For | Digital marketing dashboards, SEO reporting, SMB analytics |
| India Pricing | Free |
| Key Strength | Zero cost; excellent Google ecosystem data integration; strong visualization capabilities; ability to create interactive dashboards with real-time data |
Looker Studio lacks the statistical depth of Tableau or Power BI. It is best suited to teams whose primary analytical need is marketing performance reporting and whose data lives within the Google ecosystem, a profile that describes many Indian startups, digital commerce teams, and agencies. For growth teams tracking paid, organic, and website performance, Looker Studio is often the first BI tool they deploy.
10. NVivo
Most data analysis tools on this list handle quantitative data. NVivo addresses the qualitative side: the analysis of interviews, focus group transcripts, open-ended survey responses, social media posts, and documents, including large volumes of unstructured data that lack a predefined format. It is a leading tool for qualitative data analysis in academic research and qualitative market research. In India, NVivo is useful for academic institutions, public health researchers, policy researchers, UX researchers, and qualitative market research teams conducting interviews, focus groups, and ethnographic studies.
| Category | Qualitative Data Analysis Software |
|---|---|
| Best For | Academic research, focus group analysis, ethnographic studies, open-ended text, unstructured data |
| India Pricing | Premium, contact vendor for India pricing |
| Key Strength | Thematic coding, node mapping, and mixed-methods analysis for unstructured and text-heavy data |
NVivo is relevant for Indian market researchers and academic institutions running IDIs, focus groups, and ethnographic studies, particularly in rural and semi-urban contexts where qualitative depth is essential to understanding consumer behaviour. It does not handle quantitative survey data well. For that, tools like QuestionPro or SPSS are more appropriate.
11. Google Analytics 4
Google Analytics 4, or GA4, is the standard tool for digital and web analytics, tracking user behaviour on websites and mobile apps, analysing campaign performance, and understanding conversion funnels. For Indian businesses with a digital presence, GA4 is an essential data program that provides behavioural intelligence that survey data alone cannot deliver. India’s digital economy, spanning e-commerce, fintech, ed-tech, SaaS, D2C, and content platforms, generates large volumes of web and app event data that GA4 is built to process and analyse.
| Category | Digital and Web Analytics |
|---|---|
| Best For | Website behaviour, campaign attribution, app analytics, conversion tracking |
| India Pricing | Free standard version; GA4 360 is enterprise-priced |
| Key Strength | Real-time data event tracking; data integration with Google Ads, Search Console, and BigQuery |
GA4 tells you what users did on your digital properties. It does not tell you why they did it or what they think. Indian organisations that pair GA4 behavioural data with QuestionPro survey data can get a more complete picture of the customer experience than either tool can provide alone.
12. KNIME
KNIME, or Konstanz Information Miner, is an open-source, visual data analytics and workflow platform that allows analysts and data engineers to design data pipelines by dragging and connecting nodes, with little or no coding required. As a leading data science tool, KNIME supports data ingestion, transformation, data integration, data mining, machine learning, and visualization within a single workflow environment.
| Category | Visual Data Workflow and Data Science Tool |
|---|---|
| Best For | Data engineering, ML pipelines, ETL processes, data mining, no-code analytics |
| India Pricing | Free open core; commercial extensions available |
| Key Strength | No-code workflow design for complex data pipelines; strong ML, data integration, and data mining capabilities |
KNIME is particularly useful for data engineering teams who need to build repeatable, documented analytical workflows and automate data mining and integration tasks without writing code. While not as widely known in India as Python or R among individual analysts, it is relevant for IT services, analytics process outsourcing, and enterprise teams where visual, auditable workflow design aligns well with quality and documentation requirements.
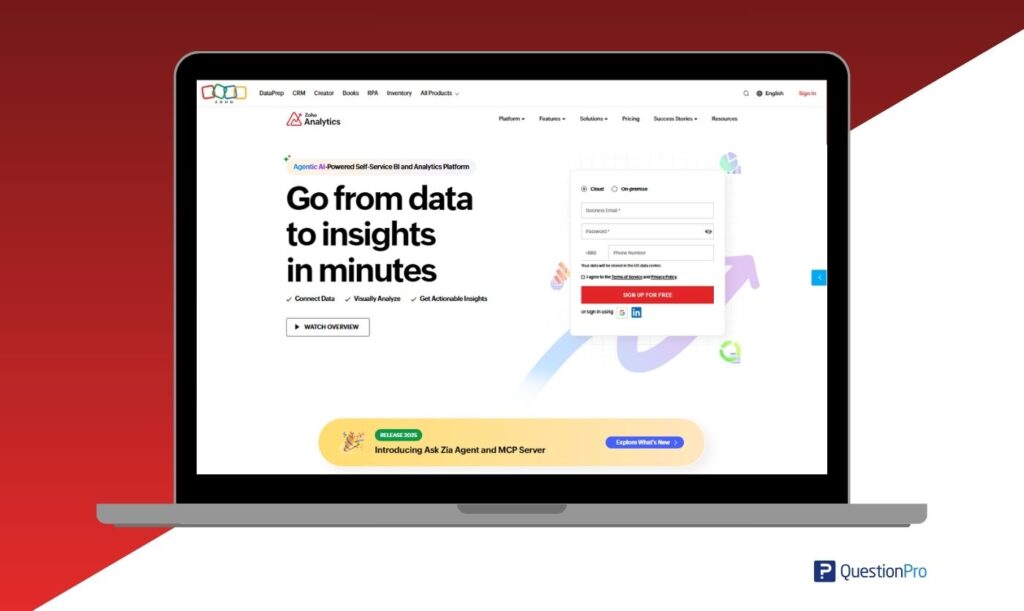
13. Zoho Analytics
Zoho Analytics deserves particular attention in the Indian context. Zoho Corporation is headquartered in Chennai and is one of India’s most successful enterprise software businesses globally. Zoho Analytics is a self-service BI and analytics platform with robust data integration capabilities, supporting connections to many data sources. For Indian SMBs and mid-market companies already operating within the Zoho ecosystem, which includes Zoho CRM, Zoho Books, Zoho Desk, and Zoho Projects, Zoho Analytics provides native integrations that reduce the data plumbing complexity that typically slows BI adoption. Its AI-powered Ask Zia assistant enables natural language queries in English, making analytics accessible to business users without SQL or BI tool training.
| Category | Self-Service BI and Analytics |
|---|---|
| Best For | SMB BI, Zoho ecosystem integration, marketing and sales dashboards, business data analysis |
| India Pricing | Affordable plans available, pricing varies by plan |
| Key Strength | Broad data source integrations; supports data analysts to create interactive dashboards; AI-driven Ask Zia assistant for natural language queries |
For Indian businesses evaluating BI tools, Zoho Analytics is one of the more financially accessible enterprise-grade options available, with local customer support, India-based data centre options to discuss for compliance needs, and a pricing model designed for the budget realities of India’s MSME and mid-market segment. Its competitive positioning against Power BI and Tableau is strongest among organisations that are Zoho-first in their software stack.
Already using a BI tool? See how QuestionPro adds the research layer. Book a 30-minute walkthrough with our India team. We’ll show you how QuestionPro’s survey analytics integrates with Power BI, Tableau, or Salesforce for your specific use case.
Quick Comparison: All 13 Tools at a Glance
| Tool | Type | Best For | India Pricing | Open Source? |
|---|---|---|---|---|
| QuestionPro | Survey and Research Analytics | Survey analysis, market research, CX, EX | Mid-range to enterprise | No, free tier available |
| Microsoft Excel | Spreadsheet / Basic Analytics | Quick analysis, pivot tables, basic charts | Affordable, M365 | No |
| Python | Statistical Programming | ML, advanced modelling, automation | Free | Yes |
| R / RStudio | Statistical Computing | Academic research, statistical modelling | Free | Yes |
| SPSS, IBM | Statistical Analysis | Survey data, social science, BFSI | Premium | No |
| SAS | Enterprise Analytics | Pharma, regulated industries, BFSI | Enterprise | No |
| Tableau | BI and Visualisation | Interactive dashboards, large datasets | Premium | No |
| Microsoft Power BI | BI and Visualisation | Enterprise reporting, Microsoft stack | Affordable for many M365 users | No |
| Google Looker Studio | BI and Visualisation | SMB, marketing dashboards | Free | No |
| NVivo | Qualitative Analysis | Interviews, focus groups, text data | Premium | No |
| Google Analytics 4 | Digital Analytics | Web, app, campaign performance | Free / Premium | No |
| KNIME | Visual Data Workflows | Data engineering, ML pipelines | Free open core | Yes |
| Zoho Analytics | Self-Service BI | SMB BI, broad data source integrations | Affordable | No |
Note: This table compares the top data analysis tools, top data analytics tools, best data analytics tool options, and popular data analysis tools widely used in the industry today. Indian organisations typically use multiple analytics tools to serve different users and use cases, balancing technical requirements, team skills, compliance expectations, and business goals.
Data Analysis Tools in Research: What Academic and Field Researchers in India Need
Research contexts place different demands on analysis tools than corporate analytics environments. Data analysis in research requires reproducibility, methodological rigour, support for both quantitative and qualitative data types, and often compliance with ethics board standards around data privacy and consent. In India, this may also mean navigating institutional review requirements at universities, hospitals, public health bodies, and research organisations, as well as DPDP Act considerations for primary research involving identifiable Indian respondents. Ensuring data quality is essential for trusted results and reliable decision-making in academic studies.
For academic and field researchers in India, the most relevant tools are:
- QuestionPro Research Suite for primary data collection, surveys, CAPI, and online panels with built-in statistical analysis, cross-tabulation, and conjoint/MaxDiff capabilities. Its CAPI capability is particularly valued for fieldwork in rural and semi-urban India, where paper-based data collection is being replaced by tablet-based digital surveys but reliable internet connectivity cannot always be assumed.
- R and RStudio for statistical methods including factor analysis, structural equation modelling, psychometric testing, and multivariate analysis. R is useful for Indian academic research because of its statistical depth and zero cost.
- Jupyter Notebook as a web-based interactive environment that combines live code, visualizations, and text, making it a standard for documenting analysis workflows and supporting reproducible research. It is widely used by data science students and researchers.
- SPSS for researchers who need a point-and-click statistical environment. It is common in Indian university syllabi across social sciences, management, psychology, and commerce programmes.
- NVivo for qualitative researchers conducting thematic analysis of interview transcripts, ethnographic field notes, or open-ended survey responses. It is useful in Indian public health, education, rural development, UX research, and policy research.
QuestionPro’s AI tools for academic research include AI-assisted survey design, synthetic data simulation for pre-testing, and automated insight generation for literature and survey data. For Indian researchers managing large-sample, multilingual studies across geographically dispersed populations, these capabilities address practical fieldwork challenges that standard global research tool documentation may not fully account for.
How to Choose the Right Data Analysis Tool in India
With 13 tools across seven categories, the risk is analysis paralysis. Use these five criteria to narrow your selection:
1. Define Your Data Type First
Quantitative survey data needs different tools from web event streams, financial transaction logs, or interview transcripts. QuestionPro and SPSS are purpose-built for survey data. Python and R handle almost any type. Tableau and Power BI work best with structured numerical data. NVivo is for qualitative text. In India, this distinction is particularly consequential for mixed-methods research teams at FMCG companies and market research agencies who routinely combine large-scale quantitative surveys with qualitative IDIs, requiring different tools for each component of the study design.
2. Match Technical Depth to Your Team
A data analyst comfortable with Python will get more value from it than from a no-code BI tool. Conversely, a marketing team at a mid-sized Indian FMCG brand that needs weekly performance dashboards does not need to learn R. Looker Studio or Power BI will serve them far better. The best tool is the one your team will actually use consistently. India’s analytics talent market spans a wide range, from Python-fluent data science graduates to experienced business analysts at traditional enterprises who may not write code. Tool selection must reflect this reality, not an aspirational capability profile.
3. Consider the Full Analytical Workflow
Most analytical tasks require more than one tool. A typical research workflow at an Indian FMCG company might use QuestionPro to collect data across regional languages, export to SPSS or R for statistical analysis, and feed results into Power BI for executive dashboarding. Choose tools that integrate cleanly rather than creating data silos between departments. India’s large IT services sector has also built mature practices around multi-tool analytics integration, which can serve as a practical reference for corporate teams building their own stacks.
4. Account for India-Specific Requirements
For research across India’s diverse population, multilingual data collection, offline field capabilities, and clear data handling controls are practical requirements, not optional features. QuestionPro’s India-relevant capabilities, such as CAPI mode, regional language support, and local pricing options, address these directly. Additionally, India’s DPDP Act requires organisations to be thoughtful about consent, purpose limitation, and handling of personal data. This affects not just survey platforms but any tool used to store, process, or analyse data containing identifiable information about Indian residents. Tools with clear compliance documentation and suitable data handling options are increasingly preferred in regulated sectors including BFSI, healthcare, and education.
5. Evaluate Total Cost of Ownership
Open-source tools like Python, R, and KNIME are free to license but require skilled technical staff, ongoing maintenance, and often custom development for reporting. Commercial tools like Tableau, SPSS, and SAS have higher licensing costs but reduce development overhead. Survey analytics platforms like QuestionPro sit in the middle, offering a managed environment that eliminates infrastructure complexity for research-focused data analysis. See our analytics vs reporting guide for more on how to think about the trade-offs.
Conclusion
The best tools for analysis of data are not the most expensive or the most feature-rich. They are the ones that match the specific analytical task, the technical capability of your team, and the decision that needs to be made. For most organisations, that means using multiple tools in combination: a survey analytics platform for primary research data, a statistical environment for rigorous modelling, and a BI tool for executive reporting.
For Indian businesses, market research agencies, and academic institutions where primary data from customers, employees, or research respondents is a core input, the tool selection decision carries additional dimensions: linguistic diversity, field research infrastructure for non-metro India, DPDP Act considerations, and cost structures calibrated to Indian market realities. QuestionPro provides a complete analysis environment for this context, from multilingual data collection in the field to AI-powered text analytics, cross-tabulation, and direct integration with Power BI and Tableau. Start with the right data collection and analysis foundation, and every downstream tool in your stack becomes more valuable for uncovering useful insights that support better decisions.
Frequently Asked Questions
Data analysis tools are software platforms, programming languages, and applications used to collect, clean, process, model, and visualize data to extract insights. These include traditional data analysis tools as well as data analytics tools that support the entire analytics workflow, from data collection and processing to visualization and decision-making. Examples include QuestionPro for survey data analysis, Python and R for statistical modeling, Tableau and Power BI for dashboarding, and SPSS and SAS for advanced statistical analysis.
There is no single best data analytics tool in India. The right tool depends on your data type, team capability, budget, and analytical goal. QuestionPro stands out for survey and research-driven analysis, especially when Indian teams need multilingual survey support, CAPI mode, and research analytics. Python and R are strong for statistical modelling and data science. Power BI is a common choice for enterprise dashboarding, while Tableau is preferred when visual storytelling and interactive dashboards are priorities.
For academic and applied research in India, useful data analysis tools include QuestionPro for survey design, data collection, and built-in statistical analysis; R and SPSS for advanced statistical methods; and NVivo for qualitative data. Indian research teams often combine tools because a single study may include survey data, interview transcripts, field notes, and dashboard reporting.
Data programs are software applications designed to process and analyse datasets. This includes data analysis platforms such as Tableau, Power BI, and Looker Studio, data analytics tools like SPSS, SAS, and survey analytics platforms such as QuestionPro, and data science tools including Python, R, and KNIME. The right programme depends on whether your data is quantitative, qualitative, or mixed and the complexity of analysis required.
Yes, Python, R, KNIME, and Google Looker Studio are free and widely used in professional and academic settings. Python and R power sophisticated analytical work globally, including in Indian product companies, research institutions, and analytics teams. The trade-off is that free tools typically require more technical setup, maintenance, and skill investment than commercial platforms.
Excel and Tableau are general-purpose data analysis and visualisation tools. QuestionPro is a specialised data analysis platform purpose-built for research and feedback data. It combines survey design, multi-mode data collection, including offline CAPI for field research in India’s non-metro markets, multilingual support across Indian languages, robust data integration, and built-in statistical analysis in one platform. While Excel requires manual data entry and Tableau requires a data source to connect to, QuestionPro streamlines the workflow from questionnaire design to insight generation. It also integrates with Tableau and Power BI for downstream reporting, making it a complementary addition to your existing analytics stack.