How do you know which workplace initiatives actually move the needle on overall employee satisfaction?
When leaders look at Employee Experience metrics, it is easy to get overwhelmed by hundreds of data points. Knowing that your overall score dropped or increased is helpful, but it doesn’t tell you why—or what specific action will yield the highest return on investment.
This is where driver analysis in employee experience transforms raw survey feedback into actionable strategy. By calculating the direct correlations between key workplace variables, driver analysis pinpoints the exact experiences—from onboarding on day one to manager support—that govern your broader engagement metrics.
In this blog, we will break down what driver analysis is, how it works inside QuestionPro Employee Experience, and how HR leaders can leverage it to target high-impact areas across their organization.
What Is Driver Analysis in Employee Experience?
Driver analysis is an advanced analytical feature within Employee Experience Software that identifies the statistical correlation between specific workforce variables.
Instead of treating every survey question with equal weight, driver analysis highlights which individual factors—such as team onboarding, clear communication, or leadership accessibility—have the strongest influence on overarching business outcomes like eNPS or overall engagement.
With QuestionPro’s survey software, organizations can easily map complex survey structures (including high-level Markers down to specific Question Building Blocks) against core key performance indicators.
How Does Driver Analysis Work in QuestionPro Employee Experience?
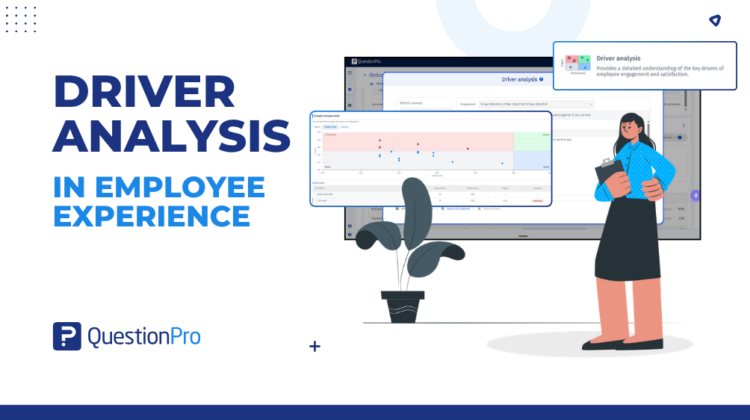
Inside QuestionPro’s Employee Experience dashboard, the Driver Analysis widget simplifies high-level statistical correlation into an intuitive visual hierarchy.
+———————————————————————–+
| DRIVER ANALYSIS WIDGET |
+————————–+——————————————–+
| Survey Structure | Driver Variable (e.g., “Day One Onboarding”)|
+————————–+——————————————–+
| ├─ Marker: Integration | [Score: 0.85] ◄– Strongest Correlation |
| │└─ Building Block | [Score: 0.76] |
| │└─ Specific Question| [Score: 0.66] ◄– Root Cause Identified |
+————————–+——————————————–+
- Markers: The highest-level operational categories evaluated in your study.
- Building Blocks: Sub-categories that break down broader operational concepts into detailed focus areas.
- Specific Questions: The exact matrix question items answered by employees.
By reading across the correlation scores, EX teams can trace a macro-level problem all the way down to a specific, actionable question item.
Real-World Example: Uncovering Root Causes in Onboarding
To understand the practical impact, consider an enterprise onboarding study analyzing employee sentiment during their “Day One” experience compared to their “First 100 Days.”
Phase 1: Identifying the Day One Friction
When running a driver analysis on early-tenure feedback, a company discovers that under the Day One driver, the highest correlation score (0.85) points to the First 100 Days marker.
Expanding the metric reveals:
- Building Block: Integration (Score: 0.76)
- Root Question: “People went out of their way to make me feel part of the team.” (Score: 0.66)
The high negative agreement score highlights a clear issue: new hires did not feel welcomed by their immediate teams on day one.
Phase 2: The Compound Effect on 100-Day Retention
If leadership ignores this initial day-one finding, the long-term impact becomes clear when analyzing the First 100 Days driver survey sent to the same cohort later.
Under the 100-day driver:
- Marker: Engagement (Score: 0.85)
- Building Block: Sentiment (Score: 0.77)
- Root Question: “I am satisfied with the onboarding process.” (Score: 0.73)
The Insight: The driver analysis proves that initial feelings of isolation on Day One directly corrupt overall onboarding satisfaction at Day 100. By fixing immediate team-level welcome protocols, the organization can systematically protect 100-day engagement levels.
How Can You Use Driver Analysis to Boost eNPS?
Employee Net Promoter Score (eNPS) is one of the most critical metrics monitored by executive leadership. Running a driver analysis against your eNPS data allows you to see which underlying culture or leadership items drive advocacy.
To configure eNPS driver analysis:
- Open your EX Dashboard and select Add Widget > Driver Analysis.
- Under Outcome, select the eNPS question.
- Then, under Drivers, select all matrix survey questions.
Example Finding:
An analysis reveals that eNPS correlates most strongly with the Familiarity building block, specifically tied to the item “Our CEO knows who I am.” This insight reveals that executive visibility and personal connection—rather than compensation or perks—are the primary levers driving employee advocacy in that workplace.
How Do You Set Up the Driver Analysis Widget in QuestionPro?
Setting up driver analysis inside QuestionPro Employee Experience takes only a few simple steps:
- Navigate to Analytics Portal > Dashboard within your EX study.
- Click Add Widget and choose the Driver Analysis.
- Name your widget and select the target survey and active deployments.
- Select your targeted Outcome.
- Choose your drivers under the Drivers section.
- Click Create to generate real-time correlation reports accessible in PDF or Excel formats.
Turn Employee Insights into Strategic Action
Stop guessing which workplace initiatives matter most. By leveraging driver analysis in employee experience, HR and EX professionals can move past basic descriptive statistics and uncover the true root causes behind retention, satisfaction, and eNPS.
Ready to see how data-driven correlation tools can transform your workplace strategy? Explore QuestionPro’s full suite of enterprise Employee Experience Software today.