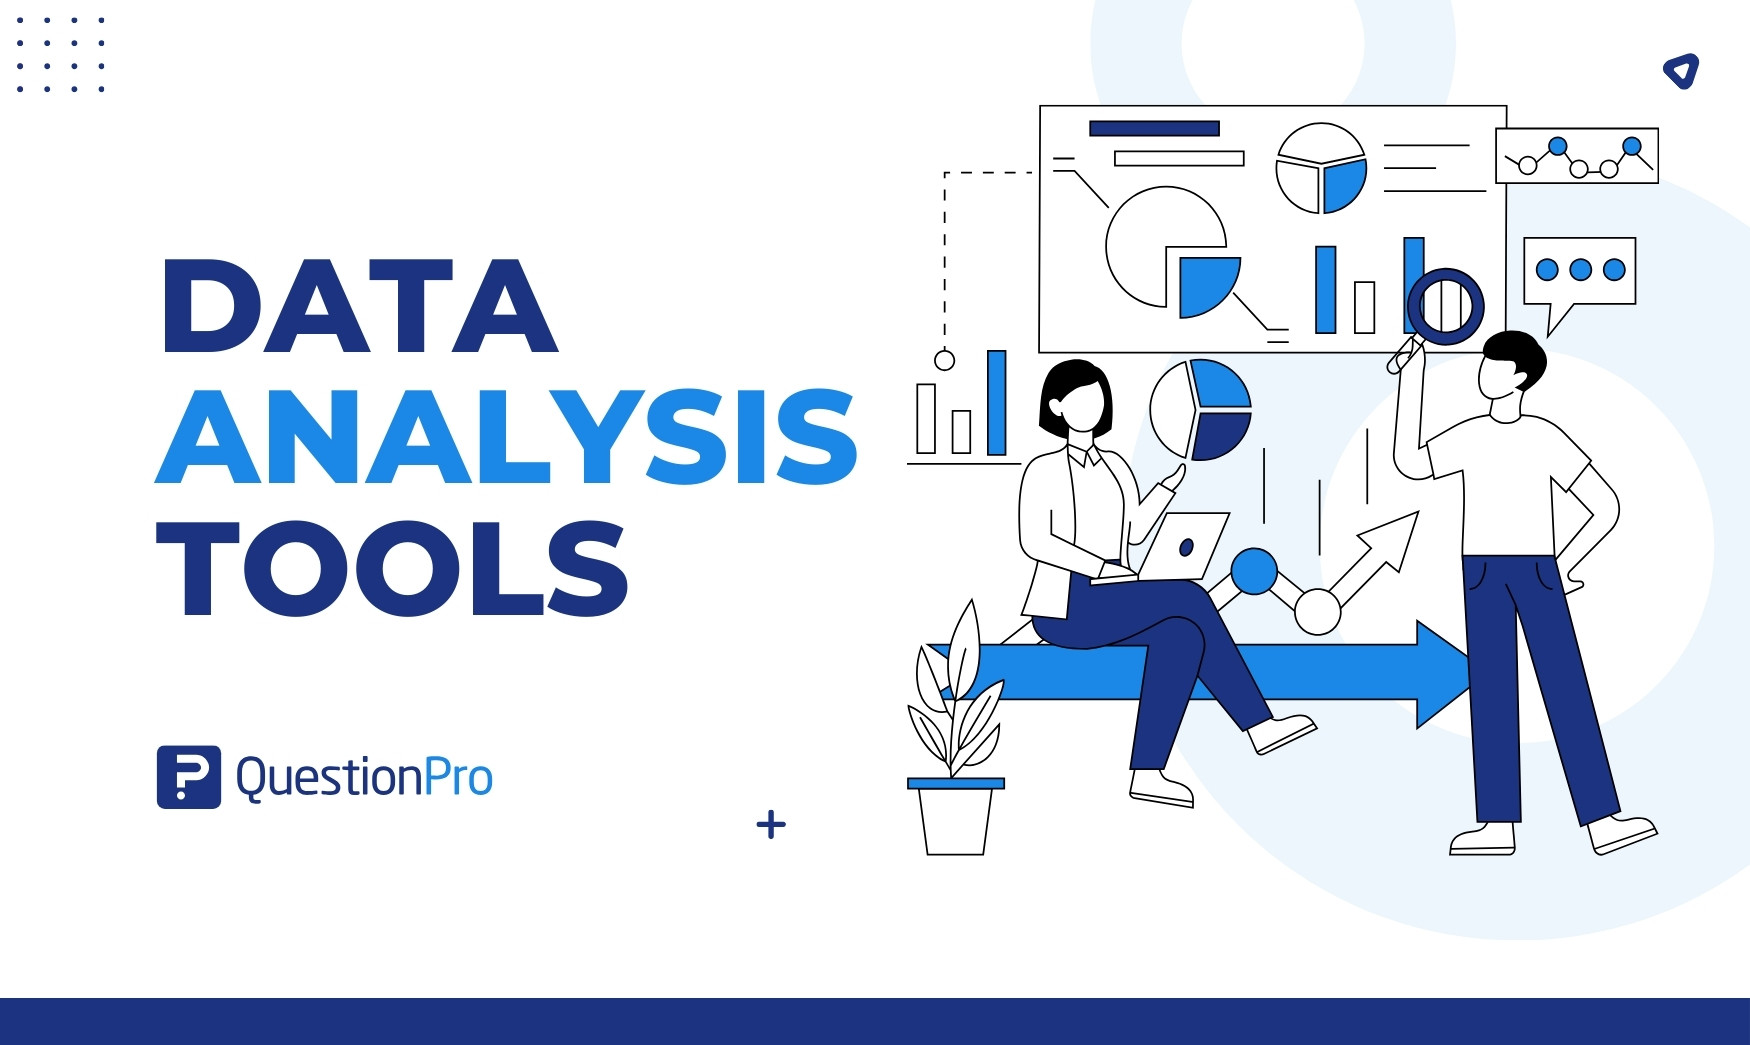
Data analysis tools are software and programming languages that clean, explore, model, and visualize data so teams can turn raw numbers into decisions. The right one depends on your data, your skills, and your budget, not on a single “best” name.
This guide compares 15 widely used options, from spreadsheets and BI platforms to open-source languages and survey analysis software. In this article, we’ll cover what each tool does well, where it falls short, what it costs, and how to pick one.
What are data analysis tools?
Data analysis tools are applications and languages that help people collect, organize, explore, and interpret data to answer a specific question. They sit at the center of data analysis, the process of inspecting data to find patterns, test ideas, and support decisions. Data analysis in research follows the same logic, whether the data comes from surveys, sales systems, or sensors.
Most tools cover one or more of these jobs:
- Cleaning and preparing messy data
- Running statistical tests and models
- Querying large databases
- Building charts and dashboards
- Sharing results with non-technical stakeholders
Why do data analysis tools matter for businesses?
Data analysis tools matter because they shorten the path from a question to a trusted answer. Teams that skip them rely on gut feel and manual spreadsheets, which slow decisions and hide errors.
The labor market reflects this demand. The U.S. Bureau of Labor Statistics projects 35% employment growth for data scientists from 2025 to 2035, far faster than average, with a median pay of $120,230 as of May 2025. Tool skills also show up in developer habits. In the 2025 Stack Overflow Developer Survey, 58.6% of respondents used SQL and 57.9% used Python, and Python usage rose 7 percentage points in a year.
- Better decisions: Dashboards and statistical tests replace opinion with evidence.
- Faster operations: Automated reports remove hours of manual copy and paste.
- Customer insight: Survey and behavior data show what customers want and why they leave.
- Risk control: Trend and anomaly checks flag problems before they grow.
How are data analysis tools different from BI tools and analytics platforms?
These terms overlap, and people use them loosely. A data analysis tool is the broad category, and the others are subsets or neighbors.
| Term | What it means | Typical example |
|---|---|---|
| Data analysis tool | Any software or language used to analyze data | Excel, Python, SPSS |
| Business intelligence (BI) tool | Software that turns data into dashboards and scheduled reports for business users | Power BI, Tableau |
| Data analytics platform | A larger stack that adds storage, pipelines and governance | Cloud warehouse plus BI |
| Survey analysis software | Tools built to analyze questionnaire responses, including open-ended answers | QuestionPro |
| Statistical software | Packages built for hypothesis tests and modeling | SPSS, SAS, R |
If you mainly need dashboards for executives, start with the BI category, and see our guide to reporting tools for that need. If you need to prove a hypothesis, start with statistical software.
What types of data analysis software are there?
Data analysis software falls into seven practical types. Each answers a different kind of question, and most teams combine two or three.
- Spreadsheets such as Excel handle small to mid-size ad hoc analysis.
- BI and visualization tools such as Power BI and Tableau build dashboards.
- Programming languages such as Python and R handle custom analysis and machine learning.
- Query languages such as SQL pull data out of databases.
- Statistical packages such as SPSS and SAS run validated tests.
- Survey and research tools analyze questionnaire and open-ended data.
- Web analytics tools such as Google Analytics 4 track website and app behavior.
For research-heavy work, see our list of qualitative data analysis software, which covers tools for interviews and open-ended responses.
Comparison of the 15 best data analysis tools
This table gives a quick view of how the 15 tools compare. Pricing reflects public vendor pages checked in October 2026, and several vendors only publish quotes.
| Tool | Type | Best for | Coding needed | Starting cost |
|---|---|---|---|---|
| QuestionPro | Survey analysis and BI | Survey and research data | No | Free plan; paid from $83 to $99 per user per month |
| Microsoft Excel | Spreadsheet | Quick, ad hoc analysis | No | Included in Microsoft 365 plans |
| Power BI | BI | Microsoft-centered teams | Low | Free Desktop; Pro $14 per user per month |
| Tableau | BI | Visual exploration | Low | Standard $15 per user per month |
| Looker Studio | BI reporting | Free Google-connected reports | No | Free |
| Qlik Sense | BI | Associative exploration | Low | Quote-based |
| Python | Language | Custom analysis, machine learning | Yes | Free |
| R | Language | Statistics and research | Yes | Free |
| SQL | Query language | Database extraction | Yes | Free in open-source databases |
| Jupyter Notebook | Notebook | Reproducible analysis | Yes | Free |
| IBM SPSS Statistics | Statistical package | Menu-driven statistics | No | Subscription |
| SAS | Statistical platform | Regulated, enterprise analytics | Some | Quote-based |
| KNIME | Visual workflow | No-code data pipelines | No | Free open-source platform |
| Google Analytics 4 | Web analytics | Website and app behavior | No | Free standard version |
| Looker | Enterprise BI | Governed metrics | Yes (LookML) | Quote-based |
What are the 15 best data analysis tools in 2026?
The 15 tools below cover every major category. Each entry names who it suits, what it does well, where it struggles, and what it costs, so you can shortlist without opening 15 vendor sites.
1. QuestionPro
QuestionPro is a survey and research platform with built-in analysis, so it fits teams whose data starts as questionnaire responses. It handles survey design, collection, cross-tabulation, open-text analysis, and dashboards in one place. A later section explains when this type of tool beats a general one.
- Best for: Customer, employee, and market research data.
- Strengths: Analysis sits next to collection, and QuestionPro BI builds dashboards from survey data without a separate BI license.
- Limits: It is not built for warehouse-scale, non-survey data such as server logs.
- Pricing: A free Essentials plan covers one user and 200 responses per survey. Advanced is $99 per user per month, and Team Edition is $83 per user per month, both billed annually, per the QuestionPro pricing page.
2. Microsoft Excel
Microsoft Excel is the spreadsheet most analysts learn first. It handles pivot tables, formulas, basic charts, and quick models, and it needs no setup.
- Best for: Small datasets and one-off analysis.
- Strengths: Familiar, flexible, and available almost everywhere.
- Limits: Large files slow it down, and manual formulas invite silent errors.
- Pricing: Included with Microsoft 365 subscriptions.
3. Microsoft Power BI
Power BI turns data from many sources into interactive dashboards. It is a common choice for organizations already using Microsoft products.
- Best for: Business dashboards and self-service reporting.
- Strengths: Tight Excel and Azure integration, plus a free desktop authoring tool.
- Limits: Sharing requires a paid license, and complex data models take real skill.
- Pricing: Pro is $14 per user per month, and Premium Per User is $24, both billed yearly, according to Microsoft’s Power BI pricing.
4. Tableau
Tableau is a visual analytics tool known for drag-and-drop exploration. Analysts use it to find patterns by dragging fields onto a canvas instead of writing code.
- Best for: Visual storytelling and exploratory analysis.
- Strengths: Strong chart variety and a large user community.
- Limits: Costs rise quickly at scale, and data prep is weaker than in code-first tools.
- Pricing: Standard starts at $15 per user per month and Enterprise at $35, billed annually, per Tableau’s pricing page. License-level rates need a sales quote.
5. Looker Studio
Looker Studio, formerly Google Data Studio, is a free reporting tool that connects to Google products and many other sources. It suits marketers and small teams that want shareable reports fast.
- Best for: Free, lightweight dashboards.
- Strengths: No license cost and easy sharing.
- Limits: Heavy calculations and large datasets can feel slow.
- Pricing: Free, with a paid Pro tier for team features. See Looker Studio for current terms.
6. Qlik Sense
Qlik Sense is a BI platform built around an associative engine. Instead of following fixed drill paths, users click any value and see related and unrelated data highlighted at once.
- Best for: Exploring unfamiliar data without a preset question.
- Strengths: Flexible discovery and strong governance options.
- Limits: The learning curve is steeper than for simpler BI tools.
- Pricing: Tiered cloud plans and quotes. Check Qlik pricing for current figures.
7. Python
Python is a general-purpose programming language with analysis libraries such as pandas and NumPy. It scales from a small script to machine learning pipelines.
- Best for: Custom analysis, automation, and predictive models.
- Strengths: Free, flexible, and backed by a huge community.
- Limits: It requires coding skills, and sharing results with non-coders takes extra work.
- Pricing: Free under an open-source license from the Python Software Foundation.
8. R
R is a free language built for statistics and graphics. Academics and researchers favor it for its depth of statistical methods and publication-quality plots.
- Best for: Statistical modeling and research.
- Strengths: Thousands of specialized packages.
- Limits: The syntax feels unusual to newcomers, and it is slower than Python for general engineering tasks.
- Pricing: Free from the R Project.
9. SQL
SQL, or Structured Query Language, is the standard language for pulling and shaping data in relational databases. Almost every analyst uses it, even when another tool builds the final chart.
- Best for: Extracting and joining data from databases.
- Strengths: Fast on large tables and portable across systems.
- Limits: It queries data but does not visualize or model it by itself.
- Pricing: The language is free, and open-source databases such as PostgreSQL cost nothing to run.
10. Jupyter Notebook
Jupyter Notebook is an interactive document that mixes code, results, and notes. It lets analysts show their work step by step, which makes analysis easier to review and repeat.
- Best for: Reproducible analysis and teaching.
- Strengths: Supports Python, R, and other languages in one format.
- Limits: Notebooks can become messy, and version control is harder than with plain scripts.
- Pricing: Free and open source through Project Jupyter.
11. IBM SPSS Statistics
IBM SPSS Statistics is a statistical package with a menu-driven interface. Researchers run t-tests, regressions, and factor analysis without writing code.
- Best for: Academic and market research statistics.
- Strengths: Easy for non-programmers and widely trusted in research.
- Limits: Licensing is costly, and it is less flexible than coded workflows.
- Pricing: Sold by subscription. Check IBM SPSS Statistics for current tiers.
12. SAS
SAS is an enterprise analytics platform with a long record in regulated industries. Banks, insurers, and health organizations use it where validated, auditable results matter.
- Best for: Regulated and enterprise analytics.
- Strengths: Reliability, governance, and strong vendor support.
- Limits: Cost and a closed ecosystem.
- Pricing: Quote-based through SAS.
13. KNIME
KNIME is an open-source platform where users build analysis as a visual workflow. They connect blocks for loading, cleaning, modeling, and exporting data instead of writing code.
- Best for: No-code data pipelines and automation.
- Strengths: Free core platform with many connectors.
- Limits: Large workflows get hard to read.
- Pricing: The Analytics Platform is free and open source, per KNIME. Paid plans exist for team features.
14. Google Analytics 4
Google Analytics 4 tracks how people use websites and apps. It answers questions about traffic sources, conversions, and user paths.
- Best for: Digital marketing and product behavior.
- Strengths: Free standard version and deep integration with Google advertising.
- Limits: It covers digital behavior only, and sampling can affect large reports.
- Pricing: Free standard version, with a paid 360 tier. See Google Analytics.
15. Looker
Looker is an enterprise BI platform from Google Cloud built on a governed modeling layer called LookML. Data teams define each metric once, so every dashboard uses the same numbers.
- Best for: Consistent metrics across large organizations.
- Strengths: Strong governance and embedded analytics.
- Limits: It needs developers to maintain the model.
- Pricing: Annual commitments and quotes, with separate Developer, Standard, and Viewer user licenses, per Google Cloud’s Looker pricing.
When does survey analysis software beat general data analysis tools?
Survey analysis software wins when your data comes from questionnaires, because it understands response structure. General tools treat survey data as plain rows and columns, so you rebuild skip logic, weights, and open-text coding yourself.
Purpose-built tools save time in four places:
- Open-ended answers: Text analysis groups comments into topics and sentiment instead of leaving them unread.
- Segmentation: Cross-tabs compare groups, such as new and returning customers, in a few clicks.
- Data quality: Checks can flag bots, speeders, and gibberish before they distort results.
- Linked data: Analysis stays tied to the questions, so labels do not get lost in exports.
Platforms like QuestionPro combine these features with survey software for collection, and they also export data to Excel, SPSS, R, or Python when you need deeper modeling. Our roundup of survey analysis software compares more options for this job.
How is AI changing data analysis tools?
AI is changing data analysis tools by letting people ask questions in plain language and get charts, summaries, or code back. Most major vendors now offer a natural-language assistant.
- Natural-language queries: Users type a question, and the tool builds the chart.
- Automated summaries: The tool writes a short narrative of key findings.
- Anomaly detection: Models flag unusual movements without a manual search.
- Code assistance: Assistants draft SQL or Python that analysts then review.
AI output still needs a human check. A generated chart can use the wrong filter or the wrong definition, so confirm the logic and test results against a known number before sharing. Ask vendors whether your data trains their models and where it is stored.
What are the four types of data analysis and which tools fit each?
The four types of data analysis are descriptive, diagnostic, predictive and prescriptive, and each answers a different question. Knowing which one you need narrows the tool list quickly.
| Type | Question it answers | Tools that fit |
|---|---|---|
| Descriptive | What happened? | Excel, Power BI, Looker Studio |
| Diagnostic | Why did it happen? | Tableau, SQL, survey cross-tabs |
| Predictive | What is likely to happen? | Python, R, SAS, KNIME |
| Prescriptive | What should we do about it? | Python, SAS, scenario models in BI tools |
Most business teams spend their time on the first two types. Predictive and prescriptive work usually needs coding or statistical skills, so plan for training or a specialist hire before you buy.
What are the pros and cons of open-source and commercial data analysis tools?
Open-source tools cost less to start, and commercial tools cost less to support. Neither group is better in general, so weigh each against your team’s skills and risk tolerance.
Open-source tools such as Python, R, and KNIME
- Pros: No license fee, flexible, and a large community that writes free packages and tutorials.
- Cons: No guaranteed support, more setup, and results depend on the skill of whoever writes the code.
Commercial tools such as Tableau, Power BI, and SAS
- Pros: Vendor support, polished interfaces, built-in security controls, and faster onboarding for non-coders.
- Cons: Recurring license costs, vendor lock-in, and features that sit behind higher tiers.
Many teams mix both. An analyst might clean data in Python and publish the result in Power BI.
Step-by-step guide to choosing a data analysis tool
Choose a data analysis tool by starting with the question you need answered, not with the feature list. These six steps keep the decision grounded.
- Write the question.
Name the decision the analysis will support and who will read the result.
- Identify the data.
Note its source, size, and format, such as survey responses, database tables, or web traffic.
- Match the skills.
List who will use the tool and whether they code. A team of non-coders points to BI or no-code tools. The role overview in our guide on what a data analyst does helps map skills to tools.
- Check the fit.
Confirm the tool connects to your current systems and meets your security rules.
- Price the full cost.
Add licenses, training, setup, and maintenance, not just the monthly fee.
- Run a pilot.
Test two or three finalists on a real project for two to four weeks.
Which data analysis tool fits which situation?
The best match depends on your starting point. This table shows common situations and a sensible first choice, including free data analysis tools and options for beginners.
| Your situation | Good first choice | Why |
|---|---|---|
| Complete beginner, small data | Excel | No setup and easy to learn |
| Need free dashboards | Looker Studio or Power BI Desktop | No license cost to start |
| Analyzing survey responses | QuestionPro | Analysis tied to the questionnaire |
| Statistics without coding | SPSS or KNIME | Menus and visual workflows |
| Custom models and automation | Python or R | Full flexibility |
| Governed metrics for many teams | Looker | One shared metric layer |
| Website and app behavior | Google Analytics 4 | Built for digital tracking |
What do data analysis tools look like in practice?
Real teams rarely use one tool. These illustrative scenarios show how tools combine, and they describe typical setups rather than named customers.
Retail sales reporting
A regional retailer keeps weekly sales in a database. Analysts use SQL to pull the data, Excel for quick checks, and Power BI to publish store-level dashboards. Managers open the dashboard each Monday instead of waiting for an emailed spreadsheet.
- Question: Which stores miss weekly targets?
- Tools: SQL, Excel, Power BI
How do you measure whether a data analysis tool is working?
You measure a data analysis tool by tracking whether it speeds up decisions, gets used and stays accurate. Vague goals such as “better insights” cannot be checked, so set numbers before launch.
| Metric | How to calculate | Example starting target |
|---|---|---|
| Time to insight | Hours from a question to a shared answer | Down 25% within one quarter |
| Adoption rate | Weekly active users divided by licensed users | 60% or higher after 90 days |
| Data freshness | Delay between a source update and the dashboard update | Matches the decision cycle, such as daily |
| Rework rate | Reports corrected after publishing, divided by total reports | Under 5% |
| Cost per active user | Annual cost divided by weekly active users | Falls at each renewal |
These targets are starting points, not industry benchmarks. Set your own baseline in the first month and compare against it.
What mistakes should you avoid when choosing data analysis tools?
The most common mistake is buying for features instead of for the people who will use the tool. Avoid these patterns.
- Chasing the shiniest option: A team of spreadsheet users rarely adopts a coding tool, however powerful it is.
- Ignoring total cost: Training and maintenance can exceed the license fee.
- Skipping the pilot: A demo uses clean data, and your data will not be clean.
- Creating data silos: Separate tools per team produce conflicting numbers.
- Trusting unreviewed AI output: Always verify generated charts and code.
- Forgetting governance: Decide who can see sensitive data before rollout.
Final thoughts on choosing data analysis tools
The best data analysis tools are the ones your team will actually use on real questions. A free spreadsheet used well beats an expensive platform nobody opens.
Keep these three points in mind:
- Start with the question and the data, then pick the tool.
- Combine tools when needed, such as SQL for extraction and BI for sharing.
- Measure adoption and accuracy, then adjust at renewal.
Frequently Asked Questions (FAQs)
Excel is the easiest starting point because most people already know its basics. Power BI Desktop is a strong next step for dashboards, since authoring is free. Move to SQL or Python only when spreadsheets stop handling your data.
Learn Python first if you want general-purpose skills across analysis, automation, and machine learning. Choose R first if your work is mainly statistics or academic research. Both are free, and many analysts end up using each for different jobs.
Python, R, KNIME, and Jupyter Notebook are fully free and open source. Looker Studio and Power BI Desktop are free for building reports. The trade-off is time: free tools often need more setup and skill than paid platforms.
No. AI assistants can draft queries, explain results, and suggest charts, but they still need a tool to store, process, and govern data. Treat them as helpers, and verify every number against the source before acting on it.
Often yes. Healthcare teams must consider HIPAA, and finance teams face audit and retention rules. Ask vendors about data location, access controls, and certifications before you load sensitive data into any cloud-based analysis tool.