



Customer retention metrics are the numbers that tell you whether customers are sticking around or quietly heading for the exit. Keeping an existing customer almost always costs less than winning a new one. Even a small improvement in retention can move profits far more than most acquisition campaigns.
Most teams track one or two of these numbers and stop there. That leaves gaps. A healthy retention rate can hide a shrinking revenue base, and a strong NPS can mask slow support response times that are quietly pushing customers away.
This guide breaks down the 10 metrics worth tracking. It covers how to calculate each one and how to decide which ones matter most for your business model.
What are customer retention metrics?
Customer retention metrics are quantitative measures that show how well a business keeps its existing customers over a given period. They also reveal how those customers behave, spend, and feel along the way.
They fall into three broad groups:
- Behavioral metrics track what customers actually do, like renewing, repurchasing, or canceling
- Financial metrics track what that behavior is worth, like lifetime value or revenue churn
- Sentiment metrics track how customers feel, like satisfaction and likelihood to recommend
No single metric tells the whole story. A business that only watches churn rate knows how many customers left, but not why, or whether the ones who stayed are actually happy.
Customer retention rate vs. Customer loyalty vs. Customer churn
These three terms get used interchangeably, but they measure different things. Mixing them up leads to the wrong metric driving the wrong decision.
| Term | What it actually measures | How it is tracked |
|---|---|---|
| Customer retention rate | The percentage of customers a business keeps over a set period | Formula based on customers at the start and end of a period |
| Customer loyalty | The emotional commitment a customer has to a brand, beyond just staying subscribed | Surveys, repeat behavior over time, advocacy |
| Customer churn | The percentage of customers who leave or cancel within a set period | The inverse relationship to retention rate |
A customer can be retained without being loyal. Someone might stay because switching is inconvenient, not because they love the brand. Loyalty digs into the “why” behind the numbers that retention and churn only report on the surface. If loyalty programs are part of your strategy, it is worth reading up on customer loyalty software as well.
How to measure customer retention: A step-by-step process
Measuring retention correctly takes more than picking a formula. Here is the process that keeps the numbers accurate and useful.
- Define what success looks like for your business, whether that is a target retention rate, a lower churn rate, or a higher repeat purchase rate.
- Choose two or three metrics from the list below that fit your business model, instead of trying to track all ten at once.
- Pull clean data from your CRM (the system that stores customer records), your billing system, or existing customer retention strategies already in place, since inconsistent data produces misleading numbers.
- Set a benchmark using your own historical performance or the industry ranges further down this guide.
- Review the numbers on a fixed schedule, weekly for fast-moving subscription businesses, monthly or quarterly for longer sales cycles.
- Act on what the data shows, whether that means fixing a slow onboarding flow or reworking a loyalty program.
10 Customer retention metrics to track in 2026
Each of these metrics answers a different question about how customers behave and feel. Use the formulas below to calculate them, and the notes on when each one matters most.
01. Customer retention rate (CRR)
Customer retention rate measures the percentage of customers a business keeps over a specific period. It removes new customers from the count first.

- Formula: ((Customers at end of period − New customers acquired) ÷ Customers at start of period) x 100
- Best for: any recurring-revenue or subscription business tracking overall health
A rising CRR usually signals that onboarding, support, and product value are working together. A falling one is often the earliest warning sign of a bigger churn problem.
02. Customer churn rate
Customer churn rate is the mirror image of retention. It shows the percentage of customers who canceled, stopped buying, or left within a given period.

- Formula: (Customers lost during period ÷ Customers at start of period) x 100
- Best for: subscription businesses and any company tracking cancellations
Churn rate alone will not tell you why customers left. Pair it with exit surveys or support tickets to find the actual cause.
Churn Rate = ( Lost CustomersTotal/Customers at Start ) x 100
03. Net Promoter Score (NPS)
Net Promoter Score measures how likely customers are to recommend a business to someone else. It is based on a single 0 to 10 scale question.
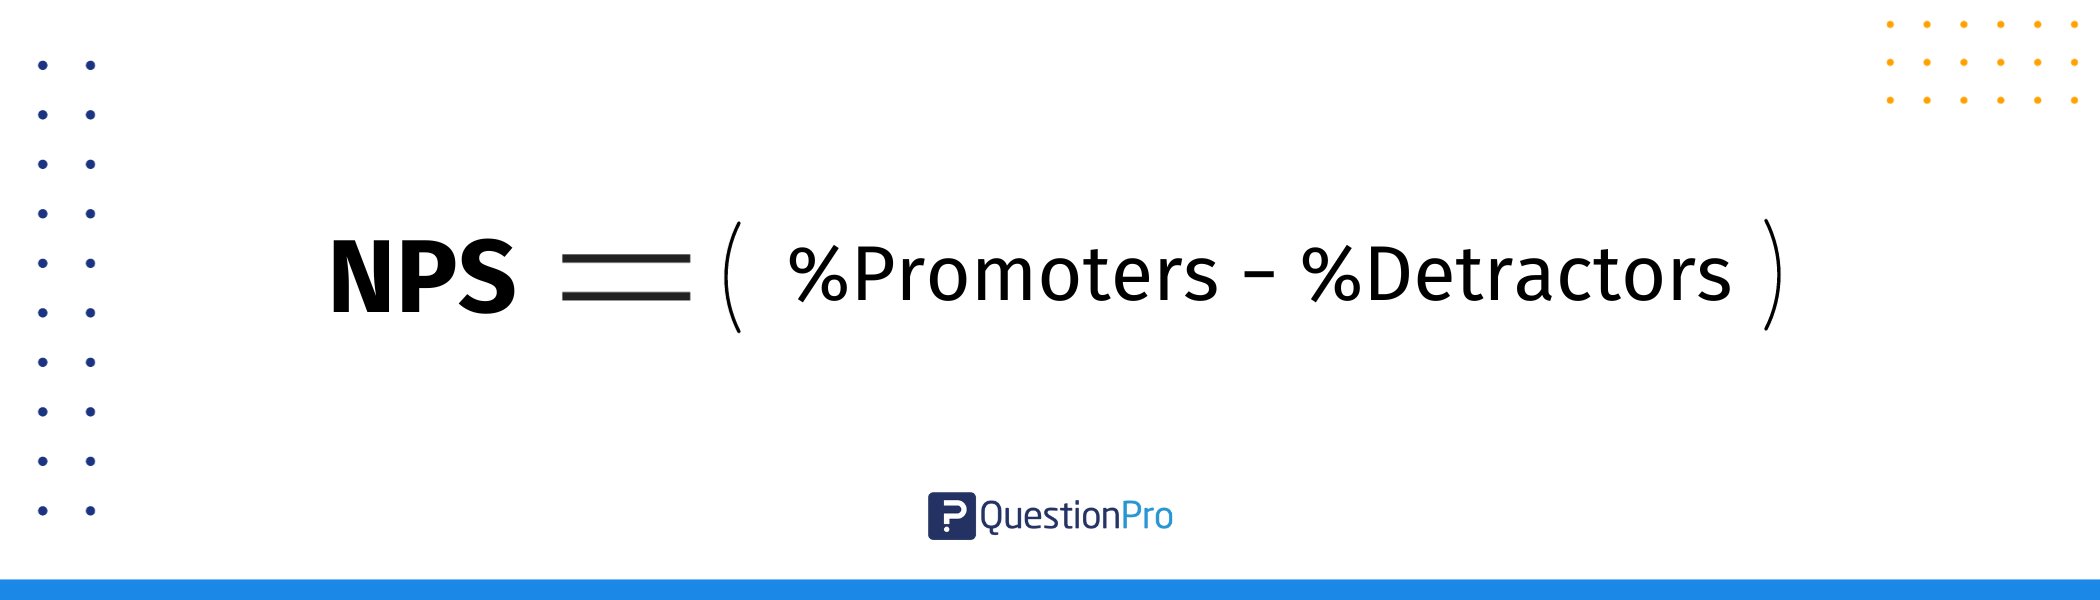
- Formula: % Promoters (score 9 to 10) minus % Detractors (score 0 to 6)
- Best for: gauging overall sentiment and advocacy potential
A high Net Promoter Score correlates with lower churn risk. Customers who would recommend a brand are less likely to abandon it for a competitor.
04. Customer Satisfaction Score (CSAT)
CSAT measures how satisfied a customer was with a specific interaction, purchase, or support experience. It is usually collected on a 1 to 5 scale.
- Formula: (Number of satisfied responses ÷ Total responses) x 100
- Best for: measuring satisfaction right after a support ticket, delivery, or onboarding step
CSAT is more tactical than NPS. It flags problems at a specific touchpoint. Running customer satisfaction surveys right after that touchpoint keeps the data accurate, instead of relying on memory weeks later.
05. Customer Effort Score (CES)
Customer Effort Score measures how much effort a customer had to put in to get an issue resolved or a task completed. It is typically scored on a 1 to 7 scale.
- Formula: Average of effort ratings collected after a support interaction
- Best for: identifying friction in support and self-service experiences
Research consistently shows that reducing customer effort predicts loyalty better than simply trying to delight customers.
06. Customer Lifetime Value (CLV)
Customer Lifetime Value estimates the total revenue a business can expect from a customer over the entire relationship.
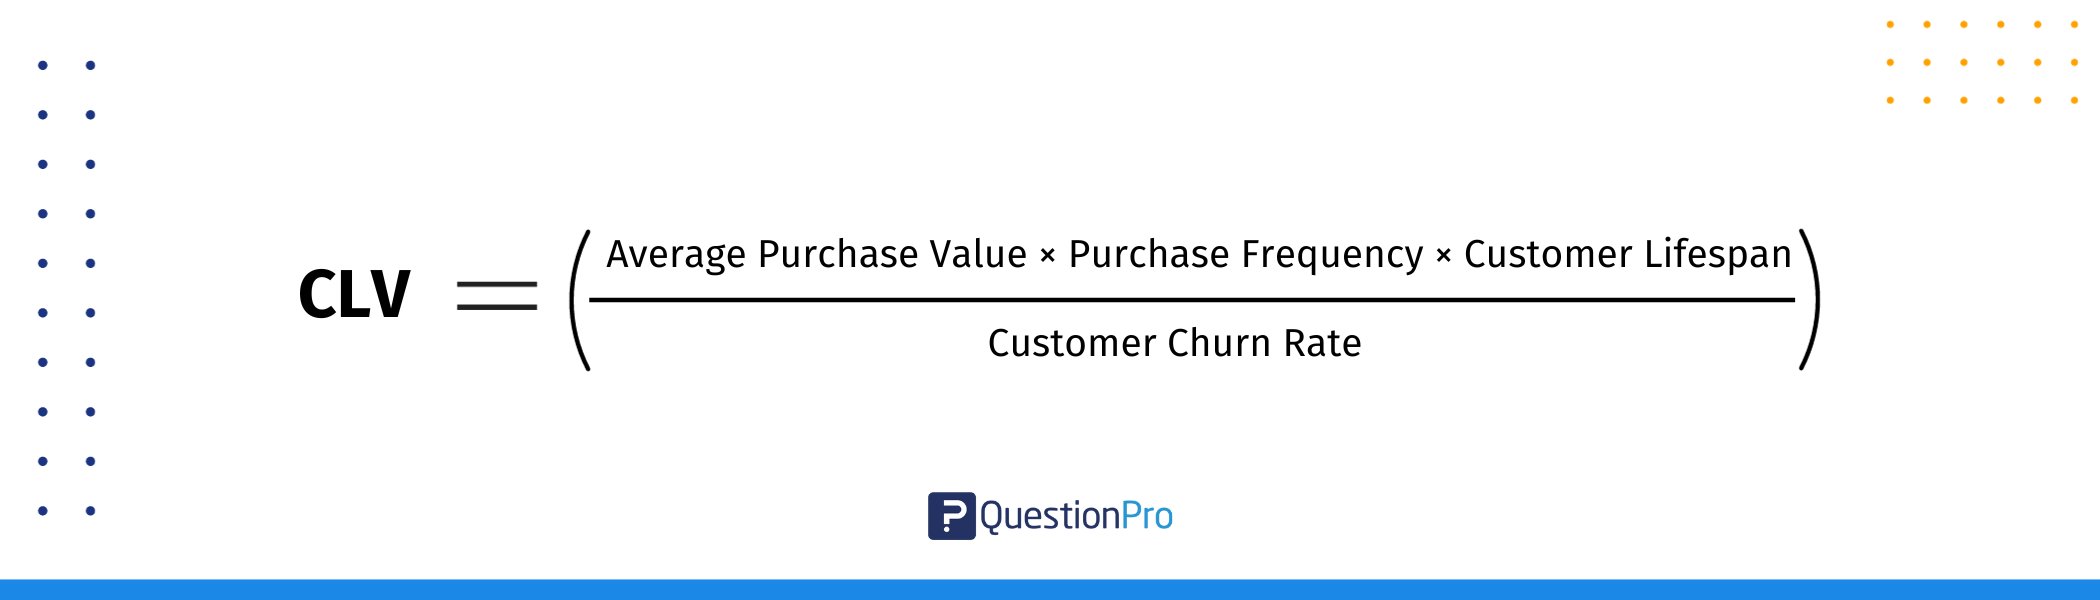
- Formula: Average purchase value x Purchase frequency x Customer lifespan
- Best for: deciding how much to spend on acquisition and retention for different customer segments
CLV turns retention from an abstract goal into a dollar figure. That makes it easier to justify budget for support, loyalty programs, or QuestionPro Customer Experience initiatives.
07. Repeat purchase rate
Repeat purchase rate shows the percentage of customers who buy more than once within a given period. For subscription businesses, the closest equivalent is renewal rate.
- Formula: (Customers with more than one purchase ÷ Total customers) x 100
- Best for: ecommerce and product-based businesses where subscription metrics do not apply directly
A customer who buys again without a discount or reminder is telling you something a survey cannot. That behavior is one of the clearest loyalty signals available.
08. Revenue churn and net revenue retention
Revenue churn measures the recurring revenue lost from downgrades, cancellations, or reduced spending. Net revenue retention flips that view, showing whether existing customers are spending more or less over time.
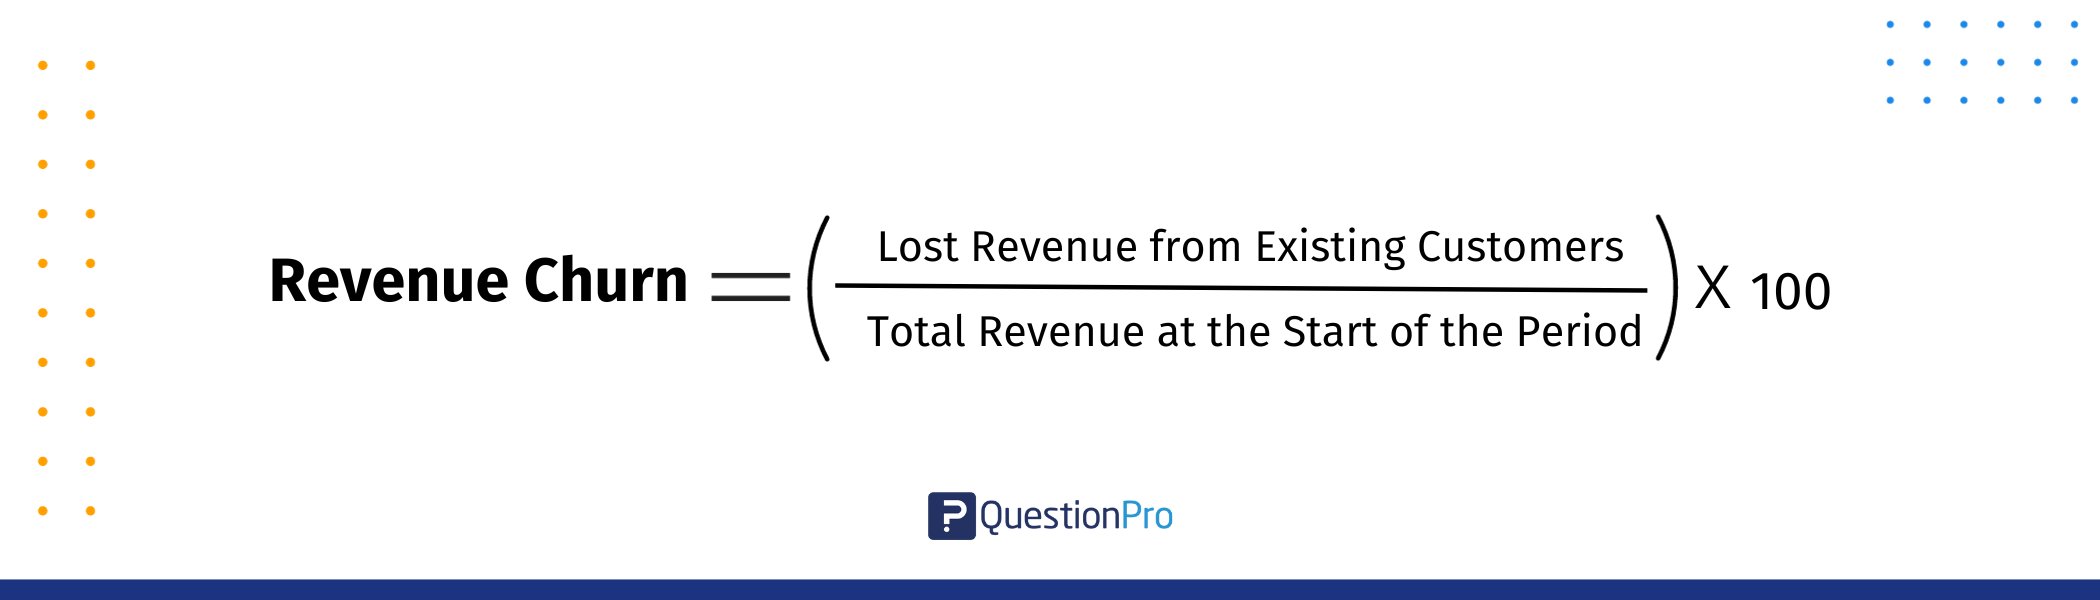
- Formula: (Lost revenue from existing customers ÷ Total revenue at start of period) x 100
- Best for: SaaS (subscription software) and other subscription businesses where account expansion and downgrades both matter
A company can lose customers and still grow revenue if the remaining accounts are expanding fast enough. That is what net revenue retention captures and customer count alone cannot.
09. Customer referral rate
Customer referral rate measures the percentage of new customers who came from an existing customer’s recommendation, rather than paid acquisition.
- Formula: (New customers from referrals ÷ Total new customers) x 100
- Best for: businesses with an active referral or advocacy program
Referred customers typically cost far less to acquire. They also tend to stay longer, since they arrive already trusting the brand through a friend’s experience.
10. Average resolution time
Average resolution time tracks how long it takes a support team to fully resolve a customer’s issue. It runs from first contact to close.
- Formula: Total resolution time across tickets ÷ Number of tickets resolved
- Best for: any business with a support or service function, especially ones with high ticket volume
Slow resolution times are one of the most common, and most fixable, causes of silent churn. Customers rarely complain twice before they simply leave.
How to choose the right retention metrics for your business model
Tracking all 10 metrics at once usually creates noise instead of insight. The right set depends on how your business makes money.
- Subscription and SaaS businesses: Prioritize customer retention rate, revenue churn, and net revenue retention, since a single lost account can represent years of recurring revenue
- Ecommerce and product businesses: Lean on repeat purchase rate, CLV, and referral rate, since there is no subscription to renew or cancel
- Service and support-heavy businesses: Weight CSAT, CES, and average resolution time more heavily, since experience quality drives most of the churn risk.
Whatever the business model, pair one behavioral metric, one financial metric, and one sentiment metric together. That combination catches problems a single metric would miss on its own.
Customer retention benchmarks and real-world examples
Benchmarks vary widely by industry, so treat these as reference points rather than universal targets. Media and subscription businesses often retain more than 80% of customers annually. Ecommerce retailers, by contrast, frequently see annual churn well above 60%, since one-time and seasonal purchases are harder to convert into repeat behavior.
The financial upside of even a small improvement is well documented. Bain & Company’s research, later popularized through a 2014 Harvard Business Review article, found that a 5% increase in customer retention can increase profits by 25% to 95%, depending on the industry.
In practice, this shows up in specific behaviors. A streaming subscription business tracks monthly churn and net revenue retention, because a single canceled plan is immediately lost recurring revenue. An online retailer instead watches repeat purchase rate and CLV, since a customer might buy quarterly rather than monthly. That makes churn rate a less useful signal on its own for that business.
Common mistakes when tracking customer retention metrics
Even well-intentioned retention programs go wrong in predictable ways. Watch for these patterns before they distort your strategy.
- Tracking too many metrics at once, which dilutes focus and makes it hard to tell which number actually drives decisions
- Measuring retention rate without segmenting by customer cohort, which hides the fact that new customers often churn faster than long-tenured ones
- Ignoring sentiment metrics like NPS or CSAT because they feel harder to quantify than revenue-based numbers
- Treating a single bad month as a trend, instead of watching metrics over multiple periods before reacting
- Collecting feedback but never closing the loop with customers, a gap that strong voice of the customer programs are built to fix, since it erodes trust in future surveys and lowers response rates
QuestionPro’s approach to tracking retention metrics
QuestionPro Customer Experience gives teams a way to collect the sentiment side of retention in one place. That covers:
- NPS, CSAT, and CES surveys, alongside behavioral data pulled from a CRM or billing system
- Surveys that trigger automatically after a support ticket closes, a renewal date passes, or a purchase completes
- Retention dashboards that combine that feedback with churn and CLV data to flag at-risk accounts before they cancel
Triggering surveys at the moment an event happens keeps sentiment data accurate, rather than relying on a delayed quarterly check-in. For teams building out a full customer journey mapping practice, connecting retention metrics to specific journey stages, like onboarding, renewal, and support, makes it easier to see exactly where customers start disengaging.
Retention metrics work best as a system, not a scorecard
No single number on this list will save a struggling retention strategy on its own. The businesses that improve retention year over year connect a behavioral metric, a financial metric, and a sentiment metric. Then they act on what the combination reveals.
Start with two or three metrics that match your business model:
- Set a realistic benchmark using your own history
- Review the numbers on a fixed schedule
- Act on what changes, instead of just logging it
The goal is not a perfect dashboard. It is catching the customers who are quietly disengaging before they become a churn statistic.
Frequently Asked Questions (FAQs)
It depends heavily on industry. Subscription and media businesses often see 80% or higher annually, while ecommerce retailers frequently fall between 30% and 40%. Compare your rate against your own historical baseline first, since industry averages vary widely by business model and customer type.
Fast-moving subscription businesses benefit from reviewing churn and retention weekly or monthly, since small shifts compound quickly. Businesses with longer sales cycles, like B2B services, can review quarterly without missing early warning signs in most cases.
Net revenue retention tends to matter most, since it captures both lost accounts and expansion revenue from existing customers in one number. A subscription business can lose customers and still grow if expansion outpaces the losses.
Yes, when combined. A drop in NPS or CES, paired with slower repeat purchases or longer resolution times, often shows up weeks before a customer formally cancels or stops buying. That gap gives teams a window to intervene.
Largely yes. B2B (business-to-business) companies rely more on net revenue retention and account-level churn, since a single account often represents significant recurring revenue. B2C (business-to-consumer) companies lean more on repeat purchase rate, CLV, and referral rate at an individual customer level.



