How to use customer journey analytics is really about learning to see your business the way customers experience it, step by step, across time and channels. Customer journey analytics is the process of tracking and analyzing sequences of customer interactions to understand behavior patterns, friction points, and outcomes. Unlike single metrics or isolated dashboards, it focuses on how actions connect.
In the USA, where customers switch devices, channels, and expectations quickly, journey-level insights often explain what conversion rates or NPS scores alone cannot.
What is customer journey analytics?
Customer journey analytics analyzes the full path a customer takes, not just individual touchpoints. A touchpoint is any interaction between a customer and a company, such as a website visit, checkout, support chat, or survey response.
The key difference from traditional analytics is sequence. Journey analytics looks at order, timing, and repetition. It answers questions like what usually happens before churn, or which paths lead to long-term retention.
Also check: What customer journey phases are, top 5 + tips
How customer journey analytics works
Customer journey analytics works by connecting data from different systems into a unified timeline for each customer. These systems often include web analytics, CRM tools, product usage logs, customer support platforms, and survey data.
Once data is connected, teams analyze common paths and variations. This is sometimes called an analytics journey because the analysis itself follows the customer’s progression. Patterns matter more than single events. For example, a support ticket followed by delayed onboarding often predicts churn better than either signal alone.
How many customer journeys should you track
A common mistake is trying to track everything at once. The better question is how many customer journeys should you track to drive decisions.
For most US-based companies, three to five core journeys are enough. These usually include acquisition, onboarding, retention, support resolution, and expansion. Each journey should have a clear business outcome and owner.
If a journey does not connect to a decision, it does not need deep analysis yet.
Also learn: What is customer journey monitoring, tools, and its importance
How to use customer journey analytics: Step-by-step guide
Customer journey analytics helps you understand how people move across touchpoints, what they experience at each step, and where friction appears. When used correctly, it connects behavior and feedback into a single view of the real customer experience, not assumptions or averages.
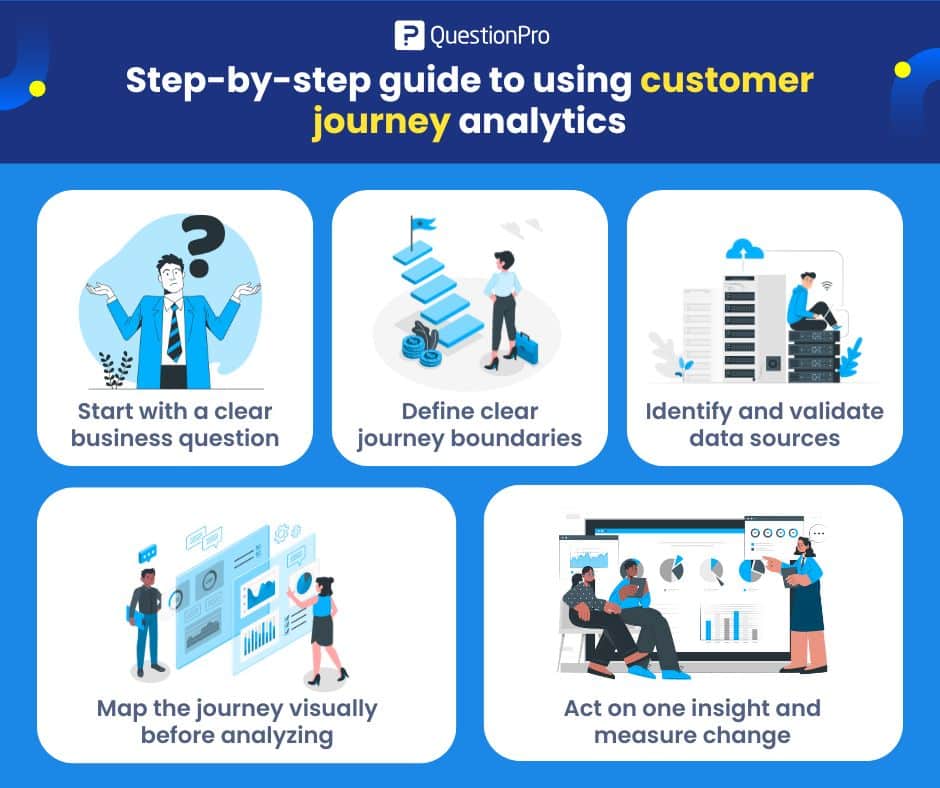
Step 1: Start with a clear business question
Always begin with a decision you want to improve. Do not start with tools, platforms, or dashboards. Journey analytics only works when it answers a specific question tied to outcomes.
Examples of strong business questions:
- Why do new customers churn within the first 90 days?
- Where do trial users fail to reach activation?
- Which steps slow down onboarding for US customers?
A focused question prevents over-analysis and keeps insights actionable.
Step 2: Define clear journey boundaries
Next, decide exactly where the journey starts and ends. This step creates structure and avoids mixing unrelated behaviors.
Define boundaries such as:
- Start: first website visit, signup, purchase, or demo request
- End: activation, first value moment, renewal, or cancellation
When journeys are vague, results are vague. Clear boundaries make comparisons meaningful and patterns easier to trust.
Step 3: Identify and validate data sources
List all data sources involved in the journey and confirm they can be connected at the customer level. This is where many analyses fail quietly.
Common data sources include:
- Web or app analytics
- CRM records
- Product usage events
- Support tickets
- Transactional surveys
Identity resolution is critical. If events cannot be reliably tied to the same customer or account, conclusions will be weak and often misleading.
Step 4: Map the journey visually before analyzing
Create a visual map of the journey before running advanced analysis. Even a simple flow diagram can reveal issues that raw data hides.
A visual map helps you spot:
- Drop-offs between steps
- Repeated loops that signal confusion
- Long delays between key actions
After mapping, analyze patterns across groups, not individuals. Segment by behavior, lifecycle stage, or customer type to find consistent signals.
Step 5: Act on one insight and measure change
Choose one insight that clearly connects back to your original business question and take action. Avoid trying to fix everything at once.
Examples of actions:
- Simplify a step with high abandonment
- Change messaging at a confusing moment
- Adjust the timing of emails or in-app prompts
Then measure the impact. Look for changes in completion rates, time to value, or satisfaction. Customer journey analytics only delivers value when it changes decisions or behavior, and those changes are tracked over time.
Examples of customer journey analytics
One common example is analyzing trial users who convert versus those who do not. Businesses often find that successful converters follow fewer steps, contact support earlier, or complete onboarding faster.
Another example comes from retail, where customers who browse on mobile but purchase on desktop follow different paths than desktop-only shoppers. Understanding these paths helps improve handoff points between devices.
Healthcare and financial services in the USA also use journey analytics to reduce repeated calls and compliance friction, where small delays have an outsized impact.
Pros and cons of customer journey analytics
The main benefit is context. Journey analytics shows cause-and-effect more clearly than isolated metrics. It also helps teams align around shared evidence instead of assumptions.
The downside is complexity. Data integration takes time, and poorly defined journeys can produce misleading results. Without clear goals, teams risk building dashboards that look sophisticated but do not drive decisions.
Where do surveys fit into customer journey analytics
Behavioral data shows what customers do. Surveys explain why they do it. Combining both creates stronger insight.
Placing short surveys at critical moments, such as after onboarding or support resolution, helps validate assumptions from behavioral data. This combination is central to customer journey analytics because it links actions to intent and emotion.
How QuestionPro supports customer journey analytics
QuestionPro supports customer journey analytics by connecting behavioral data with structured customer feedback at key touchpoints. You can trigger surveys based on events like signups, purchases, support closures, or renewals, then analyze responses alongside journey steps. This makes it easier to understand not just where friction occurs, but what customers say caused it.
Because surveys, dashboards, and segmentation live in one system, you can avoid stitching together spreadsheets or switching tools. US-based companies often use this setup to track onboarding journeys, support resolution paths, and signal churn risk without over-engineering the process.
Frequently Asked Questions (FAQs)
Answer: You need event data tied to identifiable customers across channels, plus timestamps. Common sources include web analytics, CRM, support systems, and surveys.
Answer: No. Funnel analysis looks at stages. Journey analytics looks at paths, including loops, delays, and alternative routes between stages.
Answer: Core journeys should be reviewed quarterly. Major changes in product, pricing, or policy should trigger earlier reviews.
Answer: Inconsistent customer identifiers and missing timestamps cause the biggest problems. Without reliable sequencing, insights break down.
Answer: The biggest issues are inconsistent customer identifiers, missing timestamps, and disconnected systems. Without reliable sequencing, journey insights become unreliable.
Answer: Costs vary based on data volume, integration needs, and tooling. For many mid-sized US companies, the main investment is data integration time rather than software licenses.