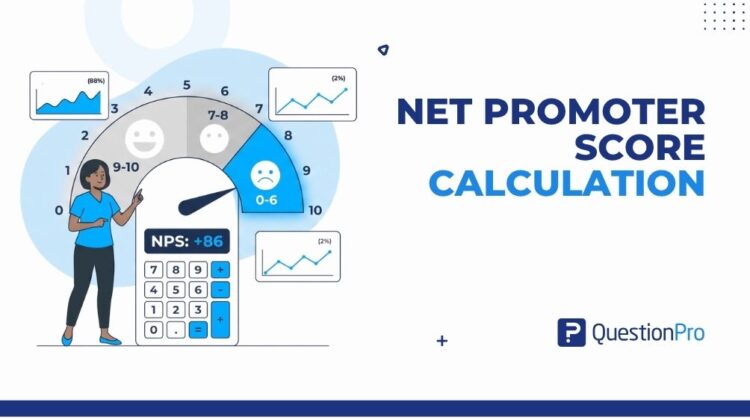
A net promoter score calculator turns raw survey responses into one number that tells you how loyal your customers really are. It sorts every response into a promoter, passive, or detractor bucket, then applies a simple formula to produce your score.
You do not need special software to do this by hand. But once your response volume grows past a few hundred, a calculator saves time and cuts down on manual errors.
This guide breaks down the NPS formula, walks through a full worked example, and shows how to segment your score by region, store, or team so the number actually points you toward action.
What is a Net Promoter Score calculator?
A Net Promoter Score calculator is a tool that converts customer responses to the standard NPS question into a single loyalty score between -100 and 100.
The underlying question is always the same: “On a scale of 0 to 10, how likely are you to recommend our product or service to a friend or colleague?” Every response gets grouped into one of three categories based on the number chosen, and the calculator does the subtraction for you.
Net Promoter Score, or NPS, is a customer loyalty metric. It measures whether someone likes your brand enough to actively recommend it, which makes it different from a satisfaction score that only captures how someone feels about a single interaction.
What is the Net Promoter Score formula?
The NPS formula is: NPS = % of Promoters minus % of Detractors.
Passives are counted in your total number of respondents but are left out of the subtraction itself. Here is how each group is defined based on their answer to the 0-10 question.
| Score given | Category | What it means |
|---|---|---|
| 9-10 | Promoters | Loyal customers likely to recommend you and repurchase |
| 7-8 | Passives | Satisfied but unenthusiastic, open to switching to a competitor |
| 0-6 | Detractors | Unhappy customers who may discourage others from buying |
Because the formula only nets out two of the three groups, your final score can land anywhere from -100 (every respondent is a detractor) to 100 (every respondent is a promoter).
How to calculate NPS: Step-by-step
Calculating NPS by hand takes five steps once your responses are collected.
- Collect responses to the 0-10 recommendation question through an NPS survey.
- Sort every response into promoters (9-10), passives (7-8), or detractors (0-6).
- Divide the number of promoters by the total number of respondents, then multiply by 100 to get a percentage. Do the same for detractors.
- Subtract the detractor percentage from the promoter percentage.
- Round the result to a whole number. NPS is always reported as an integer, never as a percentage or a decimal.
Passives still count toward your total respondent pool in step 3, even though they drop out of the final subtraction in step 4.
Net Promoter Score calculation example
Say your company surveys 5,000 customers in North America about their likelihood to recommend your product.
Out of those 5,000 responses, 100 fall in the 0-6 detractor range, 500 fall in the 7-8 passive range, and 4,400 fall in the 9-10 promoter range.
First, calculate each percentage. Promoters are 4,400 divided by 5,000, or 88%. Detractors are 100 divided by 5,000, or 2%.
Now apply the formula: 88% minus 2% equals an NPS of 86. That is an exceptionally strong score, and it shows the North America segment is heavily weighted toward loyal, vocal advocates.
Compare that to a second region. Suppose the same company surveys 1,000 customers in Latin America and receives 400 detractor responses, 100 passive responses, and 500 promoter responses.
Promoters are 500 divided by 1,000, or 50%. Detractors are 400 divided by 1,000, or 40%. The NPS here is 50% minus 40%, which equals 10.
A score of 10 is still positive, but it signals a much weaker relationship with customers than the North America segment. The gap between the two regions is the real insight, not either number in isolation.
How to segment NPS by region or store
A single company-wide NPS hides where the actual problems are. Breaking the score down by region, store, or team turns one number into a diagnostic tool.
Take a retailer running the same NPS survey across six regions in North America. The results might look like this.
| Region | NPS |
|---|---|
| Region 1 | 80 |
| Region 2 | 90 |
| Region 3 | 90 |
| Region 4 | 80 |
| Region 5 | 90 |
| Region 6 | 60 |
Five of the six regions post strong scores, but Region 6 lags noticeably behind. That gap is where a customer experience team should focus its next round of interviews or process reviews.
The same logic applies at the store level. If Store 3 scores 60 while four comparable stores score between 80 and 90, the difference usually points to something specific, like staffing, wait times, or product availability, rather than a company-wide issue.
What is a good Net Promoter Score?
A good Net Promoter Score is generally anything above 30, with scores above 50 considered excellent and scores above 70 considered world-class.
Context still matters more than the raw number. Industry averages vary widely, with sectors like hotel and hospitality and banking posting averages in the low 40s while insurance and airlines often land in the low to mid 20s, according to QuestionPro’s NPS benchmark research. Comparing your score against your own industry average is more useful than comparing it to a universal target.
Bain & Company, the firm that created the Net Promoter System, notes that sustained value creators tend to carry Net Promoter Scores well above the average company in their sector. That reinforces why tracking your score over time, and against direct competitors, tells you more than any single benchmark chart.
Common mistakes to avoid when calculating NPS
A few recurring errors quietly distort NPS results and lead teams to misread what their score is telling them.
- Reporting NPS as a percentage or with a decimal point instead of a whole number.
- Averaging the raw 0-10 scores instead of applying the promoter-minus-detractor formula.
- Ignoring passives entirely instead of watching whether they drift toward promoter or detractor territory over time.
- Collecting too few responses to be statistically meaningful, especially when segmenting by store or region.
- Comparing your score against a generic benchmark instead of your specific industry.
- Never following up with detractors, which wastes the most actionable feedback in the dataset.
Fixing these issues does more for the accuracy of your program than any calculator can on its own.
How QuestionPro helps you calculate and track NPS
Manual calculation works fine for a few hundred responses, but it becomes impractical once volume grows into the thousands or you need to track scores across multiple regions over time.
QuestionPro Customer Experience automates the calculation, segments results by region, store, or customer group, and displays trends on a live dashboard so teams can see how the score moves after each change they make. Features like automated detractor alerts also help teams respond to negative feedback before it turns into churn. Teams that want a deeper look at scoring logic and use cases can also read this complete guide to Net Promoter Score.
Turning your score into action
A calculated NPS is only the starting point. The real value comes from what happens after the number appears on the dashboard.
Reach out to detractors and passives directly, ask what fell short, and close the loop by fixing what you can. Then run the survey again and compare the new score against your historical baseline to see whether those changes actually moved the needle. Checking your result against a detailed NPS benchmark breakdown can also help you set a realistic next target instead of guessing.
Frequently Asked Questions (FAQs)
Not always. Some industries, like airlines or internet providers, tend to run lower NPS averages across the board. A negative score is a warning sign, but always compare it against your own industry benchmark before assuming your program has failed.
Yes, but the score becomes less reliable as the sample size shrinks. Small samples can swing dramatically with just a few responses, so treat scores with fewer than 100 respondents as directional rather than final.
Most CX teams run NPS surveys quarterly for a broad pulse check, plus transactional NPS surveys after key moments like a purchase or support ticket. This combination tracks both overall loyalty and specific touchpoints.
No, the formula stays the same regardless of response rate. A higher response rate simply makes the resulting score more statistically reliable and less vulnerable to swings from a handful of outlier answers.
NPS measures loyalty and willingness to recommend, while a customer satisfaction score measures how someone felt about one specific interaction. Companies often track both, since a customer can be satisfied with one visit but still unlikely to recommend the brand overall.