The hospitality sector has experienced profound changes in recent years. In an industry defined by rising competition and evolving guest demands, delivering exceptional customer experiences has become the paramount factor for success across all facets of hotel operations.
Net Promoter Score (NPS) remains the standard methodology for gauging performance in this critical area. Analyzing NPS in Hospitality & Hotels offers invaluable insights into guest loyalty, satisfaction levels, and the overall strength of the relationship between hotels and their patrons.
Our comprehensive Q1 2025 study, surveying 1,000 participants involved in travel and accommodation decisions, examined NPS performance across seven key industries. The findings reveal that Hospitality & Hotels stands out as a leader in fostering customer loyalty.
What is NPS? How is NPS Calculated?
Net Promoter Score (NPS) is a simple but powerful tool that measures customer loyalty. Think of it as a direct line to understanding customer satisfaction and predicting future growth because happy customers become your best advocates.
Calculating your NPS depends on real customers’ voices. It answers one critical question:
“On a scale of 0–10, how likely are you to recommend [COMPANY] to a friend or colleague?”
Depending on their answers, guests are placed into three categories:
- Promoters (9–10): They stayed great and were eager to tell others.
- Passives (7–8): They’re content but not enthusiastic enough to recommend.
- Detractors (0–6): They didn’t have the experience they expected and might speak negatively.
NPS Formula: % of Promoters – % of Detractors = NPS Score
Example: If 70% are Promoters and 15% are Detractors, your NPS is 55 (70 – 15).
Your final NPS ranges from -100 (worst) to +100 (best). A positive score is good; a score of +50 or higher is excellent, meaning your guests aren’t just satisfied; they’re loyal fans.
You can use our NPS calculator to calculate your company’s NPS automatically.
What’s a Good NPS Score for Hospitality & Hotels?
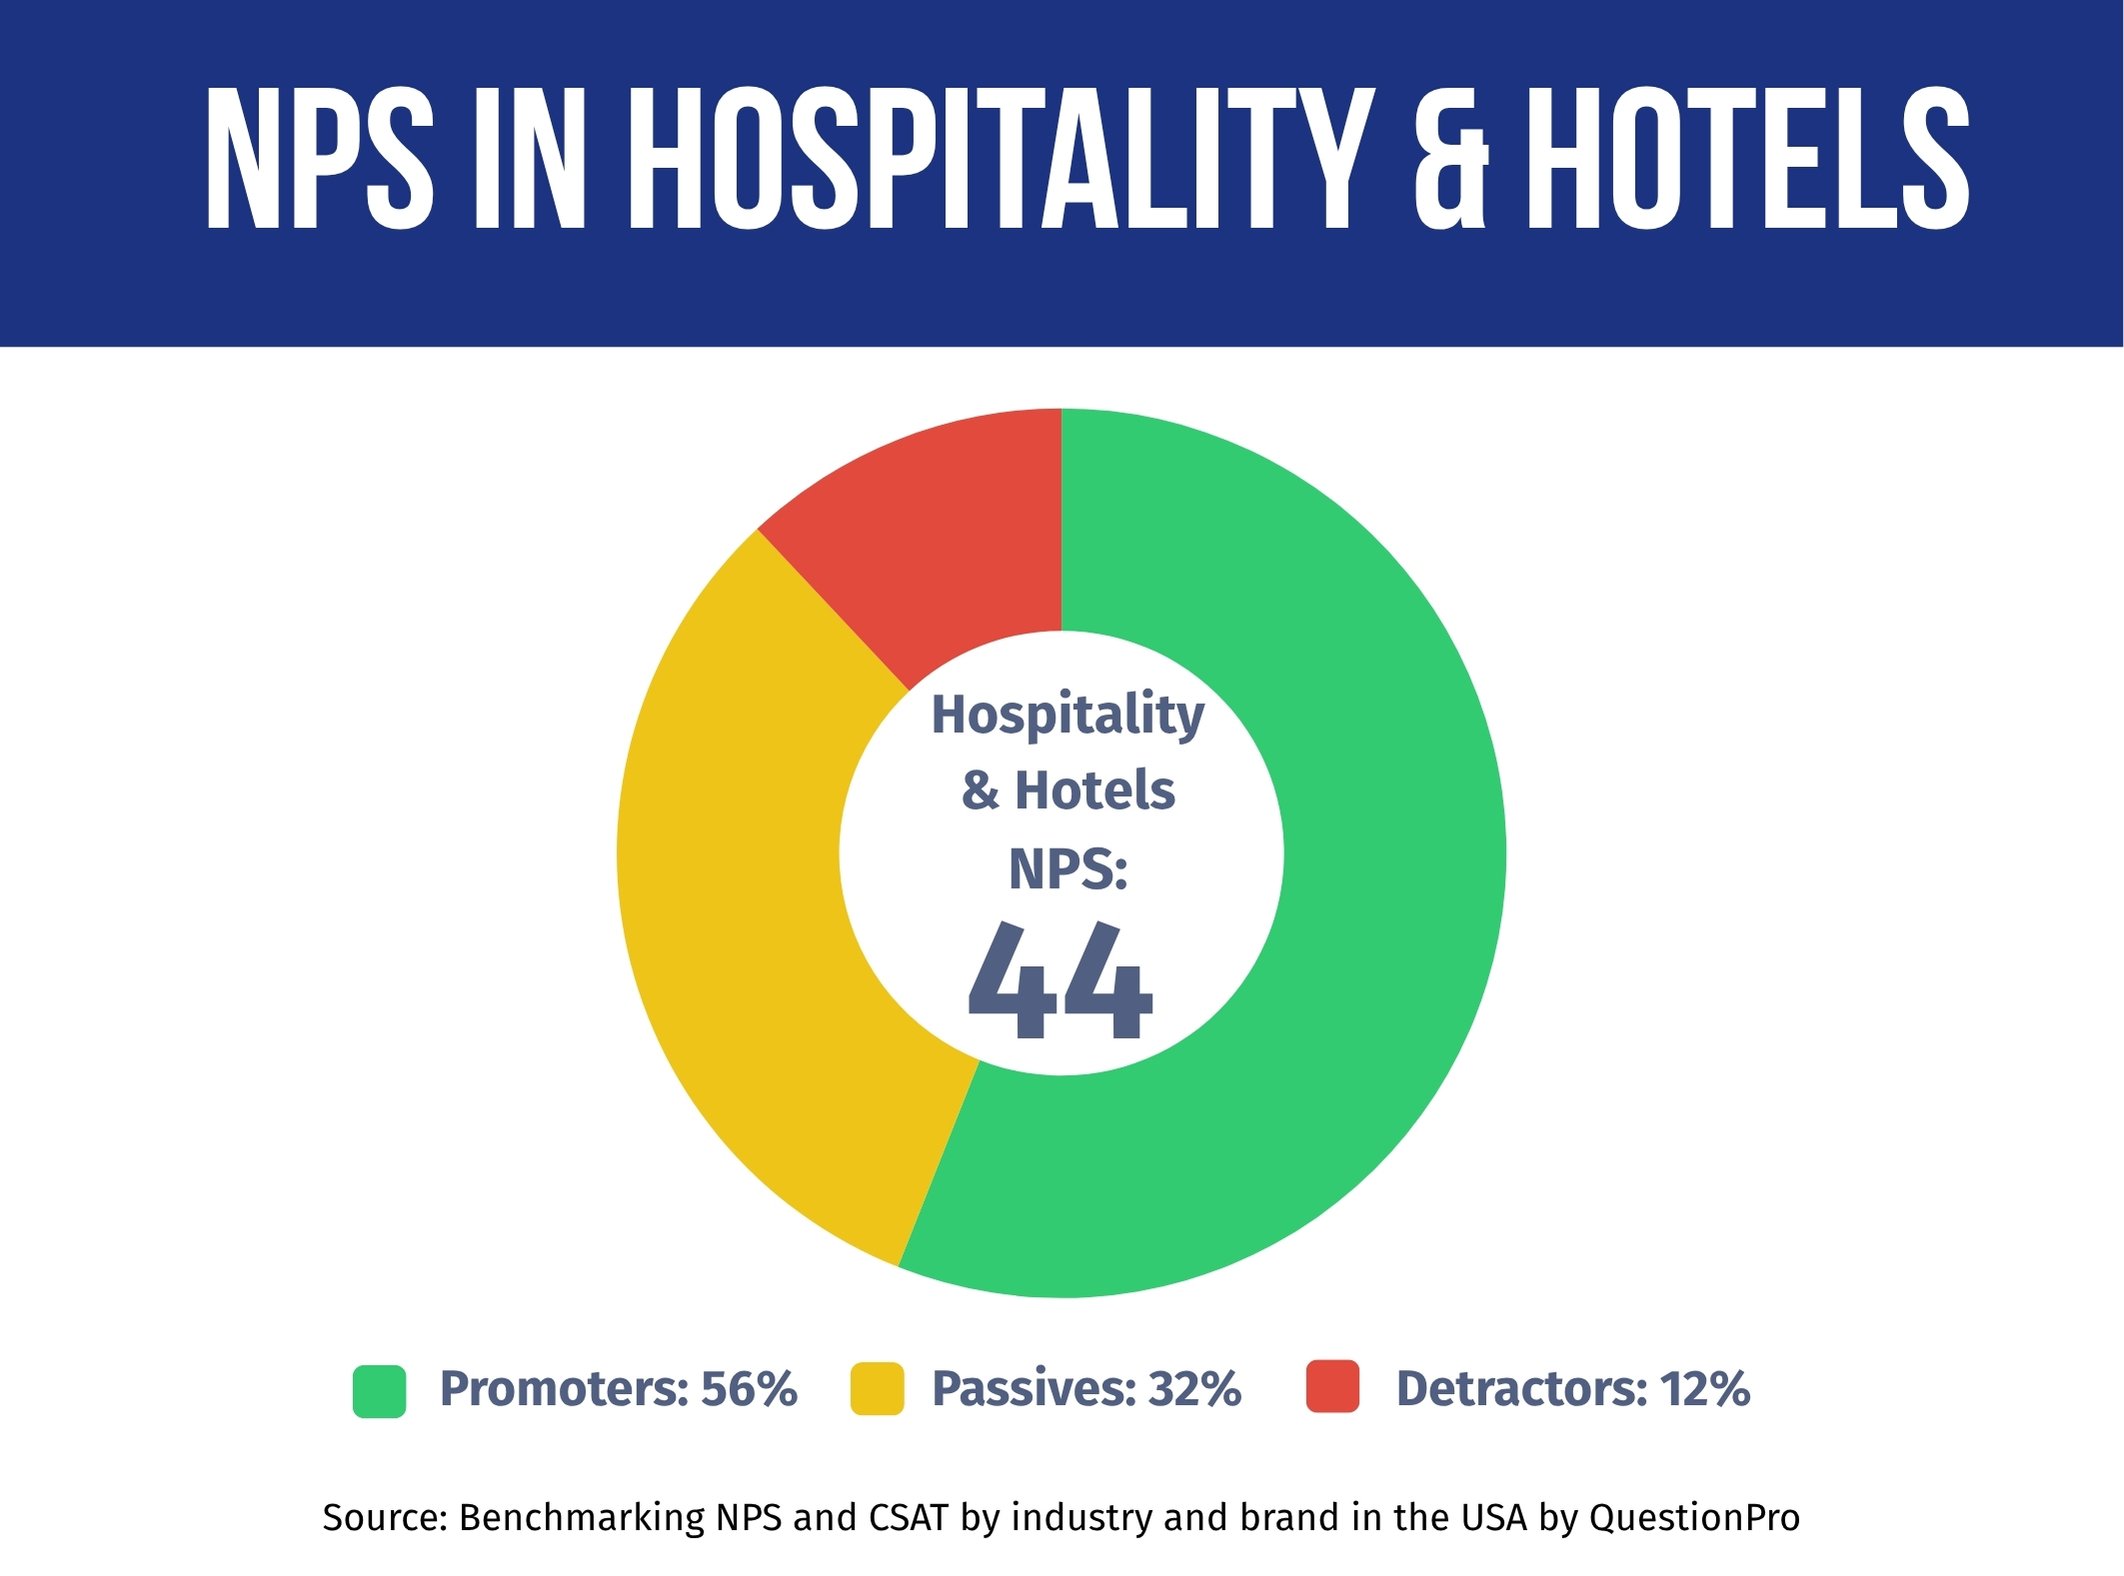
According to our QuestionPro’s Q1 2025 Benchmarking NPS and CSAT Report, the Hotel & Hospitality industry soared to the top spot with an outstanding NPS of 44, the highest score among all seven sectors analyzed.
Industry Performance Context: Where Hotels Stand
Our study shows a clear picture of customer loyalty across key sectors, showcasing how NPS in Hospitality & Hotels leads the pack:
- Hotel & Hospitality: 44 NPS (Highest Performer)
- Banking & Credit Unions: 41 NPS
- Automotive: 41 NPS
- Big Box Retail: 37 NPS
- Grocery Retail: 37 NPS
- Airlines: 33 NPS
- Insurance: 23 NPS (Lowest)
This industry-leading score of 44 signifies that hotels and hospitality providers are excelling at creating experiences that inspire genuine guest loyalty and advocacy.
Interpreting Your Hotel’s NPS Score
What does your specific NPS in Hospitality & Hotels mean? Use this general guide:
- Above 50: Exceptional Performance. World-class guest loyalty, creating passionate advocates.
- 30-50: Strong Performance. Solid guest advocacy and loyalty is the industry benchmark zone.
- 0-30: Needs Improvement. Room to significantly enhance the guest experience.
- Below 0: Urgent Attention Required. Signals serious guest dissatisfaction impacting reputation.
With the industry average setting the bar high at 44, most hospitality players demonstrate strong performance. Yet, reaching that coveted “Exceptional” tier above 50 remains the ultimate goal for guest-centric leaders.
NPS Benchmarks in Hospitality & Hotels: Leaders vs. Challengers
Our Q1 2025 study reveals striking disparities in guest loyalty across major hotel brands, demonstrating how customer experience strategies directly impact advocacy metrics.
These insights come from QuestionPro’s latest study, which surveyed 1,000 participants to measure NPS across leading companies and industries. The report is based on real customer feedback from Q1 2025 and is updated quarterly.
We invite you to download the full report. It’s a valuable resource for evaluating your company’s performance and determining your customers’ perceptions of you.
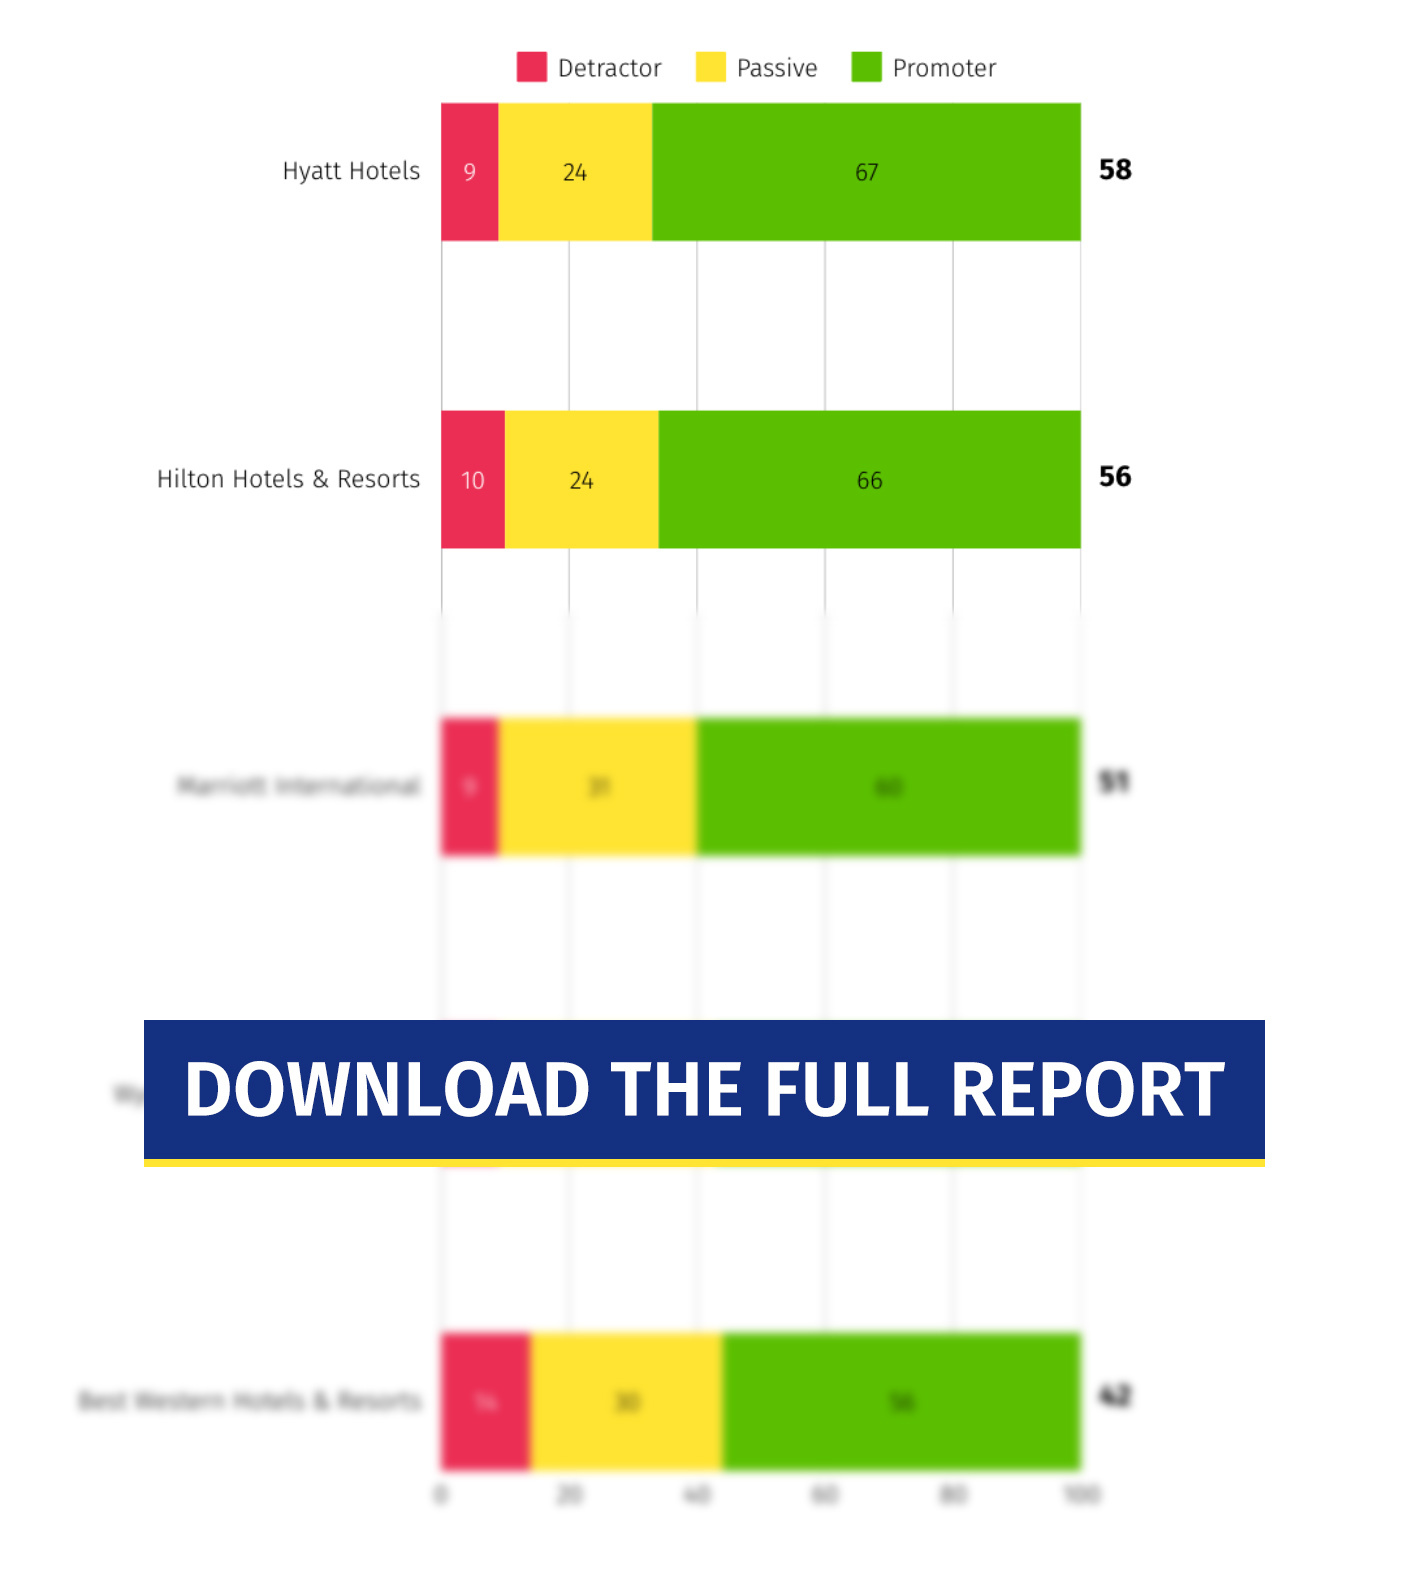
Key Performance Insights
The 16-point gap between the highest-performing brand (Hyatt Hotels, with a 58 NPS) and the lowest-performing brand (Best Western Hotels & Resorts, with a 42 NPS) illustrates the direct impact of customer experience strategies on guest loyalty outcomes.
Distribution Analysis:
- Detractors: Range from 9% (Hyatt Hotels) to 14% (Best Western Hotels & Resorts)
- Passives: Range from 24% (Hyatt Hotels, Hilton Hotels & Resorts) to 30% (Best Western Hotels & Resorts)
- Promoters: Range from 56% (Best Western Hotels & Resorts) to 67% (Hyatt Hotels)
Discover What Major Brands are Doing to Achieve an Excellent NPS
Click here to access a detailed analysis of how the major Hospitality & Hotels industries included in our study maintain customer satisfaction and how this has impacted their Net Promoter Score.
Hyatt NPS
Leading the sector with a 58 NPS score, Hyatt’s focus on premium experiences and personalized service drives exceptional customer advocacy.
Hilton NPS
Close behind with 66% Promoters, Hilton’s consistent quality and loyalty programs cultivate strong repeat-business sentiment.
Marriot NPS
Balances 60% Promoters with industry-low Detractor rates (9%), reflecting reliable upscale experiences.
Wyndham Worldwide Corp NPS
Achieving a 48 NPS, Wyndham benefits from diverse brand offerings and value-focused stays that appeal to both leisure and business travelers.
Best Western NPS
With a 42 NPS, Best Western earns customer loyalty through dependable service, competitive pricing, and a broad network of convenient locations.
What We Can Understand from Hospitality & Hotels NPS Leaders and Challenges
The stark differences in hotel NPS performance reflect deliberate customer experience (CX) strategies. Below, we analyze what sets top performers apart:
- Signature Guest Experiences Drive Advocacy
Hyatt Hotels (58 NPS | 67% Promoters) leads the sector by transforming stays into memorable moments. With an industry-low 9% detractor Rate, their focus on personalized touches ranging from curated local experiences to tailored room amenities proves that guests value uniqueness over transactional service. This approach fosters emotional loyalty, which in turn translates to referrals.
- Consistency Across Touchpoints Builds Trust
Hilton Hotels & Resorts (56 NPS | 66% Promoters) excels through operational excellence. Their 24% Passive rate (lowest in the sector) indicates minimal experience gaps. By delivering reliable quality at every interaction, whether digital check-ins, dining, or housekeeping, they convert satisfied guests into enthusiastic promoters.
- Loyalty Ecosystems Retain High-Value Guests
Marriott International (51 NPS | 60% Promoters | 9% Detractors) leverages its Bonvoy program to create stickiness. The low Detractor rate shows that integrated rewards (room upgrades, experiential perks) mitigate dissatisfaction. Guests become investors in the brand ecosystem. 31% of Passives represent untapped revenue potential through tier benefits.
Common Challenges and Learning Opportunities
- Consistency at Scale: Major hotel chains struggle to maintain experience quality across diverse properties. The performance delta between flagship properties and older locations shows how scale can dilute brand promises without rigorous quality control systems.
- Reputation Recovery in the Digital Age: Online review ecosystems amplify negative experiences; one viral complaint can impact bookings for months. Leaders like Hyatt combat this through proactive reputation management, which involves monitoring review platforms in real-time and empowering staff to resolve issues before guests check out.
- Human-Tech Integration: Contrast this with Hilton’s success; their Digital Key tech supplements staff who greet guests by name, proving seamless integration requires both system reliability and emotional intelligence training.
Measuring and Improving Your Hotel’s NPS
As the industry maxim goes, “What isn’t measured can’t be improved.” Let’s explore actionable steps to track your NPS and continuously enhance guest loyalty.
- Establish Baseline Metrics
Begin with QuestionPro NPS survey templates to understand your position relative to hospitality benchmarks. Maintain consistent timing and methodology for reliable comparisons.
- Segment Your Analysis
Break down results by guest type (business/leisure), booking channel, or property tier. Different segments have unique expectations; the drivers of a luxury resort differ from those of a budget chain.
- Monitor Quarterly
Implement ongoing tracking to identify trends and measure the impact of CX initiatives. Hospitality demand fluctuates seasonally – regular measurement accounts for these variables.
While this may seem complex, purpose-built tools like QuestionPro Customer Experience simplify the process by enabling:
- Closed-Loop Feedback Systems: Automate follow-ups with Promoters (to harness advocacy) and Detractors (to resolve issues). Example: Immediate recovery offers for guests with a rating of ≤ 6.
- Predictive Analysis: Use NPS trends to forecast behavior, such as identifying at-risk loyal guests before they switch brands.
- Cross-Channel Consistency: Ensure seamless experiences across touchpoints, from mobile check-ins to concierge interactions. Visualize journey maps to identify friction points.
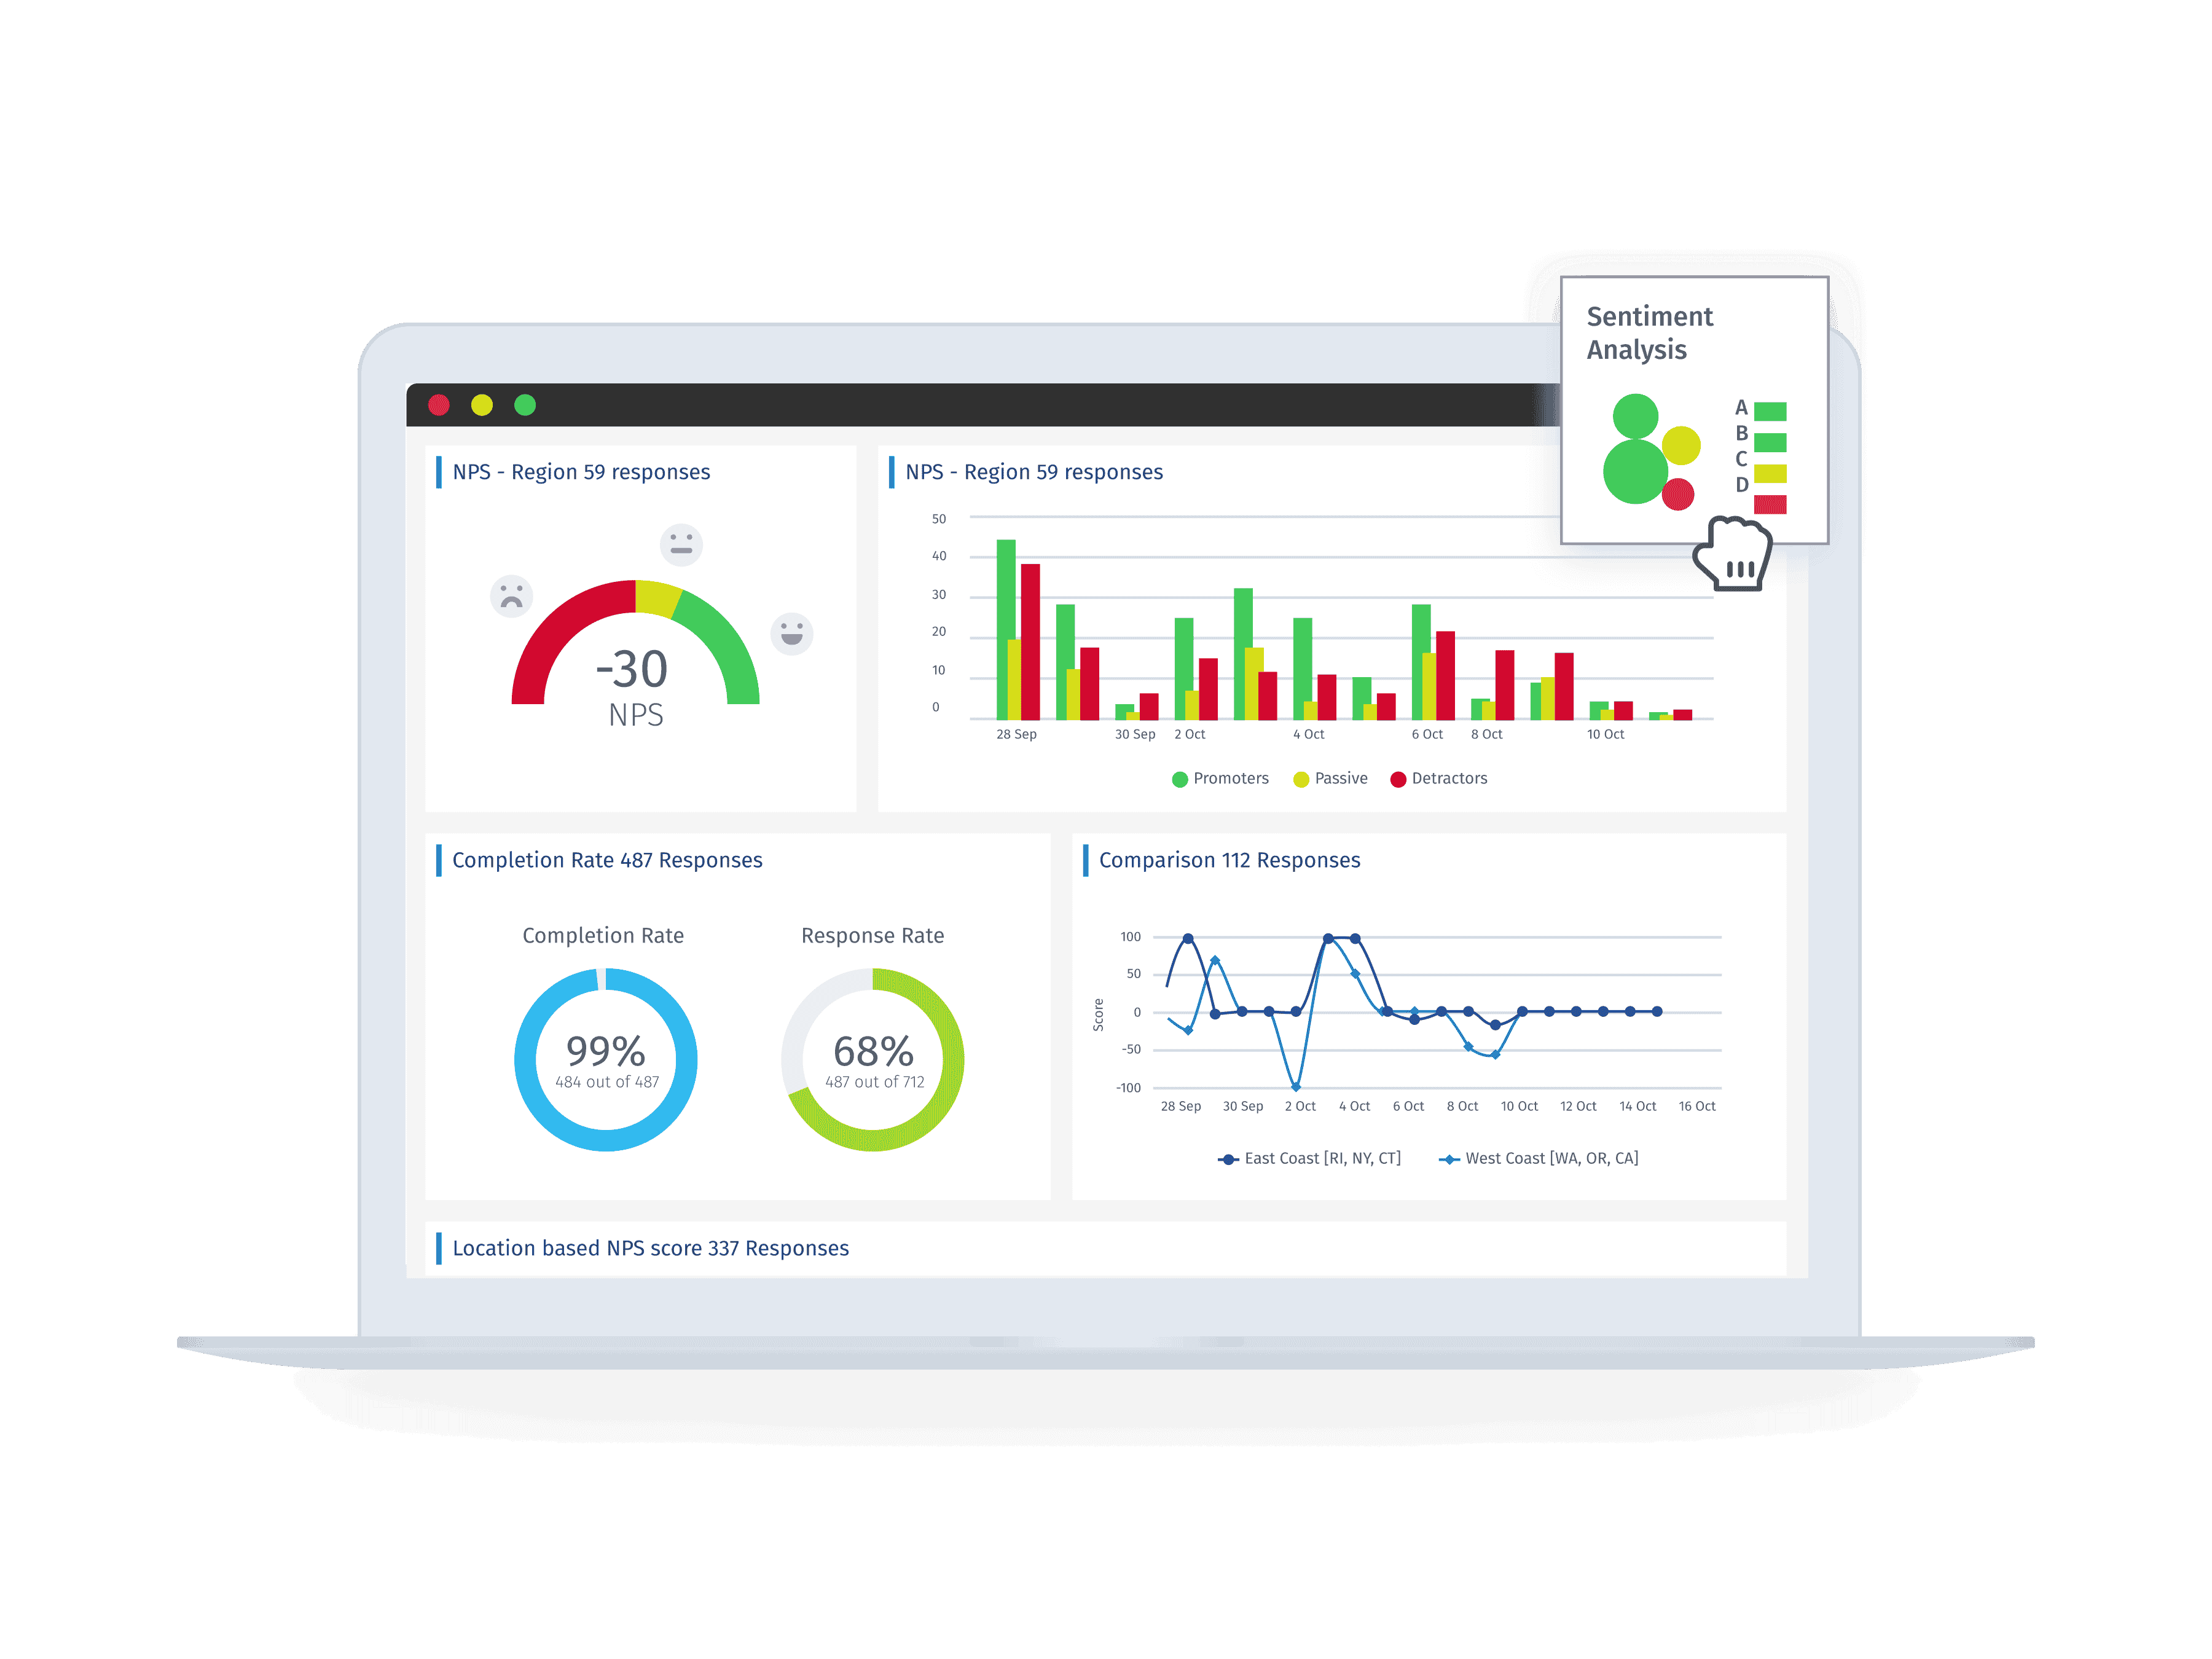
With QuestionPro Customer Experience, you can measure your Net Promoter Score in minutes, as well as implement initiatives and systems to maintain constant monitoring that allows you to keep your customers satisfied and stay on par with major leaders in your industry.
Conclusion: The Future of NPS in Hospitality Brands
The hotel industry’s leading NPS of 44, the highest among all sectors surveyed, demonstrates the sector’s commitment to elevating guest experiences. However, the gap between top and bottom performers reveals significant improvement opportunities that still exist.
Hotel brands that prioritize authentic guest relationships, invest in seamless technology-enabled stays, and deliver consistent service quality across every touchpoint will continue to outperform competitors in loyalty metrics.