Brand perception surveys are structured questionnaires that measure what people think and feel about your brand, and how that compares with the image you intend to project. They capture awareness, associations, trust, and likelihood to recommend, all in the customer’s own words.
Perception forms from ads, reviews, service calls, and what friends say. You cannot read it from sales data alone. A direct survey is the fastest way to see the gap between the brand you think you are and the brand people actually remember.
In this guide, we’ll cover what to measure, which questions to ask, a ready-to-use template, how to run the study step by step, and how to turn the results into action.
What is a brand perception survey?
A brand perception survey is a research questionnaire that measures the beliefs, feelings, and associations people hold about a brand. It asks customers, prospects, and sometimes employees to describe the brand, rate it, and compare it with competitors.
Brand perception itself is the sum of impressions a person has formed about your brand over time. Some of those impressions come from direct experience. Others come from reviews, social media, advertising, and word of mouth.
Teams usually run these surveys at four moments:
- Before a product launch, to set a baseline
- During a rebrand, to test whether the new identity lands
- After a campaign, to see whether messaging shifted opinion
- On a fixed schedule, to track brand health over time
For a broader look at the concept, see our guide to brand perception.
How is brand perception different from brand awareness, equity, and tracking?
Brand perception is about what people think and feel. Awareness is about whether they recognize the name at all. Equity is the commercial value that a strong reputation adds. Teams often treat these terms as interchangeable, and that leads to surveys that answer the wrong question.
| Term | What it answers | Typical method |
|---|---|---|
| Brand perception | What do people think and feel about us? | Perception survey, word association |
| Brand awareness | Do people know we exist? | Aided and unaided recall questions |
| Brand equity | How much extra value does our name add? | Price premium tests, preference studies |
| Brand tracking | How is all of this changing over time? | Repeated survey waves |
A brand perception survey often includes a few awareness questions as a screener. It does not replace a full brand awareness survey or ongoing brand tracking.
Why do brand perception surveys matter?
Brand perception surveys matter because buying decisions rest heavily on trust and emotion, and neither shows up in sales reports. A survey turns those hidden factors into numbers you can compare quarter to quarter.
Two findings show how much weight perception carries:
- Edelman’s special report on brands found that 80% of people trust the brands they personally use, and that trust now sits alongside price and quality as a purchase consideration.
- Research reports that about 70% of decisions are driven by emotional factors, with only 30% driven by rational ones.
In practice, a survey does four jobs:
- Shows where your intended image and the real one diverge
- Tells you whether trust is rising or falling
- Gives marketing a baseline to prove campaign impact
- Gives product and service teams evidence about what customers value most
What do brand perception surveys measure?
Brand perception surveys measure six things: awareness, associations, sentiment, trust and quality, competitive position, and loyalty. Each answers a different question about how people see you. Choose the ones that match your goal rather than measuring everything at once.
| Metric | Question it answers | Example measure |
|---|---|---|
| Awareness | Do people know the brand? | Unaided recall rate |
| Associations | What words come to mind? | Top five descriptors |
| Sentiment | How do people feel? | Positive-to-negative rating |
| Trust and quality | Do people believe the brand delivers? | Trust score on a 1 to 5 scale |
| Competitive position | How do we compare? | Preference share versus rivals |
| Loyalty | Will people stay and advocate? | Net Promoter Score (NPS) |
Net Promoter Score is the percentage of promoters (scores of 9 or 10) minus the percentage of detractors (scores of 0 to 6) on a 0 to 10 recommendation question. QuestionPro explains the method on its Net Promoter Score page.
Which brand perception metrics should you prioritize?
Prioritize the metrics that match your business goal, and track no more than four or five at a time. Measuring everything produces a long survey and a dashboard nobody reads. Start from the decision you need to make, then work backward to the metric.
- Launching a new brand or product: Focus on unaided awareness and associations. You need to know whether anyone can name you and what they expect.
- Running a rebrand: Focus on associations and sentiment before and after. The shift in descriptive words is your proof of change.
- Defending against a competitor: Focus on competitive position and preference share. These show where you are losing head-to-head.
- Reducing churn: Focus on trust, quality, and NPS among existing customers. Detractor comments will name the cause.
- Recovering from bad press: Focus on trust and sentiment, tracked monthly until they stabilize.
If you can only afford one metric, pick the one tied to your biggest open decision. A single well-chosen metric beats six that nobody acts on.
Who should you survey?
You should survey the groups whose opinions shape your growth, not just the customers who are easiest to reach. A survey sent only to loyal buyers will flatter you. Perception among people who never bought is often where the biggest gaps sit.
Current and past customers
Current customers show whether the brand promise matches the experience. Lapsed customers explain what broke that promise. Compare the two groups, because the difference points to your churn drivers.
- Ask current customers: What do we do better than anyone else?
- Ask lapsed customers: What made you stop buying from us?
Prospects and non-customers
Prospects tell you whether your reputation helps or hurts at the consideration stage. They also reveal which competitor you are mentally grouped with. That grouping is rarely the one your strategy deck assumes.
Include buyers of rival brands when your goal is competitive positioning. Their answers show why they chose someone else.
- Ask prospects: Which brands would you consider first, and why?
Employees
Employees describe the brand from the inside. When their answers differ sharply from customers’ answers, internal messaging and external messaging are out of sync.
- Ask employees: How would you explain our brand to a friend?
What are the best brand perception survey questions?
The best brand perception survey questions are short, neutral, and grouped by what they measure. Mix closed questions, which give you numbers to track, with open-ended ones, which give you the reasons behind the numbers. The examples below use a fictional brand called ABC.
Awareness questions
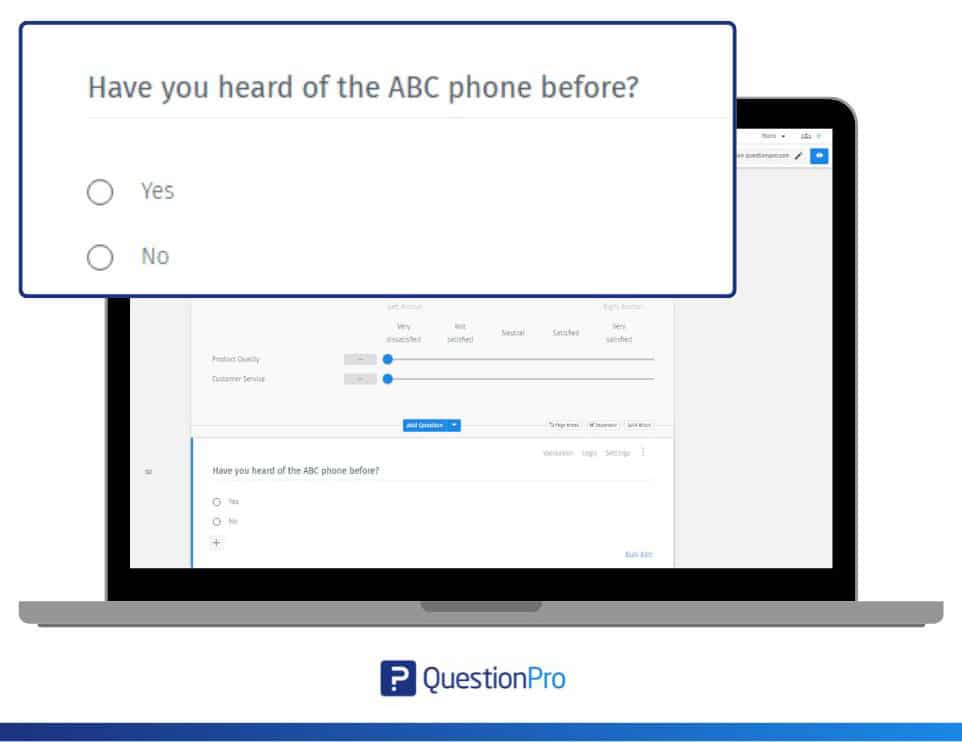
- When you think of smartphones, which brands come to mind first? (open text)
- Which of these brands have you heard of? (select all that apply)
- How familiar are you with ABC? (not at all to very familiar)
Ask the unaided question first. If you show a brand list before it, you contaminate the answer.
Association questions
Association questions reveal the words people attach to your brand. They are the core of any perception study.
- What is the first word that comes to mind when you think of ABC?
- Which of these describe ABC? (innovative, trustworthy, premium, affordable, outdated)
- How would you describe ABC to a friend in one sentence?
Trust and quality questions

| Question | Scale |
|---|---|
| How much do you trust ABC to deliver on its promises? | 1 (not at all) to 5 (completely) |
| How would you rate the quality of ABC products? | Poor to excellent |
| ABC meets my expectations. | Strongly disagree to strongly agree |
Competitive questions
- Compared with XYZ, how would you rate ABC on quality?
- Which brand would you choose for your next purchase?
- What does XYZ do better than ABC?

Loyalty and open-ended questions
Close with loyalty and one open-ended prompt. Respondents are warmed up by then and write more.
- How likely are you to recommend ABC to a friend or colleague? (0 to 10)
- What do you like most about ABC?
- What one change would make you think more highly of ABC?
Which question types work best?
Likert scales, semantic differential scales, and laddering questions work best because each captures a different layer of perception. A Likert scale measures agreement. A semantic differential places the brand between opposite adjectives. Laddering uncovers why a feature matters to the customer.
- Likert scale: Respondents rate a statement from strongly disagree to strongly agree. It suits trust and satisfaction items.
- Semantic differential: Respondents place the brand on a scale between two opposites, such as “traditional” and “innovative.” It shows personality at a glance.
- Laddering: A chain of “why does that matter?” questions moves from a product feature to a personal value. It reveals the emotional motive behind a preference.
- Open-ended: Free text surfaces language you did not think to offer as an answer option.
Use no more than one or two open-ended questions per survey. They add depth, but they also add fatigue.
A brand perception survey template you can copy
A good template covers each perception layer in about 10 to 12 questions and takes under five minutes to complete. Shorter surveys finish better and produce cleaner data. Adapt the wording to your category and swap “ABC” for your own brand.
| # | Question | Layer measured |
|---|---|---|
| 1 | Which brands come to mind when you think of this category? (unaided) | Awareness |
| 2 | Which of these brands have you heard of? (aided) | Awareness |
| 3 | How familiar are you with ABC? | Awareness |
| 4 | What three words would you use to describe ABC? | Associations |
| 5 | Which of these describe ABC? (select all that apply) | Associations |
| 6 | How do you feel about ABC overall? (1 to 10) | Sentiment |
| 7 | How much do you trust ABC to deliver on its promises? (1 to 5) | Trust |
| 8 | How would you rate ABC’s quality compared with XYZ? (1 to 5) | Competitive position |
| 9 | Which brand would you choose for your next purchase? | Preference |
| 10 | How likely are you to recommend ABC? (0 to 10) | Loyalty |
| 11 | What is one thing ABC should change? | Open feedback |
| 12 | Which best describes you? (current customer, past customer, never purchased) | Segmentation |
Put the screening and demographic questions last. Early personal questions raise drop-off.
Step-by-step guide to running a brand perception survey
To run a brand perception survey, define a goal, choose your audience, write neutral questions, pilot the survey, collect responses, analyze by segment, and report with actions. Following the order below prevents the most common errors, such as a biased sample or an unfocused questionnaire.
- Set one clear goal.
Examples include “establish a baseline” or “test a rebrand.” One goal keeps the survey short. - Choose your audiences.
Pick customers, prospects, lapsed buyers, or employees, based on the goal. - Draft the questions.
Use the categories above and remove anything leading, such as “How much do you love our innovative service?” - Pilot with a small group.
Send it to 20 to 30 people and watch for confusing questions and unusual drop-off. - Field the survey.
Keep the window open for one to two weeks and send one reminder. - Clean and analyze the data.
Remove duplicates and speeders, then compare results by segment. - Report and assign actions.
Give every finding an owner and a next step.
How many responses do you need, and how often should you survey?
Aim for at least 300 to 400 completed responses per audience segment, and survey quarterly or twice a year. Sample size controls the margin of error, which is the range within which the true result probably sits. Frequency controls how quickly you spot change.
| Completed responses | Approximate margin of error (95% confidence) |
|---|---|
| 100 | About ±9.8% |
| 400 | About ±4.9% |
| 1,000 | About ±3.1% |
These figures come from the standard margin of error formula for a 50% result.
For cadence, most brands do well with one or two waves a year. Move to quarterly waves during a rebrand, a launch, or a reputation issue. Keep sampling and question wording identical across waves, or the trend line stops meaning anything.
How do you analyze brand perception survey results?
Analyze results by comparing them against three things: your intended brand image, your competitors, and your own past waves. A single score means little on its own. The change and the gap are what tell you something.
- Perception gap analysis: List the five traits you want associated with your brand. Compare them with the five traits respondents choose. Every mismatch is a gap.
- Segment comparison: Split results by customer status, age, region, or purchase frequency. Averages hide the segments that are unhappy.
- Trend analysis: Compare each metric with the prior wave, not with an abstract “good” number.
- Open-text coding: Group free-text answers into themes and count them. Sentiment analysis can speed this up on large volumes.
Report every number with its sample size. A 10-point swing among 40 respondents is noise, not news.
What does a perception gap look like in practice?
A perception gap appears when the traits customers assign to your brand differ from the traits you promote. This illustrative example shows how a survey exposes one and what a team does about it.
Imagine a regional meal-kit brand. Its marketing says “premium and chef-crafted.” The survey asks respondents to pick the words that describe the brand. The top answers are “convenient,” “affordable,” and “basic.”
Open-text answers explain why. Customers praise delivery speed but call the recipes repetitive. Non-customers have not heard of the chef partnerships at all.
The team now has a clear brief. It either invests in recipe variety to earn the premium image, or it repositions around convenience and value. Without the survey, it would have spent the next quarter promoting a quality story nobody believed.
Gaps also run the other way. A B2B software company might see itself as a low-cost challenger, while buyers describe it as the “safe, enterprise choice.” That is a good problem to find. It suggests the brand can raise prices or lead with reliability.
How do you improve brand image after the survey?
Improve brand image by matching each survey signal to a specific first action, then re-measuring in the next wave. Perception changes slowly, so expect movement over several quarters rather than weeks.
| Survey signal | Likely cause | First action |
|---|---|---|
| Low unaided awareness | Weak reach or unclear category fit | Test new channels and category messaging |
| Traits differ from your intended image | Messaging does not match experience | Fix the experience first, then adjust the message |
| Falling NPS | Service or product problems | Read detractor comments and fix the top two issues |
| High awareness, low trust | Broken promises or poor reviews | Respond publicly and close the loop with customers |
| Employees describe a different brand | Internal misalignment | Share survey findings and align messaging |
Close the loop with respondents who gave low scores. A short follow-up message builds the trust the survey just measured.
Should you use surveys alone to measure brand perception?
No. Surveys tell you what people say when asked, while social listening and reviews show what they say unprompted. The two sources answer different questions, and the strongest brand programs use both.
Surveys give you structured, comparable numbers across audiences and over time. Social listening and review analysis give you real-time language, complaints, and emerging themes. A survey might show trust dropping two points. Review text explains that a delayed shipping policy caused it.
Use review and social data as an early warning system between survey waves. When a theme spikes, add one or two targeted questions to the next wave to test it with a controlled sample. Keep surveys as the benchmark, because they are the only method that lets you compare the same questions across the same audiences.
What are the most common brand perception survey mistakes?
The most common mistakes are surveying only happy customers, asking leading questions, changing the questionnaire between waves, and collecting data without a plan to act on it. Each one weakens the conclusions you can draw.
- Biased sample: Sending the survey only to your email list of loyal buyers inflates every score.
- Leading wording: Questions that hint at the “right” answer produce flattering and useless data.
- Too many questions: Long surveys cause drop-off and rushed answers.
- Inconsistent waves: Changing wording or audience breaks comparisons over time.
- Ignoring open text: The comments explain the scores. Skipping them leaves you with numbers and no story.
- No owner for results: Findings without owners rarely change anything.
How do you run brand perception surveys in QuestionPro Customer Experience?
QuestionPro Customer Experience lets you build the survey once and repeat it across waves with identical wording. That consistency is what makes trend lines trustworthy. This section covers the capabilities that matter most for this type of study.

- Faster survey building: QuestionPro AI can draft questions from a short description of your goal, which you then edit.
- Consistent question types: Matrix, semantic differential, and NPS questions sit in the same builder, so one survey can hold all six perception layers.
- Dashboards by segment: Filter results by customer status or region to find the groups pulling your averages down.
- Open-text analysis: Sentiment analysis tags free-text comments so you can count themes instead of reading every response.
Teams that already track NPS can add perception questions to the same program rather than running a separate study.
Perception is a promise you keep measuring
A brand is not what you say it is. It is what people repeat when you are not in the room. Brand perception surveys give you a reliable way to hear that version, compare it with the one you intended, and close the distance one decision at a time.
Start small. Pick one audience, ask 10 to 12 neutral questions, and set a baseline. Then repeat the same survey on a schedule. The first wave tells you where you stand. The second tells you whether your work is moving the needle.
For a wider view of how perception fits with awareness, loyalty, and sales signals, read our guide to brand measurement.
Frequently Asked Questions (FAQs)
Cost depends on audience size, how hard the audience is to reach, and who runs the study. A do-it-yourself online survey costs far less than an agency-run study, where fees also cover design, fieldwork, and reporting.
Yes. A small business can survey 100 to 150 customers and prospects through email and social channels. Results will carry a wider margin of error, but they still reveal clear patterns in how people describe and trust the brand.
No universal benchmark exists, because scores depend on category and audience. Compare your results against your own previous waves and against direct competitors. For NPS, a score above 0 means more promoters than detractors, and the useful signal is the direction of change.
Set quotas for age, gender, region, and income that match US Census Bureau figures, then weight the final data if any group is over- or under-represented. Online panels make quota sampling practical for national brand studies.
A satisfaction survey asks existing customers how a specific purchase or interaction went. A brand perception survey asks a wider audience, including non-customers, how they see the brand overall. Satisfaction measures experience, while perception measures reputation and image.