



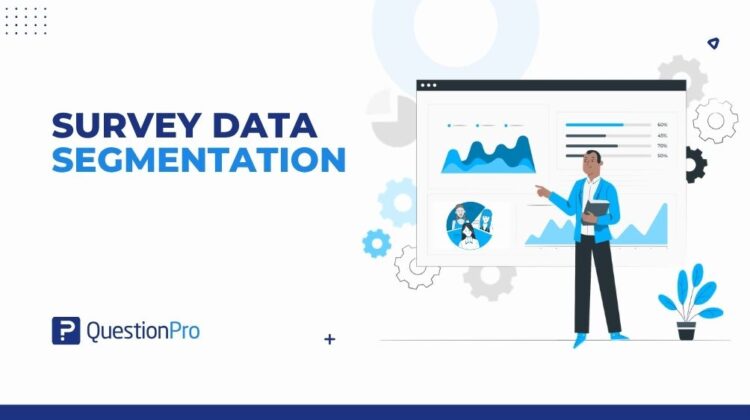
Survey data segmentation is the process of splitting a full set of responses into smaller, meaningful groups so patterns stop hiding inside the average. A single satisfaction score of 72% tells you almost nothing about why that number looks the way it does. Segmentation shows you which group is pulling it up and which one is pulling it down.
This matters most once a survey passes a few hundred responses. At that scale, one overall score hides real differences between age groups, regions, customer tiers, and time periods. Segmentation is what lets a business turn a flat report into targeted decisions, without running a separate survey for every audience it wants to understand.
In this article, we will define survey data segmentation, walk through the main types, and cover a step-by-step process for setting it up, along with common mistakes to avoid.
What is survey data segmentation?
Survey data segmentation is the practice of dividing survey responses into subgroups based on shared characteristics, so each group can be analyzed on its own instead of only as part of the total sample. A characteristic can be anything recorded about a respondent: a demographic detail, an answer to a specific question, or the date they completed the survey.
Segmentation gives a research or CX team several practical advantages:
- It reveals opportunities for growth that a single aggregate score would never show.
- It lets teams target communication toward the audience most likely to respond to it.
- It reduces the need to run multiple separate survey campaigns for different groups.
- It turns raw response data into a starting point for real decisions, not just a report.
Segmentation is not the same as filtering out bad data. It keeps every valid response in the dataset and simply reorganizes how that data gets viewed and compared.
Types of survey data segmentation
Most survey platforms, including QuestionPro’s data segmentation tool, support several ways to group responses. Each type answers a different research question, and most projects end up combining two or three of them.
| Segmentation type | Groups responses by | Best used for |
|---|---|---|
| Demographic | Age, gender, income, job title | Comparing how different audience groups experience a product |
| Custom variable | Email list code, external reference ID, custom fields | Comparing responses across campaigns, accounts, or source lists |
| Time-based | Date or time window a response was submitted | Tracking how sentiment shifts before or after an event or launch |
| Behavioral | Actions taken, such as purchase history or usage frequency | Separating active users from lapsed ones |
| Psychographic | Values, attitudes, lifestyle | Understanding the “why” behind stated preferences |
| Geographic | Region, city, country | Adjusting messaging or service for local conditions |
Demographic and psychographic segmentation are borrowed directly from market research, where they are also used for broader customer segmentation work outside of a single survey.
Which segmentation approach fits your survey?
The right type of segmentation depends on the question a team is actually trying to answer, not on which option is easiest to set up.
Use this as a starting filter:
- If the goal is understanding who responded differently, start with demographic segmentation.
- If the goal is comparing separate campaigns, lists, or accounts, use custom variable segmentation.
- If the goal is tracking change around a specific date or launch, use time-based segmentation.
- If the goal is separating engaged users from disengaged ones, use behavioral segmentation.
- If the goal is understanding motivation rather than just outcome, layer in psychographic data.
Many research teams find that a single market segmentation framework built for one study can be reused across future surveys once the variable structure is set up correctly.
How to segment survey response data: a step-by-step guide
Setting up segmentation follows roughly the same sequence on most survey software platforms, even though menu names differ.
- Decide the grouping criteria first. Pick the variable that matters most to the current research question before opening any tool.
- Open the segmentation or grouping feature inside your survey’s reporting section. In QuestionPro, this sits under Surveys, Reports, Advanced Analysis, then Grouping and Segmentation.
- Create a new segment and name it clearly. A label like “Male, 25 to 34” is easier to reuse later than “Segment 1.”
- Set the selection criteria. For a custom variable, separate multiple values with commas. For a time-based segment, define the start and end date or time window.
- Repeat for each comparison group. Most platforms allow up to ten active segments at once, which is enough for most side-by-side comparisons.
- Apply the segments to your report and review how each group’s answers differ from the overall average.
Segments do not need to exist before a survey launches. They can be created at any point during or after data collection, since segmentation runs independently of the collection process itself.
Real-world examples of survey data segmentation
A SaaS company running a quarterly customer satisfaction survey might segment by account tier, comparing how enterprise customers rate support response time against self-serve customers. The two groups often show opposite trends that a blended score would completely mask.
An HR team measuring engagement after a policy change might use time-based segmentation, comparing responses submitted before the announcement against those submitted after it. This isolates the actual effect of the change from normal week-to-week variation.
An events team collecting post-webinar feedback might segment by custom variable, comparing responses tied to different registration source lists. That comparison shows which marketing channel brought in attendees who found the most value, which then shapes where future promotion budget goes.
Segmentation vs. cross-tabulation vs. cluster analysis: What’s the difference?
These three terms get used interchangeably, but they describe different steps in survey analysis.
| Term | What it actually does |
|---|---|
| Segmentation | Divides respondents into predefined groups based on a chosen variable |
| Cross-tabulation | Compares two variables against each other inside a table to see how they relate |
| Cluster analysis | Uses statistical methods to discover groups that were not defined in advance |
Segmentation answers “how did this known group respond.” Cross-tabulation answers “how do two variables relate to each other.” Cluster analysis answers a different question entirely: “what natural groups exist in this data that nobody thought to look for.”
In practice, segmentation is usually the first step, and cross-tabulation is the tool used to compare segments against specific survey questions.
How to know if your segmentation is working
Good segmentation produces groups that behave differently from each other and differently from the overall average. If every segment returns nearly identical results, the variable chosen probably is not the one driving the behavior you are trying to explain.
A few signs a segmentation strategy is working:
- Each segment is large enough to be statistically meaningful, generally at least 30 to 50 responses.
- The groups show a clear, explainable gap in at least one key metric.
- The insight leads to a specific action, such as a message change or a follow-up survey.
If a segment is too small or too similar to the total sample, merge it with a related group instead of reporting on it alone.
Common mistakes to avoid when segmenting survey data
Teams new to segmentation tend to repeat the same handful of errors, most of which are easy to catch once you know what to look for.
- Creating too many segments at once. A report split into fifteen tiny groups becomes harder to read than the single average it was meant to replace. Most projects only need three or four segments to answer the actual research question.
- Segmenting by a variable that was never collected well. A self-reported job title field with inconsistent formatting is a common culprit. Garbled input data produces garbled segments no matter how carefully the analysis is set up afterward.
- Confusing segmentation with sample filtering. Some teams quietly drop respondents who do not fit a segment instead of keeping the full dataset intact and simply viewing it in parts. That habit can bias the overall results without anyone noticing until much later.
Turning segments into decisions, not just charts
A segment only earns its place in a report if it changes what a team does next. The value of survey data segmentation was never in the grouping itself. It comes from what happens after: a support process gets adjusted for one customer tier, a message gets rewritten for one region, a follow-up survey gets sent only to the group whose answers raised a question.
McKinsey’s research on granular customer segmentation points to a similar conclusion outside of survey work specifically: businesses that move from broad, assumption-based groups to data-driven ones consistently make sharper, more targeted decisions. Survey segmentation is one of the more accessible ways to start building that habit, and platforms like QuestionPro Audience make it easier to reach the right respondents for each segment from the start.
Frequently Asked Questions (FAQs)
Most platforms cap simultaneous segments, often around ten, to keep comparison reports readable. Beyond that, reports get harder to interpret than a single unsegmented view, so it is better to focus on the segments tied most directly to the research question.
Yes. Segmentation criteria can be created or edited at any point during or after data collection because they operate independently of the collection process. This makes it possible to add a new segment mid-survey once an unexpected pattern shows up in early responses.
How is segmentation different from simply filtering out certain responses?
Filtering removes responses from a dataset entirely, while segmentation keeps every response and only changes how the data is grouped for comparison. Filtering can introduce bias if used carelessly, while segmentation preserves the full sample for accurate analysis.
Even a survey with a few hundred US small business respondents can benefit from basic segmentation, such as comparing new customers against repeat ones. The main limit is the sample size within each segment, not the size of the overall business running the survey.
Time-based segments should account for the respondent’s local time zone, not just the server’s default, especially for surveys sent across US regions spanning multiple time zones. Most modern survey tools let you configure this so a “morning” segment reflects each respondent’s actual morning.


[…] Ways to Use Data Segmentation in the Survey Process- http://blog.questionpro.com Data segmentation is one of the most useful tools when creating online surveys. The process helps your business identify opportunities for growth, target communication toward specific audiences, and reduce costs from having multiple survey campaigns. QuestionPro has different types of data segmentation grouping options available, including Custom Variable Based and Time Based. Lets look at data segmentation and what it can do for your survey research. Segmentation lets you sort responses based on parameters such as question responses, custom variables or time frames… […]