United Airlines NPS 2025 data puts the airline’s Net Promoter Score at 25, well behind the U.S. airline industry average of 33. That gap says less about a single bad flight and more about a pattern travelers keep running into.
Loyalty in air travel gets built or lost across dozens of small moments, from booking to baggage claim. Net Promoter Score captures the sum of those moments in one number, based on how likely passengers are to recommend an airline to someone else.
In this article, we’ll break down United’s 2025 NPS score, compare it against other major U.S. carriers, and cover the steps that move a score like this one closer to the industry lead.
What is United Airlines’ NPS score in 2025?
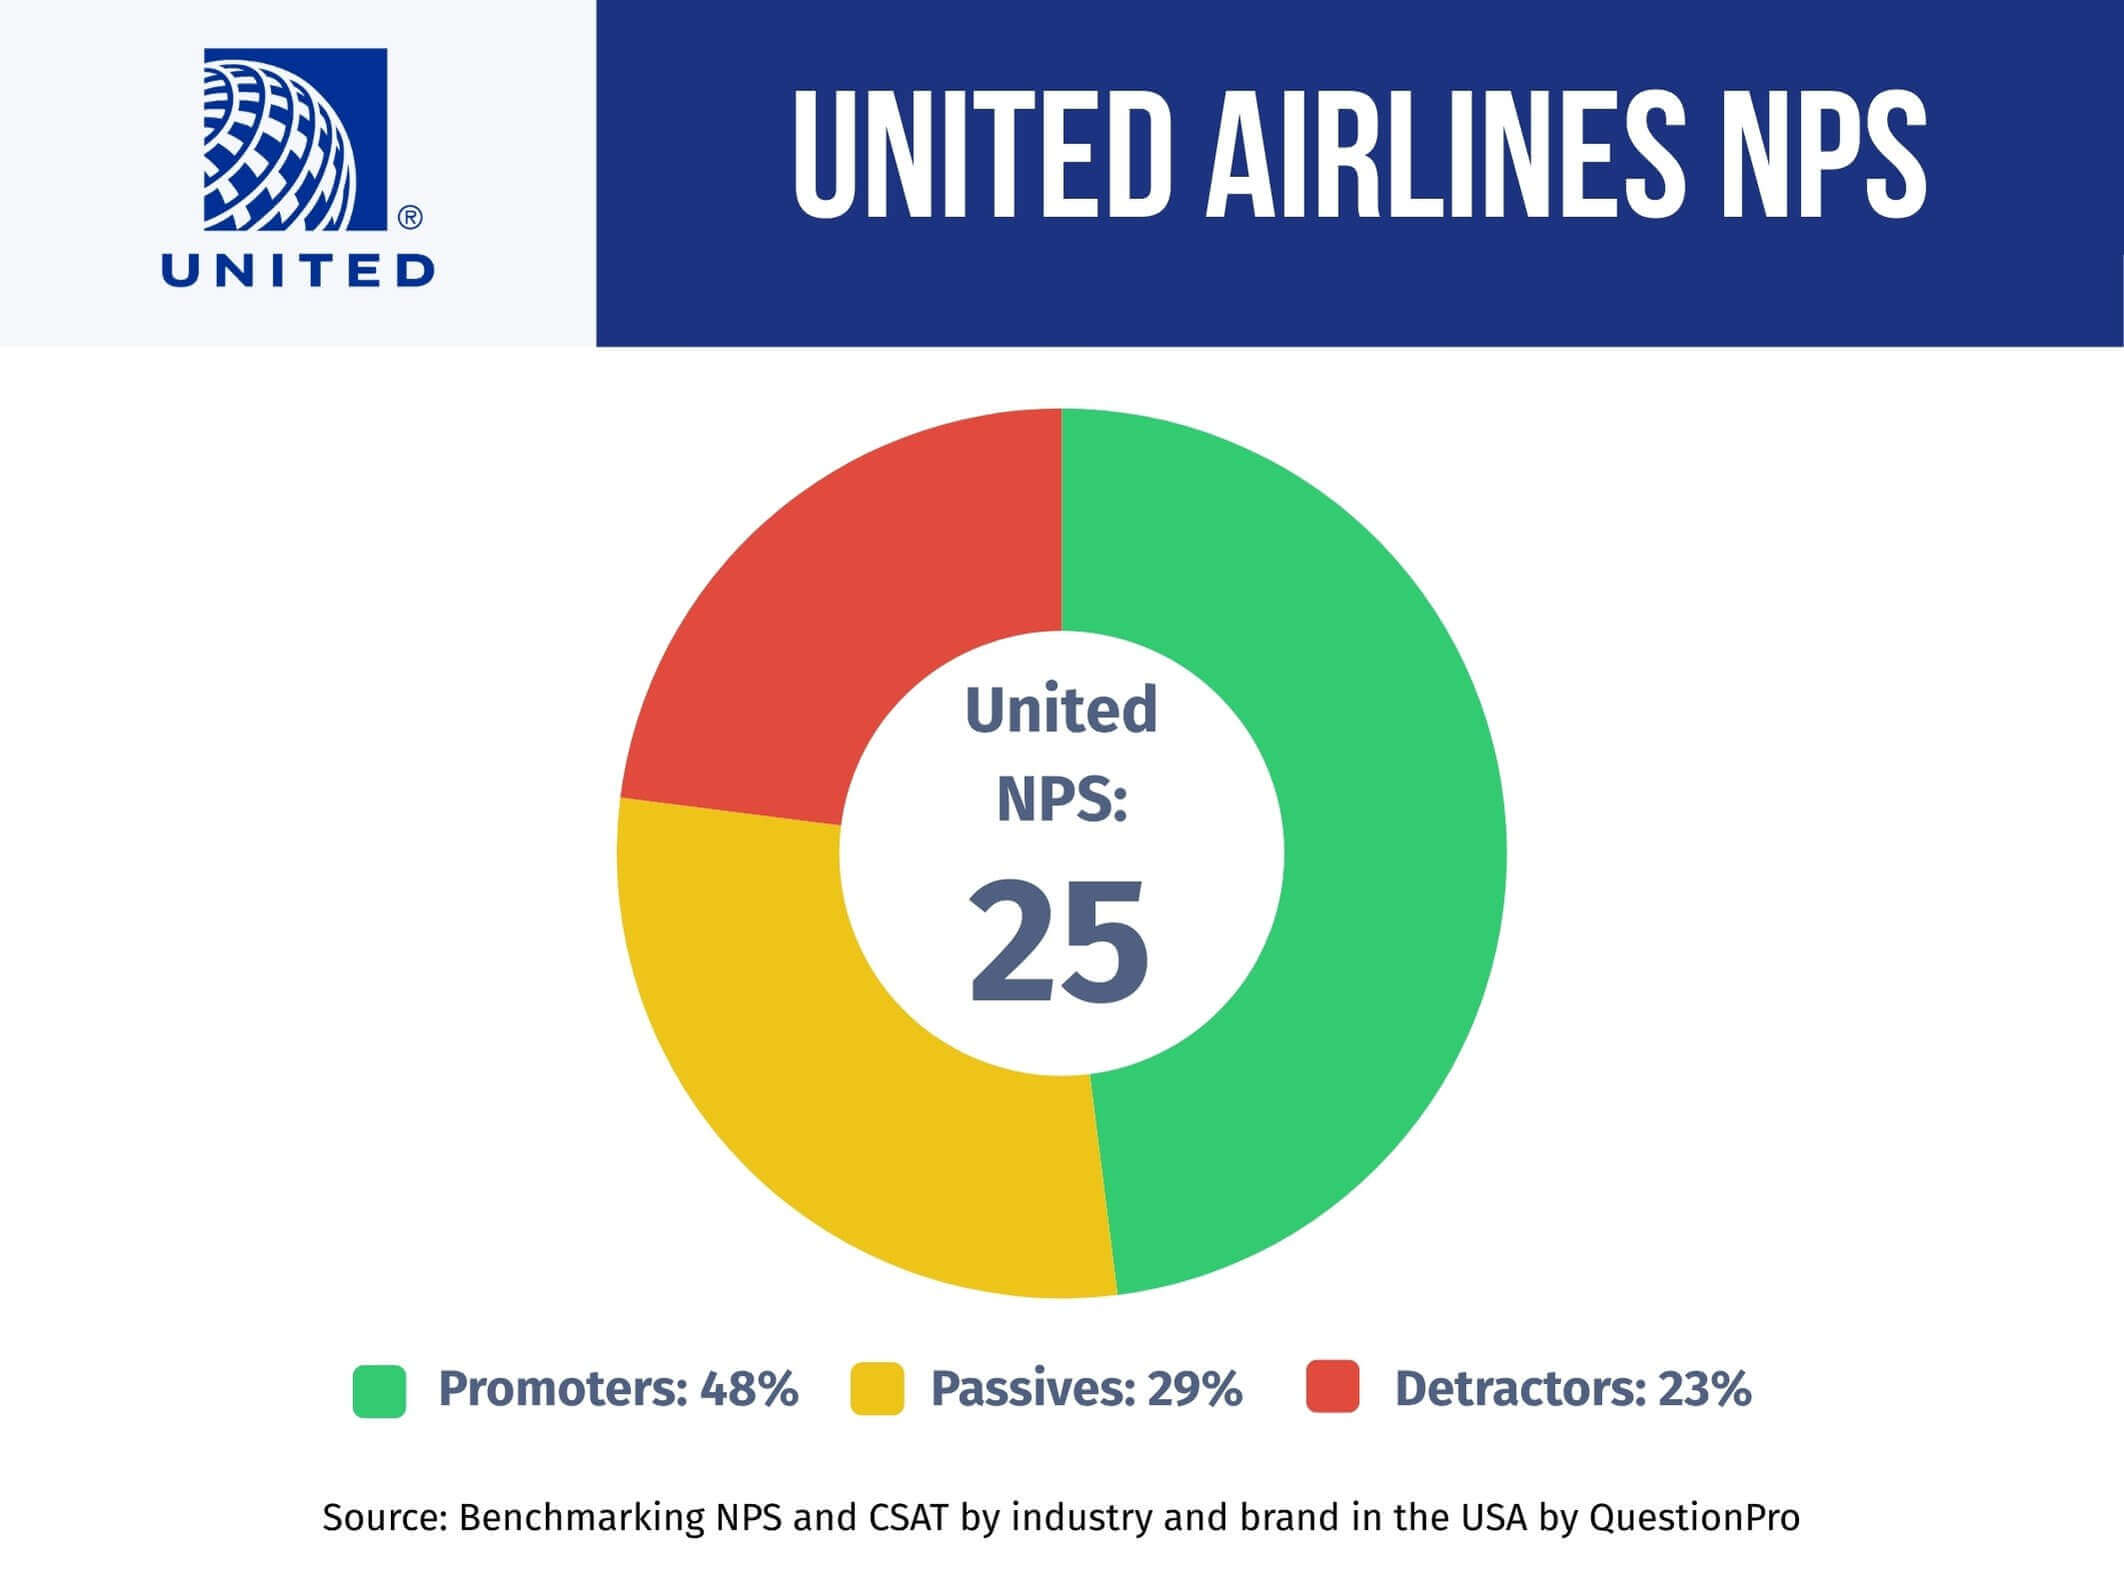
United Airlines’ Net Promoter Score for 2025 is 25. The figure comes from QuestionPro’s Q1 2025 Benchmarking NPS and CSAT Report, which surveyed 1,000 U.S. airline passengers.
A score of 25 is positive, since more passengers promote United than criticize it. It still sits eight points below the airline industry average of 33, a gap that points to inconsistent service rather than one isolated failure.
Scores between 0 and 30 are generally read as acceptable, not strong. United lands near the middle of that band, ahead of carriers passengers actively warn others away from, but behind the ones people go out of their way to recommend.
United Airlines NPS breakdown for 2025
The overall score of 25 comes from three passenger groups. Splitting out the percentages shows exactly where United keeps loyalty and where it leaks it.
| Passenger group | NPS scale | Share of respondents | What it signals |
|---|---|---|---|
| Promoters | 9 to 10 | 48% | Loyal fliers who would recommend United to others |
| Passives | 7 to 8 | 29% | Satisfied but easily won over by a competitor |
| Detractors | 0 to 6 | 23% | Unhappy fliers likely to discourage others from booking |
Almost half of United’s passengers are Promoters, which is a real foundation to build on. But nearly one in four are Detractors, and that share is large enough to drag the overall score down even with a healthy Promoter base.
What is Net Promoter Score, and how is it different from CSAT?
Net Promoter Score (NPS) is a one-question loyalty metric based on how likely a customer is to recommend a company, rated from 0 to 10. QuestionPro’s Net Promoter Score resource breaks down the methodology in full.
The formula is simple:
NPS = % Promoters − % Detractors
Customer Satisfaction Score (CSAT) is a different metric, even though the two get confused often. CSAT measures happiness with one specific interaction, like a check-in or a boarding process, while NPS measures loyalty to the brand as a whole. United’s CSAT score sits at 74%, a figure covered in the next section.
For a full side-by-side comparison of NPS and CSAT, QuestionPro’s airline NPS benchmark guide walks through both metrics across five major carriers.
How does United Airlines’ NPS compare to other major airlines?
United’s score does not exist in a vacuum. Placing it next to other major U.S. carriers, all measured in the same Q1 2025 report, shows how wide the loyalty gap really is.
| Airline | 2025 NPS score | vs. industry average (33) |
|---|---|---|
| JetBlue Airways | 50 | +17 |
| Southwest Airlines | 48 | +15 |
| Delta Air Lines | 43 | +10 |
| American Airlines | 30 | -3 |
| United Airlines | 25 | -8 |
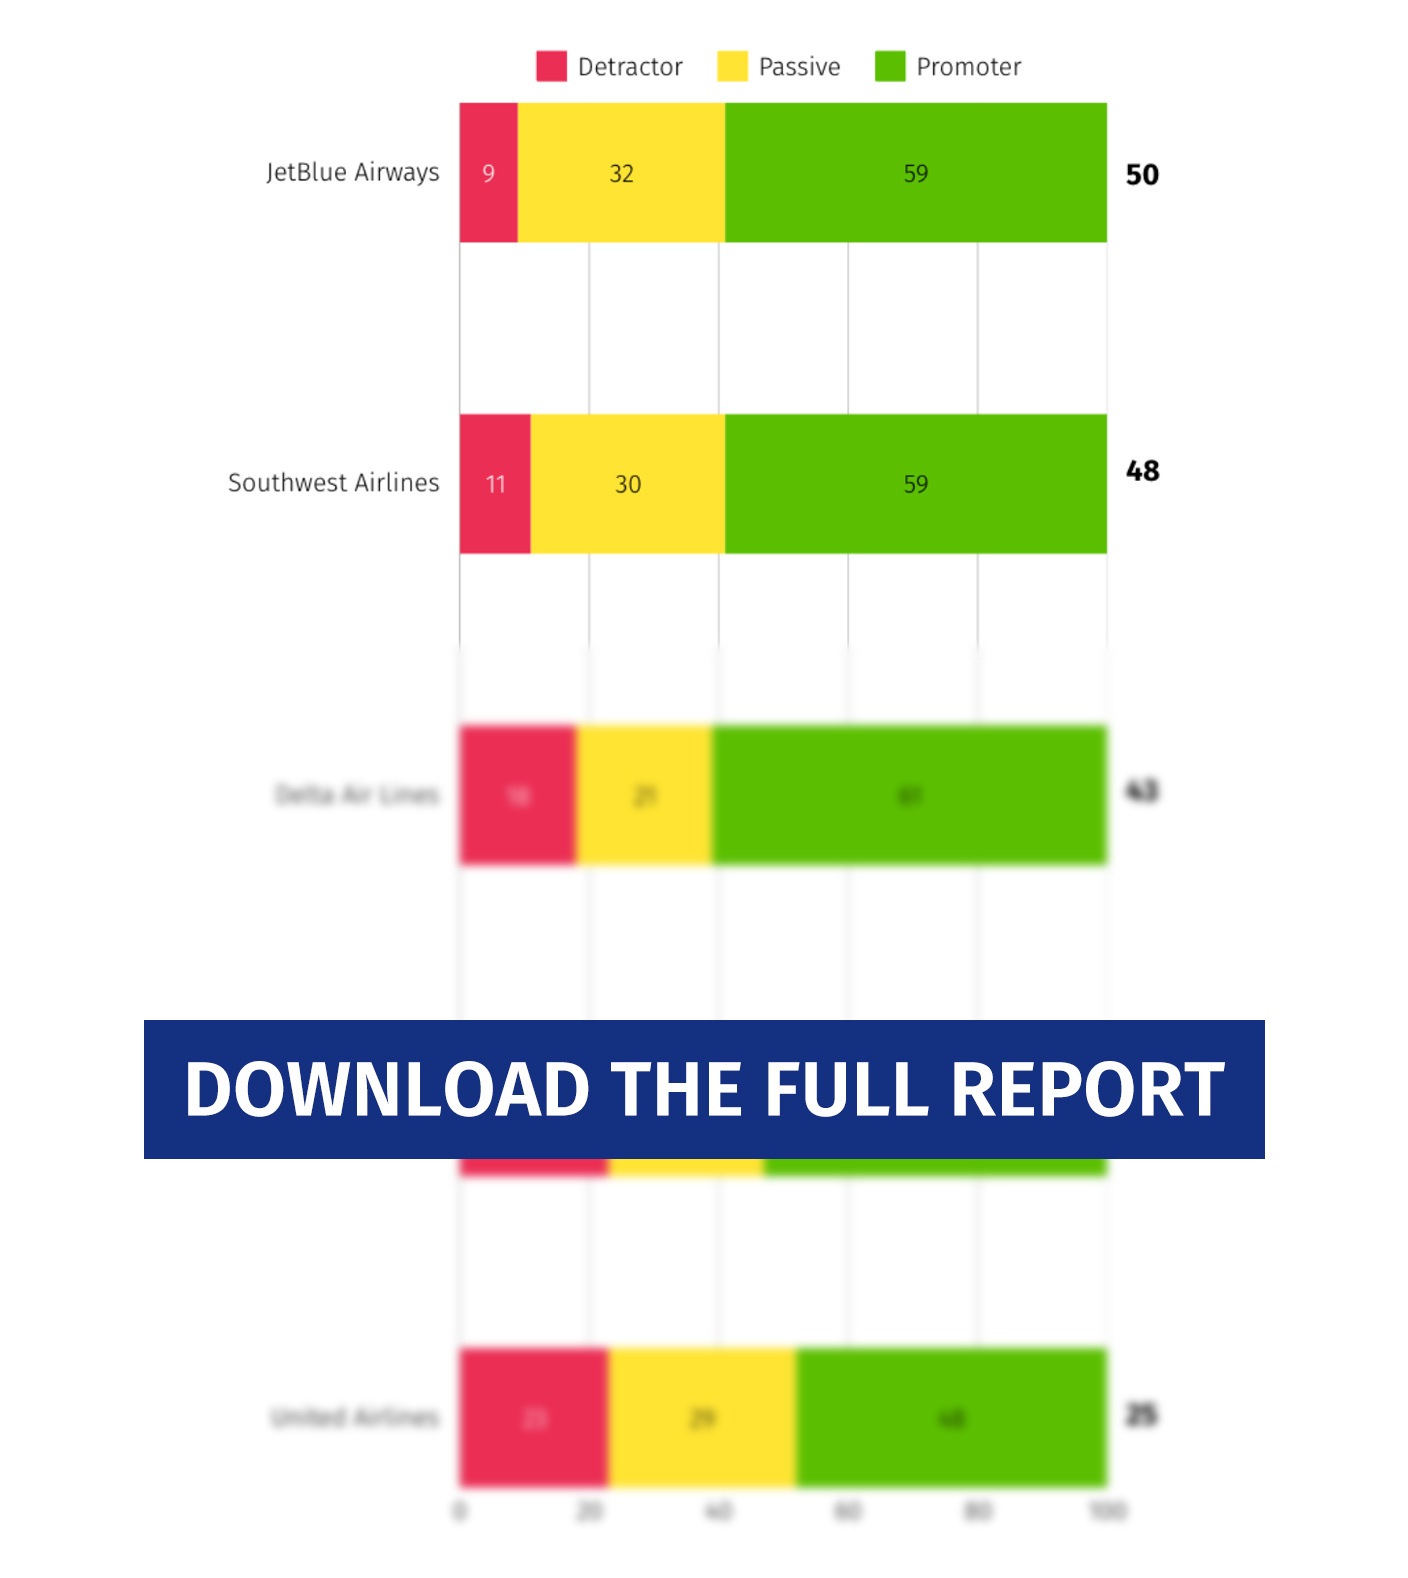
JetBlue’s NPS leads the group by a wide margin, helped by a passenger split of roughly 68% Promoters and only 10% Detractors. United sits at the opposite end of the table, weighed down by a higher Detractor share tied to inconsistent recovery after delays and cancellations.
A broader satisfaction study adds useful context here. The J.D. Power 2025 North America Airline Satisfaction Study found Southwest, JetBlue, Delta, and Alaska Airlines leading customer satisfaction across different cabin segments, and United did not top any category measured. NPS and J.D. Power’s index use different scales, but both point in the same direction for United.
Why is United Airlines’ NPS below the industry average?
Four factors explain most of the gap between United’s score and the airline average. Each one shows up directly in the passenger data behind the 25.
- A thin Promoter margin.
Only 48% of respondents are Promoters, meaning fewer than half of United’s passengers feel strongly enough to recommend it. - A sizable Detractor group.
With 23% of passengers reporting a negative experience, friction points around delays, rebooking, and service recovery are pulling real weight. - Satisfaction without delight.
A CSAT score of 74% shows most passengers are content, but content is not the same as impressed, and only impressed passengers reliably become Promoters. - Soft repeat-travel intent.
When asked about future travel plans, 76% said yes, 15% said maybe, and 9% said no, leaving roughly one in four travelers hesitant to fly United again.
Together, these numbers describe an airline that meets baseline expectations for most flights but rarely exceeds them by enough to turn a passive passenger into a promoter.
Is United Airlines’ NPS improving in 2025?
United’s own reporting suggests the trend is moving in the right direction, even if the Q1 benchmark score still trails the industry. During its fourth-quarter 2025 earnings call, the airline said it hit a company record for Net Promoter Score, including its highest-ever November NPS, despite flight disruptions tied to a federal government shutdown that month, according to United’s Q4 2025 earnings release.
For the full year, United reported its highest NPS since 2022. Part of that gain came from a seven-point improvement in the check-in experience, driven by investment in the mobile app and updated airport kiosks.
That timeline matters for anyone reading the Q1 numbers above. A single quarterly snapshot can miss a carrier that is actively closing the gap, which is exactly why tracking NPS over multiple periods tells a more complete story than one score alone.
How can airlines like United improve their NPS score?
Closing a gap like United’s takes a repeatable process, not a one-time fix. These five steps apply to any airline, or any business, working from a similar starting point.
- Ask the right questions.
Start with the standard 0 to 10 NPS question, then follow with an open-ended “why” question to capture the reasoning behind each score. - Segment the responses.
Break results down by route, cabin class, travel purpose, and loyalty tier. A strong overall number can hide a struggling regional route or a weak economy-cabin experience. - Close the loop with Detractors.
Every Detractor is a chance to recover a relationship. A fast, thoughtful follow-up can turn a frustrated flier into a returning one. - Mobilize Promoters.
Happy passengers are the easiest advocates to activate. A simple nudge toward a review, a referral, or a loyalty program signup goes a long way. - Track the score over time, not just once.
Comparing quarter over quarter, and against industry benchmarks, shows whether changes are actually moving the number.
Platforms like QuestionPro’s Customer Experience software support this process by collecting feedback across booking, in-flight, and post-flight touchpoints in one place. Teams running a single survey can also use the QuestionPro NPS Calculator to turn raw response counts into a score without building a full tracking program first.
What United’s 2025 NPS score means for your own customer experience strategy
United’s story is a reminder that NPS works best as an ongoing signal, not a single headline number. A Q1 score of 25 and a Q4 company record can both be true at the same time, and the difference between them usually comes down to whether a team keeps measuring after the first survey goes out.
The same logic applies outside the airline industry. A business that tracks NPS quarterly, segments the results, and responds to Detractors quickly will usually close a loyalty gap faster than one that checks the number once a year.
Benchmarking against direct competitors, the way this report does across five carriers, is often the fastest way to see whether a score of 25, or any number, actually needs urgent attention.
The Q1 2025 NPS Benchmark Report gives you the complete picture across airlines, retail, grocery, and more. If you’re wondering how you compare or looking for insights to improve customer satisfaction, it’s the perfect place to start.
Or contact the experts at QuestionPro for guidance tailored to your industry.
Frequently Asked Questions (FAQs)
Airline NPS scores above 50 are considered excellent, 30 to 50 is good, and 0 to 30 is acceptable but inconsistent. United’s 2025 score of 25 falls in the acceptable range, just under the industry average of 33.
Airlines typically send NPS surveys shortly after a flight, asking passengers how likely they are to recommend the carrier. United and other major airlines pair this feedback with CSAT and loyalty program data to build a fuller picture of passenger sentiment.
Yes. J.D. Power’s 2025 study found premium economy and business class satisfaction dropped for several airlines that year, while economy passengers grew more satisfied. Route length, delays, and staffing levels also shift NPS results by segment.
Most customer experience teams review NPS quarterly at minimum, layering ongoing post-interaction surveys on top. A single annual score hides seasonal dips, like holiday delays, that a quarterly view would catch early enough to act on.
American Airlines posted an NPS of 30 in the same Q1 2025 benchmark report, five points ahead of United’s 25 but still below the 33 industry average. American Airlines’ full NPS breakdown points to similar detractor challenges tied to delays.
United isn’t the only company in the airline industry with valuable lessons for those looking to improve their customer service and experience. Below, we recommend a few articles where you can learn how other major airlines manage to maintain a high NPS and a loyal customer base — you’ll surely find some useful insights along the way.