Data storytelling is the practice of turning data, research findings, and customer insights into a clear narrative that helps people understand what happened, why it matters, and what to do next.
For UX, CX, and market research businesses, this matters because stakeholders rarely need more raw data. They need a clear explanation of the insight, the evidence behind it, and the action it supports. An insight repository helps by keeping research findings, customer feedback, and supporting evidence organized in one place.
In this article, we’ll explain what data storytelling means, why it matters for insights, and how an insight repository can help turn scattered findings into stories people can act on.
What is data storytelling?
Data storytelling is the process of explaining data through a mix of evidence, narrative, and visuals. It helps people understand the meaning behind the numbers instead of only seeing charts, tables, or survey results.
A good data story answers three questions:
- What happened?
- Why does it matter?
- What should we do next?
For example, saying “customer satisfaction dropped by 12%” is a data point. A data story explains why that drop happened, which customers were affected, what evidence supports the finding, and what action the business should take.
Harvard Business School Online describes data storytelling as communicating insights from data using narratives and visualizations, which matches how research teams often need to present complex findings to non-research audiences.
Why does data storytelling matter for insights?
Data storytelling matters because research findings are easier to understand when they are connected to a clear context. Insights teams often work with survey data, interviews, usability tests, customer feedback, and behavioral data. Without a story, those findings can feel disconnected.
A clear story helps stakeholders understand:
- What the research found
- Why the finding matters
- Who is affected
- What pattern appears across the data
- What decision the insight should support
This is especially useful for UX, CX, and market research companies in the USA, where stakeholders may come from product, marketing, customer success, sales, and leadership. Not every stakeholder reads research the same way. A story helps different teams understand the same insight without needing to interpret raw data on their own.
Data storytelling also helps protect the value of research. If insights are only shared as charts or long reports, important findings may be forgotten. When they are framed as a clear story, they are easier to remember, discuss, and use.
What makes a good data story?
A good data story includes three parts: data, narrative, and visuals. Each part has a different role, and the story is weaker when one of them is missing.
Data
Data is the evidence behind the story. It can include survey results, interview quotes, NPS scores, customer feedback, usability findings, sales data, or product analytics.
The data should be accurate, relevant, and connected to the business question. If the data does not support the story, the story becomes opinion.
Narrative
Narrative is the explanation that connects the findings. It gives the data structure and helps the audience understand the meaning.
A strong narrative does not exaggerate. It explains the pattern clearly and shows why the insight matters.
For example:
“New customers are not leaving because they dislike the product. They are leaving because the setup process delays their first successful outcome.”
That sentence gives the data a clear direction.
Visuals
Visuals make the story easier to understand. These may include charts, dashboards, journey maps, quotes, screenshots, or simple before-and-after comparisons.
A visual should make the message clearer, not more complicated. If a chart needs too much explanation, it may not be the right chart for the story.
What are the advantages of data storytelling?
Data storytelling helps insights teams communicate research in a way that is easier to understand, remember, and use. It turns findings into a message that supports action.
Key advantages include:
- Better understanding: Complex research becomes easier for non-research stakeholders to follow.
- Stronger decision-making: Businesses can see what the data means and what action it supports.
- Higher engagement: A clear story is easier to remember than a list of numbers.
- Better alignment: Product, CX, marketing, and leadership teams can work from the same insight.
- More trust: Evidence-based stories show where the finding came from and why it matters.
- More reuse: A well-structured insight can support future projects, reports, and strategy discussions.
The goal is not to make data sound dramatic. The goal is to make it useful.
How does an insight repository support data storytelling?
An insight repository supports data storytelling by keeping research findings, evidence, and past projects organized in one searchable place. It helps businesses find the right evidence when they need to build a story.
Without a repository, insights often get scattered across slide decks, spreadsheets, shared drives, emails, chat threads, and old reports. That makes it harder to connect patterns across projects.
An insight repository can help businesses:
- Find past research quickly
- Compare findings across studies
- Group insights by theme
- Add customer quotes as supporting evidence
- Connect qualitative and quantitative findings
- Avoid repeating research that already exists
- Share insights with stakeholders in a cleaner format
QuestionPro’s InsightsHub is positioned as an organized research repository for storing research data and turning insights into knowledge. Its repository help documentation also describes the platform as a centralized place for organizational research assets, which can reduce the need to search through emails and shared drives.
How do you use an insight repository for data storytelling?
You can use an insight repository for data storytelling by starting with a business question, pulling relevant evidence, grouping findings into themes, and turning those themes into a clear narrative.
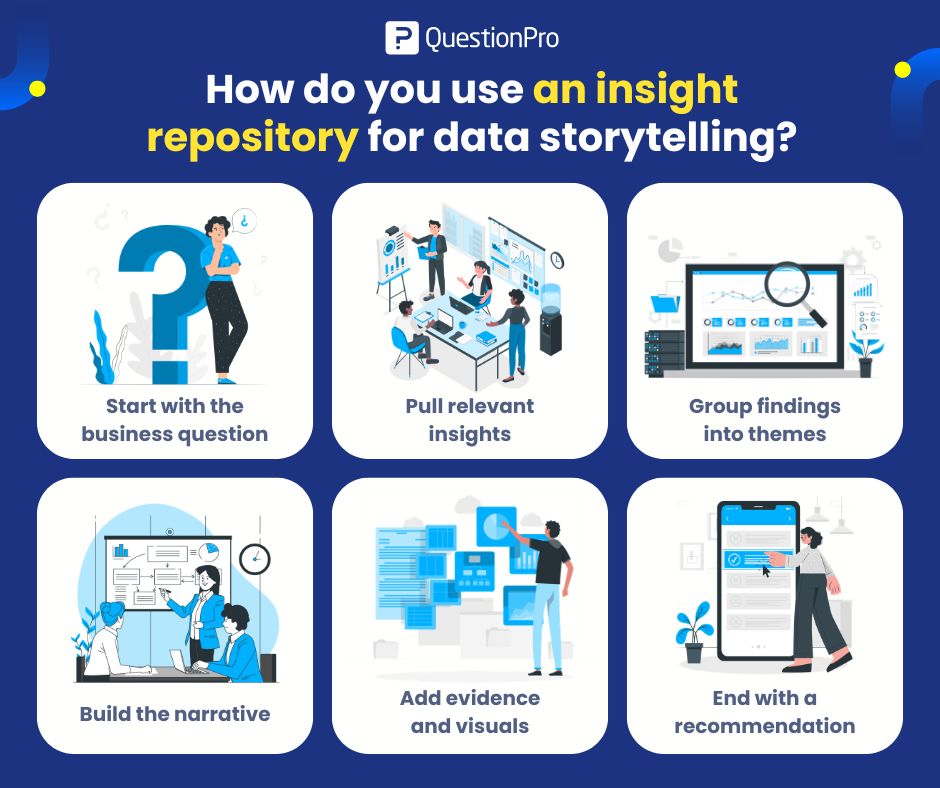
Start with the business question
Begin with the decision the story needs to support.
Examples:
- Why are new users not completing onboarding?
- What is causing customer frustration after purchase?
- Which product features matter most to enterprise buyers?
- Why did satisfaction scores drop this quarter?
A clear question prevents the story from becoming a general research summary.
Pull relevant insights
Search the repository for related studies, survey results, interview notes, support themes, dashboards, and previous reports.
The goal is to collect evidence that connects to the question, not to include every available data point.
Group findings into themes
Look for patterns across the evidence.
For example, onboarding feedback may include several comments about unclear setup instructions, missing training, and confusing next steps. These can be grouped under one theme: “users need clearer guidance before they reach value.”
Build the narrative
Turn the themes into a story with a beginning, middle, and end.
A simple structure works well:
- Context: What problem are we looking at?
- Evidence: What did the data show?
- Meaning: Why does it matter?
- Action: What should the business do next?
This structure keeps the story focused and easy to present.
Add evidence and visuals
Use charts, customer quotes, survey results, or dashboard screenshots to support the narrative.
For example, a chart may show that onboarding completion dropped. A customer quote may explain why users got stuck. Together, they make the story stronger.
End with a recommendation
A data story should end with a clear recommendation. Stakeholders should not have to guess what the insight means.
A useful recommendation might be:
“Reduce onboarding steps from six to three and test whether more users reach their first successful action within seven days.”
What is a simple data storytelling example?
A simple data storytelling example is a CX team using feedback and survey data to explain why new customers are not completing onboarding.
The raw data may show:
- Onboarding completion dropped by 18%.
- Support tickets about setup increased.
- New customers used words like “confusing,” “too many steps,” and “not sure what to do next.”
- Users who completed onboarding were more likely to become active customers.
A weak report would list these findings separately.
A stronger data story would say:
“New customers understand the product’s value, but the setup process slows them down before they reach their first successful outcome. The clearest fix is to simplify onboarding instructions and guide users to one key action first.”
This story gives stakeholders the context, the evidence, the meaning, and the next step.
How can QuestionPro help with data storytelling?
QuestionPro can help with data storytelling by supporting the collection, organization, and sharing of research insights. For businesses working across UX, CX, and market research, this can make it easier to connect feedback with business decisions.
Businesses can use QuestionPro to collect survey data, customer feedback, NPS responses, product experience feedback, and market research findings. With an insights repository such as QuestionPro InsightsHub, businesses can organize those findings, identify patterns, and reuse evidence across reports and presentations.
This helps insights teams move from scattered findings to clearer stories. Instead of presenting disconnected survey results, businesses can connect themes, quotes, dashboards, and recommendations in one place.
Final thoughts on data storytelling
Data storytelling helps research and insights teams explain what the data means, not just what the data says. It turns findings into a clear message that stakeholders can understand, remember, and use.
An insight repository strengthens that process by keeping evidence organized and reusable. When teams can quickly find past research, connect patterns, and support claims with evidence, they can tell stronger stories and make insights easier to act on.
Frequently Asked Questions
Data storytelling means using data, visuals, and narrative to explain an insight clearly. Instead of only showing numbers, it helps people understand what happened, why it matters, and what action should come next.
Data storytelling is important in research because stakeholders may not have time to interpret raw findings. A clear story connects research data to context, business impact, and recommendations, making insights easier to understand and use.
An insight repository stores research findings, customer feedback, reports, and supporting evidence in one place. It helps businesses find patterns across projects and build stronger data stories using existing research instead of starting from scratch.
An effective data story has accurate evidence, a clear narrative, and simple visuals. It should answer what happened, why it matters, and what the audience should do next without overwhelming them with unnecessary data.
US insights teams can use data storytelling better by starting with a business question, organizing evidence by theme, adding customer quotes or visuals, and ending with a practical recommendation that product, CX, or marketing teams can act on.