Customer experience teams have more data than ever before. They track Net Promoter Score (NPS), measure customer satisfaction (CSAT), analyze feedback, and monitor performance across multiple channels. Yet, despite all this information, one critical challenge remains: turning customer experience metrics into a clear understanding of where the experience needs to improve.
A dashboard might reveal that customer satisfaction has declined. Customer feedback might highlight frustration with a recent interaction. A journey map might outline every step a customer takes, from discovery to purchase and beyond.
But when these insights live in separate places, connecting the numbers to the experiences behind them becomes an additional task.
What if your CX dashboard and customer journey map worked together?
What if the metrics you rely on could sit alongside the customer journey they help you understand?
This is where connecting customer experience analytics with journey mapping can change how teams analyze, discuss, and improve customer experiences.
The Problem: Customer Experience Data Without Context
Most organizations have invested in collecting customer feedback and measuring experience performance. They know how customers rate their experiences, where satisfaction is changing, and which feedback themes appear repeatedly.
However, a metric rarely tells the whole story on its own.
Consider an e-commerce business experiencing a decline in customer satisfaction.
Its CX dashboard reveals the decline, but the team still needs to investigate what is happening across the customer journey. Is the issue related to product discovery? Is checkout becoming more complicated? Are delivery expectations not being met? Is the returns process creating frustration?
The metric signals a problem, but the team needs additional context to investigate it.
This is the gap between knowing what is happening and understanding where to look for answers.
Without a connected view, CX teams may need to switch between dashboards, customer feedback reports, and journey maps to build a more complete picture. That process can make analysis more fragmented and stakeholder discussions less focused.
The challenge isn’t necessarily a lack of data. It’s the difficulty of bringing the right information together when teams need it.
Dashboards Show Performance. Journey Maps Provide Context.
Customer experience dashboards and journey maps serve different, complementary purposes.
CX Dashboards: Understanding What Is Happening
CX dashboards help teams monitor customer experience performance through metrics and visualizations.
Depending on the dashboard configuration, these may include:
- Net Promoter Score (NPS)
- Customer Satisfaction (CSAT)
- Customer feedback trends
- Experience performance indicators
- Other relevant customer experience metrics
Dashboards help teams identify changes, monitor performance, and recognize areas that may require further investigation.
But a metric viewed in isolation may not explain how it relates to the broader customer experience.
Customer Journey Maps: Understanding the Experience
Customer journey maps help teams visualize the stages, interactions, and touchpoints that make up a customer’s experience.
They provide a structured view of how customers move through an experience, from initial discovery to purchase, service, and retention.
Journey maps help teams understand the sequence of interactions and the context in which customer needs, expectations, and pain points emerge.
However, a journey map may not always display the relevant performance metrics alongside those interactions.
The Opportunity: Bring Both Views Together
When dashboards and journey maps are connected, teams can review customer experience performance alongside the journey itself.
Instead of treating metrics and journey stages as separate sources of information, they can bring the two views together to support a more contextual analysis.
CX Dashboards show the numbers. Journey Maps show the experience. Together, they provide a more connected view of customer experience performance.

What Changes When Metrics Meet the Customer Journey?
Imagine a customer experience team reviewing the online shopping journey of an e-commerce business.
The team notices that customer satisfaction has declined and wants to investigate further.
With disconnected tools, team members might open the CX dashboard, review satisfaction trends, switch to the journey map, examine the checkout process, and return to the dashboard to revisit the relevant metrics.
Each tool provides useful information, but connecting the two requires additional navigation and effort.
Now imagine the relevant CX dashboard visualization is available directly within the Journey Map’s Metrics lane.
The team can review the checkout journey and the associated visualization in the same context. This makes it easier to discuss the relationship between the customer experience and the performance indicator, formulate questions, and determine what to investigate next.
The embedded visualization does not automatically explain why satisfaction declined. Instead, it gives the team relevant performance information within the context of the journey, helping them conduct a more focused investigation.
This approach can support several important CX activities.
1. Identify Where to Investigate
When a metric indicates a potential issue, teams can review it alongside the relevant journey stage and determine where additional analysis is needed.
2. Make Journey Reviews More Data-Informed
Journey maps can be supported by relevant performance visualizations, helping stakeholders consider quantitative evidence alongside the journey they are reviewing.
3. Improve Cross-Functional Discussions
CX, product, operations, and service teams can discuss journey stages and relevant metrics in a shared context, making it easier to align on questions and potential improvement areas.
4. Reuse Existing Analytics
Teams can bring existing dashboard visualizations into their journey maps rather than recreating those visualizations specifically for journey reviews.
The result is a more connected workflow for understanding customer experiences and identifying opportunities for improvement.
Introducing QuestionPro Universal Widgets: Bringing CX Metrics Into Journey Maps
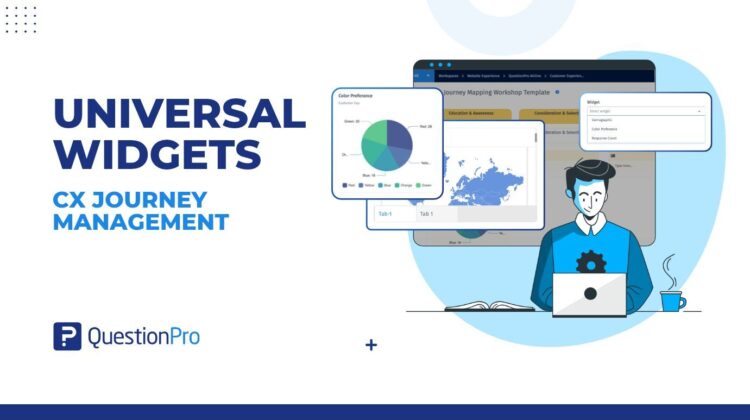
QuestionPro Universal Widgets helps bridge the gap between CX analytics and journey mapping by allowing users to embed existing CX Dashboard widgets directly into Journey Maps.
Through the Metrics lane in QuestionPro Journey Management, users can select a dashboard, choose a widget, configure a date range, and add the visualization to their Journey Map.
This brings relevant dashboard information into the journey mapping environment, allowing teams to review metrics alongside the customer experience they are analyzing.
How It Works
Step 1: Open Your Journey Map
Navigate to the Journey Map where you want to incorporate relevant customer experience metrics.
Step 2: Access the Metrics Lane
Add or open the Metrics lane, where dashboard visualizations can be included.
Step 3: Select a CX Dashboard
Choose the existing CX Dashboard containing the visualization you want to use. The dashboard must be available in the same workspace as the Journey Map.
Step 4: Choose a Widget
Select the specific dashboard widget that is relevant to the journey being reviewed.
Step 5: Configure the Date Range
Set the date range for the visualization to display the reporting period you want to examine.
Step 6: Add the Widget
Add the selected widget to the Metrics lane. The visualization is embedded within the Journey Map, bringing the selected dashboard view into the journey mapping experience.
By reusing existing CX Dashboard visualizations, Universal Widgets helps teams bring relevant metrics into their journey mapping workflow without needing to recreate the same visualizations.
Real-World Applications: Connecting Metrics to Customer Experiences
The value of connecting CX dashboards with journey maps becomes clearer when applied to real business scenarios.
E-commerce: Understanding the Online Shopping Experience
An online retailer monitors customer satisfaction and notices a decline during a particular reporting period.
By placing a relevant dashboard visualization alongside its purchase journey, the team can review performance in the context of product discovery, checkout, payment, and order confirmation.
This helps the team focus its investigation on the relevant interactions and determine what additional customer feedback or operational data it needs to examine.
Banking: Reviewing the Account Opening Journey
A bank wants to understand customer experience across its account opening process.
Relevant dashboard metrics can be embedded in the journey map to help the team review performance alongside application submission, identity verification, approval, and onboarding stages.
This provides a shared view for discussing potential friction points and prioritizing further investigation.
SaaS: Improving Customer Onboarding
A software company wants to review the onboarding experience for new customers.
The team can incorporate relevant CX dashboard visualizations into its onboarding journey map and examine them alongside account setup, product configuration, and initial product usage stages.
This can help stakeholders identify areas that warrant closer analysis and coordinate follow-up research or improvement initiatives.
Customer Support: Reviewing Service Experiences
A service organization wants to understand customer experience across support interactions.
By bringing relevant dashboard visualizations into its support journey map, the team can review metrics alongside case submission, troubleshooting, resolution, and follow-up.
This creates a more contextual starting point for discussions about service performance and possible experience improvements.
Across these scenarios, the principle is the same: make relevant customer experience metrics available where teams are already examining the customer journey.
From Measuring Customer Experience to Understanding It in Context
Connecting dashboards and journey maps is more than a convenience. It represents a practical step toward making customer experience analysis more integrated.
When metrics are reviewed alongside journey stages, teams have a shared context for discussing performance and investigating potential problems.
This can help organizations:
- Make insights easier to interpret: Review relevant performance visualizations alongside the customer journey.
- Reduce unnecessary context switching: Bring selected dashboard widgets into the journey mapping environment.
- Support better-informed decisions: Use quantitative metrics as additional context when reviewing customer experiences.
- Improve collaboration: Give stakeholders a common view of journey stages and relevant performance indicators.
- Focus improvement efforts: Use the combined view to identify questions, prioritize further investigation, and discuss possible actions.
It is important to remember that embedding a metric does not automatically establish the cause of a customer experience problem. Teams still need customer feedback, operational evidence, and appropriate analysis to validate root causes and determine the right improvements.
Universal Widgets helps make that investigation more connected by bringing existing CX dashboard visualizations into the journey mapping workflow.
The Future of Customer Experience Is Connected
Customer experience improvement requires more than collecting feedback or monitoring performance indicators. It requires understanding how customer experiences unfold and using evidence to determine where improvements are needed.
Dashboards and journey maps each contribute an important perspective. Dashboards help teams monitor performance. Journey maps help them understand the customer experience across stages and touchpoints.
When these perspectives remain separate, teams must do additional work to connect the information. When they come together, the path from identifying a performance issue to investigating the relevant customer experience becomes more direct.
With QuestionPro Universal Widgets, organizations can embed existing CX Dashboard visualizations into Journey Maps, helping teams review customer experience metrics in the context of the journeys they manage.
Because better customer experiences begin with better understanding, bringing data and journey context together is a meaningful step toward more informed CX decisions.
Your dashboard tells you what is happening. Your journey map shows you where to look. Bring them together with QuestionPro Universal Widgets.
Ready to Connect Your CX Metrics With Your Customer Journeys?
Explore QuestionPro Universal Widgets to learn how to embed existing CX Dashboard visualizations directly into your Journey Maps and bring customer experience performance into context.