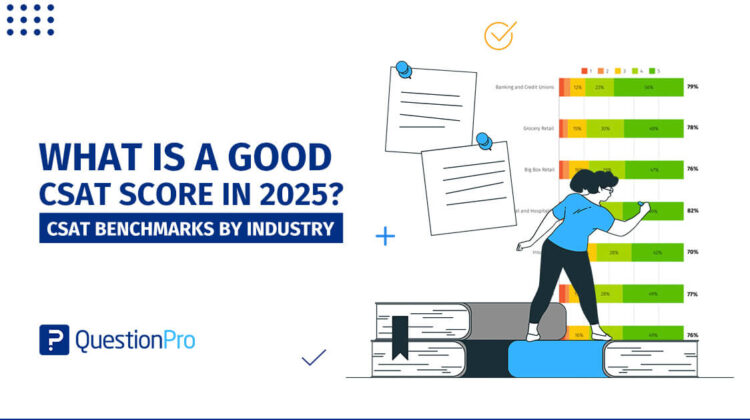
A Customer Satisfaction score means almost nothing on its own. You need real context to know if you are actually winning. That is exactly what CSAT benchmarks by industry provide. They reveal the average satisfaction scores for your specific sector. This context turns a random number into a clear business decision.
The wrong comparison can easily send you chasing the wrong fix entirely.
In this blog, we break down CSAT benchmarks by industry for 2025. We also cover the formula behind the score and how to tell whether your number is genuinely good, or just average dressed up.
What is a CSAT benchmark?
A CSAT benchmark is the average customer satisfaction score for a specific industry, used as a reference point for judging your own score. Customers rate a single interaction, usually on a 1-5 scale, and a benchmark tells you where that rating typically lands for companies like yours. Without one, a score of 78% is just a number. With one, you know whether 78% puts you ahead of most banks or behind most airlines.
The same raw score can mean very different things depending on what industry generated it. A telecom provider scoring 78% might be leading its category, while a hospitality brand at the same score would be lagging behind most competitors. That gap is exactly why pairing your own CSAT tracking with an outside reference point matters. Watching your own trend line in isolation only tells half the story.
Benchmarks come from two main sources. National indexes, like the American Customer Satisfaction Index (ACSI), track hundreds of public companies through independent surveys. Proprietary studies, run by CX platforms surveying a defined consumer panel, offer a second angle. Both are useful, but they answer slightly different questions, which is why segment-matching matters so much later in this guide.
CSAT benchmarks by industry in 2025
Here are the results from our Q1 2025 CX Benchmarking Study, based on 1,000 active U.S. consumers rating their most recent experience with a company in each sector.
| Industry | CSAT Score (%) | YoY Change |
|---|---|---|
| Hotel and Hospitality | 84 | +2 |
| Banking and Financial Services | 81 | +2 |
| Grocery Retail | 79 | +1 |
| Airlines | 79 | +3 |
| Big Box and General Merchandise Retail | 78 | +2 |
| Automotive | 77 | +1 |
| Insurance | 72 | +2 |
Hospitality holds the top spot, and airlines posted the sharpest year-over-year gain of any sector we tracked. That mirrors a wider pattern seen elsewhere in 2025. Airlines rose 3 percent to their highest ACSI reading in years. Much of that gain came from better in-flight technology. Insurance remains the lowest scorer for the third year running, weighed down by claims complexity and inconsistent digital self-service.
Individual brands often move the average more than the sector trend does. Delta became the top-rated U.S. airline for satisfaction this year after upgrades to in-flight Wi-Fi and flight-status tools, while Regions Bank has consistently led traditional banks on service quality. Both are useful reminders that an industry benchmark is a floor, not a ceiling. See how the banking industry’s loyalty scores compare, since satisfaction and loyalty rarely move in lockstep.
How is CSAT measured?
CSAT is measured by asking customers a single question right after an interaction, then converting their rating into a percentage. The standard question is direct. It simply asks how satisfied the customer was with the product, service, or specific interaction they just had.
Customers answer on a 1-5 scale, which gets classified into three groups.
- 1-2: Unsatisfied
- 3: Neutral
- 4-5: Satisfied
The score itself uses this formula.
CSAT Score = (Number of satisfied responses divided by total responses) x 100.
A company that collects 500 responses and gets 390 fours or fives has a CSAT of 78 percent. Scales can vary. Some teams use 1-7 or 1-10 instead of 1-5, so always confirm what scale a benchmark used before comparing it to your own. For a deeper look at scale choice, see this breakdown of customer satisfaction rating scales.
What’s the difference between CSAT, NPS, and CES?
CSAT, NPS, and CES get confused constantly because all three sound like they measure happiness. They don’t measure the same thing, and mixing them up leads to the wrong fix.
| Metric | What it measures | Typical scale | Best used for |
|---|---|---|---|
| CSAT | Satisfaction with one specific interaction | 1-5 | Support tickets, purchases, onboarding steps |
| NPS | Overall loyalty and likelihood to recommend | 0-10 | Relationship health, brand advocacy |
| CES | How much effort a customer spent to get something done | 1-5 or 1-7 | Support and self-service friction |
A customer can give a company a 5 on CSAT for one resolved support call and still give a low NPS. That’s because the two questions ask about entirely different things: one moment versus the whole relationship. This full comparison of CSAT, NPS, and CES walks through when to use each one.
Why track industry CSAT benchmarks instead of just your own score?
Tracking only your own score over time tells you if you’re improving, but it can’t tell you if you’re improving fast enough. Say your CSAT is 76 percent and it climbed 2 points this year. That looks like progress. Then you learn the industry average moved 3 points in the same period, which means you actually lost ground on a relative basis.
Insurance is a clear example of why this matters. The sector’s average sits around 72 percent, well below most other categories, but that doesn’t mean every insurer struggles equally. Life insurance carriers tend to outperform health and auto insurers, largely because their customer interactions happen less often and carry less stress. Auto insurers, by contrast, mostly meet customers during a claim, which is rarely a pleasant moment regardless of how well the claim gets handled. If you’re in that sector, comparing yourself only to the flat average hides which peer group you should actually be chasing. This breakdown of insurance NPS benchmarks shows the same segmentation problem in loyalty data too.
How do you choose the right CSAT benchmark for your business?
Not every published benchmark applies to you, even within the same industry label. Match the comparison before you trust the number.
- Match the scale. A benchmark built on a 1-10 scale isn’t directly comparable to your 1-5 data without converting it first.
- Match the segment. Grocery retail benchmarks blend supermarkets, discount grocers, and specialty stores, which perform very differently. Check the grocery industry’s loyalty benchmarks for a sense of how much segment spread can exist inside one label.
- Match the channel. A benchmark drawn mostly from phone support won’t reflect a chat-heavy support model.
- Match the sample size. A benchmark from 200,000 annual interviews carries more weight than one from 200 responses.
- Match the timeframe. CSAT shifts with the economy and with seasonal demand, so a benchmark from two years ago may already be stale.
Skipping any one of these checks causes real problems. It’s how a company ends up celebrating a “good” score that was never actually comparable to its own business.
What common mistakes weaken CSAT benchmarking?
Most CSAT benchmarking mistakes come from comparing numbers that were never meant to be compared.
- Treating a 1-10 scale score as if it were a 1-5 scale score without converting it first.
- Comparing a single quarter’s data to a full-year industry average, which smooths out seasonal swings.
- Benchmarking against the broad industry label instead of the actual competitive set.
- Running the survey inconsistently, so response volume swings too much to trust quarter-over-quarter changes.
- Ignoring response bias from surveying only customers who just had a resolved, positive interaction.
Automotive is a useful case study here. The sector’s overall average looks steady year over year, but mass-market and luxury brands post very different numbers underneath that average. Dealership service satisfaction often diverges sharply from new-vehicle purchase satisfaction. A company that only tracks the purchase moment misses where most of the actual complaints originate. This automotive industry loyalty data breaks that split out in more detail.
How can you improve your CSAT score?
Benchmarking tells you where you stand. These four areas are where most companies actually close the gap.
Strengthen frontline customer support
Slow or inconsistent support is the fastest way to lose satisfaction points, regardless of industry. Make sure customers can reach a real answer through the channel they actually prefer, whether that’s chat, phone, or email. Track resolution time just as closely as the CSAT score itself.
- Set a maximum first-response time per channel and hold teams to it.
- Route complex issues to specialists instead of forcing multiple transfers.
- Follow up with unsatisfied respondents within 48 hours.
Fix the product or service gaps customers actually mention
CSAT surveys work best when paired with an open-text follow-up question. The rating tells you there’s a problem; the comment tells you what it is. Read the recurring themes in low-score responses before funding a broader product roadmap change. Teams that skip this step often invest in the wrong fix.
Personalize interactions instead of running scripts
Customers reward brands that treat them like a known account rather than a ticket number. This works especially well in industries like banking and insurance, where trust and history matter more than speed alone.
- Surface a customer’s last three interactions to the agent before the call starts.
- Skip scripted greetings for repeat customers who already gave their account details.
- Adjust tone and recommendations based on tenure, not just purchase history.
Monitor scores continuously, not once a year
An annual CSAT check reveals almost nothing about whether a change actually worked. Set up rolling measurement so every touchpoint feeds the same dashboard, and review shifts monthly rather than waiting for an annual report. That cadence turns a benchmark from a scorecard into an early warning system.
How QuestionPro Customer Experience helps you close the CSAT gap
QuestionPro Customer Experience gives you a way to act on a benchmark instead of just reading one. A benchmark only becomes useful once someone actually follows up with the customer who gave a 2. That follow-up loop is where most CSAT programs quietly fall apart.
- Build CSAT surveys with channel-specific targeting instead of one generic question for every touchpoint.
- Segment results by customer group, product line, or region to compare against the right peer set, not the topline average.
- Route low scores into a closed-loop follow-up workflow automatically, so no dissatisfied response sits unanswered.
See the platform’s CSAT measurement tools for how the segmentation and follow-up workflows connect.
What your CSAT benchmark should actually change
A CSAT benchmark is only valuable if it changes a decision. If your score beats the industry average, treat that as a floor to defend, not a reason to stop measuring. If it lags, the benchmark should point toward the specific driver behind the gap. That might be support speed, product fit, or personalization. The number itself is just a starting point for that conversation.
Frequently Asked Questions (FAQs)
Most industries consider 75% to 85% a healthy range, with anything above 85% considered strong. Context matters more than the number itself: 75% is solid for insurance but weak for hospitality, so always check your specific sector average first.
Not necessarily. Some industries, like insurance and telecom, run structurally lower because interactions tend to involve claims, billing disputes, or complex service issues. A below-70% score there may still represent strong performance relative to close competitors.
Quarterly works best for most consumer-facing industries, since satisfaction shifts with pricing changes, seasonal demand, and support staffing levels. Annual benchmarking suits slower-moving B2B sectors but risks missing shorter-term dips that quarterly tracking would catch instead.
Yes. NPS reflects overall loyalty built over a relationship, while CSAT reflects one interaction. A customer can love a brand generally while rating a single frustrating support call poorly. That’s exactly why tracking both metrics together gives a fuller picture.
Live chat tends to generate the highest average CSAT of any support channel, followed by phone, email, and then social media. Faster, more personal channels consistently outperform slower or more impersonal ones across nearly every industry studied.
A narrower peer group almost always gives a more honest comparison. Broad industry averages blend companies with very different business models. Comparing a score against direct competitors in the same segment and region produces a far more actionable benchmark than the topline number alone.