
A Likert scale question asks respondents to rate their agreement, satisfaction, or frequency along a fixed range, like “Strongly Disagree” to “Strongly Agree.” Finding the best Likert scale examples is the tricky part. You need the exact point count and phrasing for your specific question.
Likert scale is named after psychologist Rensis Likert. It remains one of the most reliable ways to turn an opinion into usable data. A poorly designed question ruins your entire survey. The wrong scale confuses respondents and skews your results.
In this blog, we’ll break down 10 real Likert scale examples. We will also explore how to choose the right structure and analyze the responses.
What is a Likert scale?
A Likert scale is a survey question format that measures attitudes or opinions using ordered response options between two opposite poles. Common poles include “strongly disagree” and “strongly agree.”
Respondents pick the option that best matches how they feel, rather than answering yes or no. That range makes it possible to measure several distinct things.
- Agreement, such as reaction to a statement or policy
- Satisfaction, such as with a product or support interaction
- Frequency, such as how often someone uses a feature
- Likelihood, such as intent to recommend or repurchase
Likert scales can run unipolar, measuring the intensity of one attribute such as likelihood, from not at all likely to extremely likely. They can also run bipolar, measuring between two true opposites, such as disagree to agree. Learn the difference between a unipolar vs bipolar Likert scale to understand when each approach delivers more meaningful survey data.
If you’re looking for more ways to write effective survey questions, explore these Likert scale questions with examples.
Odd vs. Even Likert scales: Which should you use?
The core decision in building a Likert scale is whether to include a neutral midpoint. That choice depends on whether you want respondents to commit to a direction.
An odd-numbered scale (3, 5, or 7 points) includes a center option, usually labeled Neutral or Neither Agree nor Disagree. Genuinely undecided respondents get an honest way to answer instead of guessing. An even-numbered scale (2 or 4 points) removes the midpoint entirely, forcing respondents to lean toward one side. That’s useful when a neutral answer wouldn’t be actionable, like measuring whether a feature is even used at all.
Use an odd scale for most attitude and satisfaction research, where genuine neutrality is common. Use an even scale when you specifically need to avoid respondents defaulting to the easy middle option.
Likert scale examples at a glance
The 10 examples below span both odd and even formats. Use this table to find the right starting point before reading the full breakdown.
| Example | Points | Type | Best for |
|---|---|---|---|
| 3-point agreement | 3 | Odd | Quick pulse checks, short surveys |
| 5-point agreement | 5 | Odd | General attitude and opinion research |
| 7-point agreement | 7 | Odd | Research needing finer distinctions |
| 5-point satisfaction | 5 | Odd | Customer and employee satisfaction |
| 7-point satisfaction | 7 | Odd | Detailed satisfaction benchmarking |
| 2-point agreement | 2 | Even | Simple yes-leaning agreement checks |
| 4-point agreement | 4 | Even | Forcing a directional opinion |
| 4-point satisfaction | 4 | Even | Satisfaction tracking without a neutral escape |
| 4-point frequency | 4 | Even | Measuring how often something happens |
| 4-point likelihood | 4 | Even | Gauging likelihood without a midpoint |
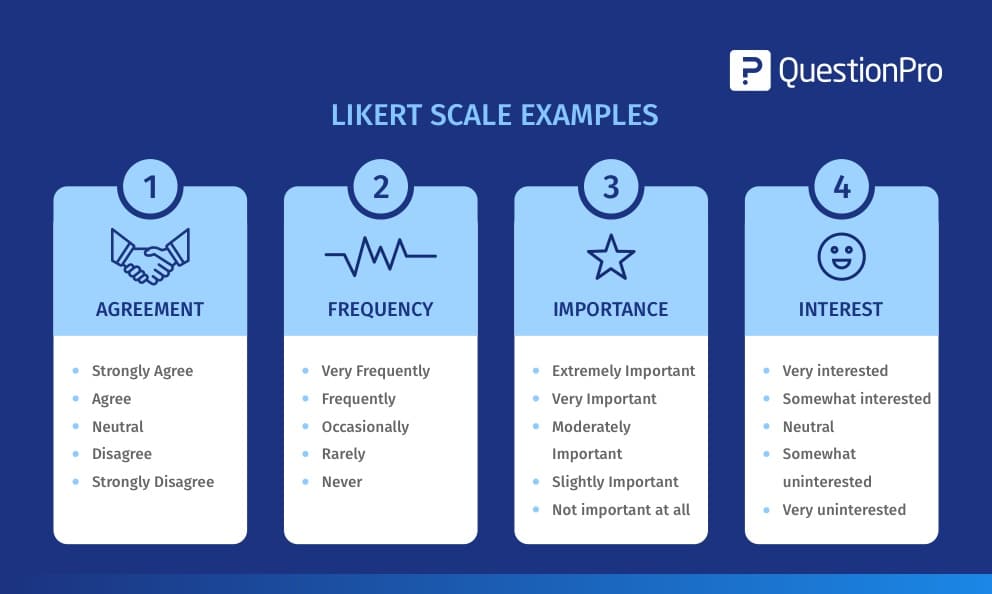
Odd Likert scale examples
Odd scales give respondents room to sit on the fence, which is useful whenever genuine neutrality is a realistic answer.
- 3-point agreement: “I would recommend this product to a colleague.” Options: Disagree, Neutral, Agree. Best for short surveys where speed matters more than precision.
- 5-point agreement: “The onboarding process was easy to follow.” Options: Strongly Disagree, Disagree, Neutral, Agree, Strongly Agree. The most common Likert format across customer and employee research.
- 7-point agreement: “My manager gives me clear feedback on my work.” A 7-point scale adds two intermediate options on each side of neutral, useful when you need to distinguish mild agreement from strong agreement.
- 5-point satisfaction: “How satisfied are you with our customer support?” Options: Very Dissatisfied, Dissatisfied, Neutral, Satisfied, Very Satisfied. A standard format for CSAT-style tracking.
- 7-point satisfaction: “How satisfied are you with the value you receive for the price?” The extra granularity helps when satisfaction scores cluster tightly and you need to detect small shifts over time.
Not sure whether a 5-point or 7-point scale is the better fit? Explore our guide on the 5-point vs 7-point Likert scale to learn when a simpler scale is enough and when additional response options provide more meaningful insights.
To save time designing balanced Likert surveys, start with our customizable Odd Likert Scale Survey Questions Template.
Even Likert scale examples
Even scales remove the neutral option, which is useful when a non-answer wouldn’t help you make a decision.
- 2-point agreement: “This feature is easy to use.” Options: Disagree, Agree. The simplest possible Likert format, best for quick in-app or in-product checks.
- 4-point agreement: “I understand how my performance is evaluated.” Options: Strongly Disagree, Disagree, Agree, Strongly Agree. Common in employee engagement surveys where a forced lean is more actionable than a neutral shrug.
- 4-point satisfaction: “How satisfied are you with the checkout process?” Removing the midpoint here prevents satisfied-but-lazy respondents from defaulting to neutral.
- 4-point frequency: “How often do you use this feature?” Options: Never, Rarely, Often, Always. Frequency questions rarely need a true midpoint, since usage is either happening or it isn’t.
- 4-point likelihood: “How likely are you to share this product with a friend?” Options: Very Unlikely, Unlikely, Likely, Very Likely. Useful for early signal on shareability without a wishy-washy middle answer.
To create forced-choice surveys faster, start with our Even Likert Scale Survey Questions Template featuring proven, neutral-midpoint-free questions.
How do you analyze Likert scale data?
Likert responses are ordinal data. The categories have a clear order, but the gaps between them aren’t guaranteed to be equal, so the analysis method matters.
Many teams calculate a simple average, which is easy to communicate. It technically assumes equal spacing between “Agree” and “Strongly Agree,” though, so it’s worth treating with some caution. For more defensible reporting, look at the full distribution of responses instead. A top-2-box and bottom-2-box summary, the percentage choosing the two most positive versus two most negative options, works well too. A 100% stacked bar chart, with negative responses on the left and positive on the right, communicates a shift over time more clearly than one averaged number.
Best practices for writing Likert scale questions
A few habits separate Likert questions that produce clean, usable data from ones that produce noise.
- Label every response option, not just the endpoints.
Fully labeled scales reduce the guesswork respondents do when interpreting an unlabeled middle option.
- Ask a question, not a statement.
“How satisfied are you with your job responsibilities?” produces less biased data than “Please rate your agreement: I am satisfied with my job responsibilities.”
- Avoid double-barreled questions.
A statement covering two ideas at once, like “The product is affordable and easy to use,” forces respondents to average two different opinions into one answer.
- Pick an odd scale by default.
A forced-choice even scale should be a deliberate decision, not an accidental one.
- Test the question with a small group first.
A short pilot catches confusing wording before it affects your full dataset.
Choosing the right Likert scale for your survey
The best Likert scale is the shortest one that still captures the distinction you actually need. A 3 or 5-point scale covers most customer and employee feedback use cases without adding respondent fatigue. Reach for 7 points only when you genuinely need to detect subtle shifts. Reach for an even scale only when a neutral answer would actually get in the way of a decision.
Frequently Asked Questions (FAQs)
A Likert scale specifically measures agreement, satisfaction, or a similar attitude using ordered, labeled categories. A rating scale is a broader term. It can include Likert scales, numeric scales, or star ratings, and not all of those have labeled response options.
A 5-point scale is faster to answer and works well for most attitude and satisfaction tracking. A 7-point scale adds finer distinctions between response levels. That’s useful in research settings where subtle differences matter more than survey length.
Not always. A neutral midpoint gives genuinely undecided respondents an honest answer, which is useful for most attitude research. Remove it only when you specifically need respondents to lean toward a direction, such as measuring straightforward frequency or usage.
You can, and many teams do for simplicity, but it technically assumes equal distance between response options. Distributions, top-2-box summaries, or the mode are generally considered more defensible for ordinal data like Likert responses.
There’s no fixed number, but shorter is usually better. Group related Likert questions into a matrix where it makes sense. Avoid stacking so many that respondents start answering on autopilot partway through.