A business intelligence tool is software that collects, stores, analyzes, and visualizes data so teams can make decisions based on evidence instead of guesswork. It pulls from surveys, sales systems, and operational data to show what happened, what is happening now, and what is likely to happen next.
Businesses today collect more data than ever, from customer surveys to transaction logs to social media activity. The bottleneck is rarely data volume anymore. It is turning that volume into something a manager can actually act on before a decision window closes.
This guide covers what a business intelligence tool actually does, and ten practical ways organizations use one, from spotting cost-cutting opportunities to defining and tracking a Net Promoter Score.
What is a business intelligence tool?
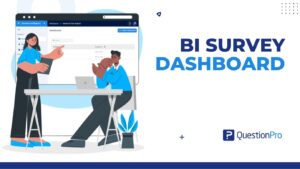
A business intelligence tool, sometimes called a decision support system, is software that turns raw operational and survey data into reports, dashboards, and visualizations business teams can use directly.
Before BI tools became self-service, business managers typically waited on a data or analytics team to run every report. Modern BI platforms let non-technical managers query and visualize their own data, using regression analysis, correlation analysis, and pivot-table-style reporting without writing code.
That shift matters because decisions made quickly with data tend to outperform decisions made slowly with gut feeling, particularly in fast-moving categories like customer experience and pricing. Gartner research on analytics buyers has found that organizations invest in BI platforms specifically to accelerate data-driven decisions and create operational efficiencies.
How do organizations use business intelligence tools?
Organizations use business intelligence tools to combine data collected through online surveys, in-person interviews, and operational systems into a single analytical view. That view can show historical trends, current performance, and predictive signals side by side.
A common example is customer experience tracking. A team can compare past and present survey responses to see if service quality has genuinely improved, based on direct voice of the customer data rather than internal assumptions about performance.
What are the ten most effective ways to use a business intelligence tool?
A regional grocery chain used to spend three days building one sales report by hand. Now the same report is waiting before Monday’s meeting starts. That shift shows up in ten recurring ways across finance, HR, sales, and marketing.
- Skip the wait for an analyst.
Generate a full analysis on demand instead of queuing behind someone else’s priorities.
- Give every strategy a number to answer to.
Tie KPIs to each initiative so “is this working” has a real answer, not a guess.
- Let more than the C-suite see the dashboard.
Frontline employees make better calls when they can see the same data leadership sees.
- Retire the copy-paste job. Automated calculations catch what manual entry eventually gets wrong.
- Read customers past the star rating.
A business intelligence survey feeds an NPS breakdown that separates who to win back from who to keep happy.
- Watch competitors without hiring a spy.
Social integrations turn public sentiment into a trackable trend line.
- Point the sales team at what’s actually selling.
Rep performance and product velocity surface in the same view, not two separate reports.
- Catch the budget leak before finance does.
Spending patterns flag excess inventory or drifting costs months earlier than a quarterly review would.
- Ask employees what leadership keeps guessing at.
Employee experience data replaces assumptions about morale with actual answers.
- Lock the front door on the data itself.
One secured platform beats a dozen spreadsheets scattered across inboxes.
That grocery chain didn’t stop at faster reports. Once sales and inventory sat in the same dashboard, a manager spotted a slow-moving product line burning shelf space two months before the next planning cycle, the same pattern that shows up whenever sales tracking and cost control finally share a screen.
How do you choose the right business intelligence tool?
Choosing the right BI tool comes down to matching its capabilities to how your team actually works, not to the longest feature list on a vendor’s website.
- Does it connect directly to your survey and feedback data, or does it require manual exports and re-imports?
- Can non-technical team members build their own dashboards, or does every report require analyst support?
- Does it support predictive analysis, not just historical reporting?
- Is pricing structured for your team size, since enterprise BI licensing can scale poorly for smaller teams?
- Does it support real-time reporting, so dashboards reflect what is happening now rather than last week’s export?
QuestionPro’s BI platform is built specifically to turn survey and feedback data into dashboards without requiring a separate analytics team, which matters most for teams already running frequent customer or employee research.
What mistakes should you avoid with a BI tool?
A few recurring mistakes reduce the value organizations get from an otherwise capable BI platform.
- Treating BI as a one-time project. Dashboards need regular review, not a single setup-and-forget approach.
- Giving access only to leadership. This limits the tool’s day-to-day impact on frontline decisions.
- Ignoring data quality upstream. A BI tool cannot fix bad or biased survey data; it can only visualize it faster.
- Skipping predictive features. Many teams use BI purely for historical reporting and miss the forecasting value entirely.
Frequently Asked Questions (FAQs)
No. A survey platform collects data directly from respondents, while a BI tool analyzes and visualizes data that may come from surveys, sales systems, or other sources. Many modern platforms, including QuestionPro, combine both functions.
Yes, though the scale differs. Small businesses benefit from BI tools that consolidate scattered spreadsheets into a single dashboard, even without the volume of data a large enterprise generates.
BI reporting typically shows what has already happened, using historical and current data. Predictive analytics goes further, applying statistical models to forecast likely future outcomes based on those same data patterns.
Costs vary widely, from free tiers built into existing survey or CRM platforms to enterprise licenses costing thousands per year. Teams already collecting survey data should check whether their existing platform includes BI features before purchasing a separate tool.
Indirectly, yes. A BI tool itself does not retain customers, but it identifies which customers are at risk of leaving and why, which gives teams the information needed to intervene before churn happens.