Customer journey analytics examples show how organizations track and analyze every interaction a customer has with a brand. These examples help businesses understand where customers drop off, what drives engagement, and how to improve the overall experience.
In the United States, where customers interact with brands across websites, apps, stores, and support channels, journey analytics has become essential for identifying friction points and improving conversions.
Customer journey analytics is the process of analyzing customer interactions across touchpoints to understand behavior patterns and optimize experiences. The examples below show how companies turn interaction data into practical insights.
What is customer journey analytics in practice?
Customer journey analytics combines behavioral data from multiple channels to map how people move through a brand’s ecosystem. Instead of looking at isolated events, it tracks the entire path from discovery to purchase and retention.
A typical journey includes:
- Marketing touchpoints such as ads or search results
- Website visits and product exploration
- Checkout or conversion actions
- Post-purchase support interactions
By analyzing these steps together, organizations can detect patterns such as:
- Where customers abandon a process
- Which channels drive the most conversions
- How long it takes customers to complete a purchase
This approach is especially important in the United States, where consumers regularly move between mobile devices, desktops, and physical stores before making a decision.
If you want a full explanation of the framework, see this guide on customer journey analytics.
What are real customer journey analytics examples?
Customer journey analytics examples show how organizations analyze real customer paths to understand customer behavior and improve outcomes.
Rather than evaluating individual metrics like traffic or conversions, journey analytics connects interactions such as ads, website visits, product usage, and support requests. This approach helps teams identify where customers drop off, what influences decisions, and which stages of the journey create friction or drive conversions.
1. E-commerce checkout optimization
One of the most common customer journey analytics examples comes from online retail, where even small friction points in the checkout process can significantly affect revenue. Journey analytics helps retailers understand exactly where customers abandon the purchase path and why.
Scenario
An e-commerce company tracks the following customer journey:
- Customer clicks a paid search ad
- Lands on a product page
- Adds an item to the cart
- Starts checkout
- Completes payment
Each step generates behavioral data, allowing analysts to measure conversion rates between stages.
Insight
Journey analytics reveals that 42 percent of customers abandon the checkout page. Session recordings and behavioral data show that many users leave when they are asked to create an account before completing the purchase.
Action
The company simplifies the checkout experience by introducing:
- Guest checkout options
- Fewer required form fields
- Clear delivery estimates before payment
Outcome
Conversion rates increase because customers can complete purchases more quickly.
According to the Baymard Institute, the average cart abandonment rate is around 70 percent across US e-commerce sites, often due to checkout friction and unexpected steps.
Journey analytics helps businesses identify the exact stage where abandonment occurs.
2. SaaS onboarding improvement
Software companies frequently use customer journey analytics tools to understand how users adopt a product after signing up. For subscription platforms, early onboarding interactions often determine whether a user becomes a paying customer.
Scenario
A SaaS platform offers a free trial. The journey looks like this:
- User signs up
- Receives an onboarding email
- Logs into the product for the first time
- Uses a key feature
- Upgrades to a paid plan
Analytics platforms track product usage events to measure how users progress through these stages.
Insight
Journey data shows that many users sign up but never reach the key feature activation stage, when they experience the product’s core value.
Action
Product teams improve the onboarding experience by introducing:
- Interactive tutorials
- Tooltips explaining core features
- A short onboarding checklist
These changes help new users understand what they should do immediately after signing up.
Outcome
More trial users activate the key feature, and the upgrade rate increases.
This example shows how journey analytics connects product usage data with business outcomes such as upgrades and retention.
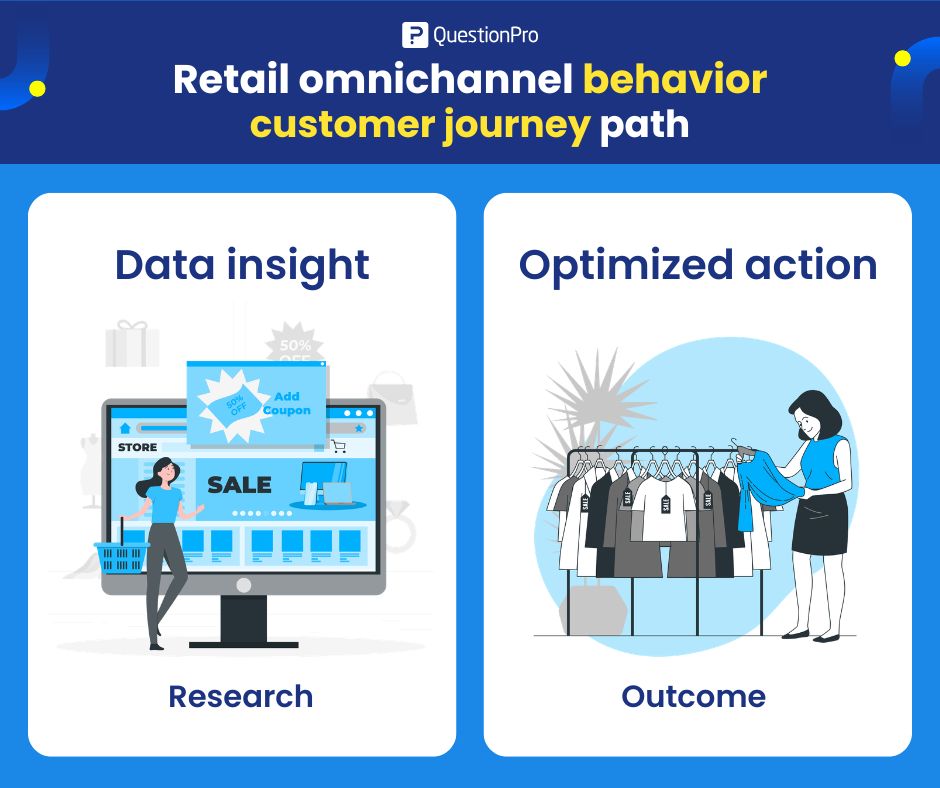
3. Retail omnichannel behavior
Retail brands in the United States operate across multiple channels, including websites, mobile apps, and physical stores. Customer journey analytics helps retailers understand how these channels influence each other.
According to Harvard Business Review research, more than 70% of US shoppers use multiple channels during their purchase journey, making omnichannel analysis essential for understanding real customer behavior.
Scenario
A national apparel retailer analyzes the following customer path:
- Customer sees an Instagram ad
- Visits the company website
- Checks store availability
- Visits a physical store
- Makes a purchase
Journey analytics connects digital interactions with in-store purchases.
Insight
Data shows that many customers research products online but prefer completing purchases in physical stores. The website plays a major role in product discovery and decision-making.
Action
The retailer improves the omnichannel journey by adding:
- Real-time store inventory visibility on product pages
- “Reserve in store” functionality
- Mobile coupons redeemable during in-store purchases
These features reduce uncertainty and make it easier for customers to transition from online browsing to offline buying.
Outcome
Online engagement begins to drive measurable increases in store traffic and retail sales.
This type of analysis highlights how digital experiences influence offline purchasing behavior, which is common in US retail.
4. Customer support friction
Customer journey analytics is not limited to marketing or sales. It is also valuable for understanding post-purchase experiences, such as customer support.
Scenario
A telecommunications provider analyzes the support journey:
- Customer experiences a service issue
- Visits the online help center
- Calls customer support
- Escalates complaint
- Cancels subscription
Each interaction generates support data that can be analyzed across channels.
Insight
Analytics shows that many customers search help articles but fail to resolve the issue before calling support. This indicates that the self-service content does not adequately answer common problems.
Action
The company improves the support experience by:
- Improving help center search functionality
- Adding troubleshooting videos and step-by-step guides
- Offering live chat support before phone escalation
These improvements provide faster problem resolution for customers.
Outcome
Support call volume decreases, resolution times improve, while customer satisfaction increases.
This example demonstrates how journey analytics helps organizations identify service bottlenecks and improve support efficiency.
5. Marketing attribution
Marketing teams use journey analytics platforms to understand which interactions actually influence purchasing decisions. Instead of crediting a single channel, they analyze the full path leading to a conversion.
Scenario
A B2B software company analyzes the path to purchase:
- Prospect reads a blog article
- Downloads a research report
- Attends a webinar
- Requests a product demo
- Signs a contract
Each interaction contributes to the decision process.
Insight
Journey analysis shows that prospects who attend webinars are significantly more likely to request a demo compared to those who only read content.
Action
The marketing team shifts more resources toward:
- Hosting educational webinars
- Promoting webinars through email campaigns
- Creating supporting content around webinar topics
This strengthens the middle stages of the conversion funnel.
Outcome
Lead quality improves, and sales cycles become shorter because prospects enter the demo stage with more product knowledge.
Instead of crediting a single channel, journey analytics identifies the sequence of interactions that drives revenue growth.
What are the benefits of customer journey analytics?
Organizations use customer journey analytics because it provides a clearer view of how customers move across touchpoints and where friction occurs.
Key benefits include:
- Identifying friction points
Journey analysis reveals exactly where customers abandon processes.
- Understanding cross-channel behavior
Customers often interact with brands across multiple platforms before making a decision.
- Improving marketing attribution
Businesses see which interactions actually influence conversions.
- Optimizing product experiences
Usage data shows which features drive retention.
- Supporting data-informed strategy
Teams make decisions based on behavioral evidence rather than assumptions.
These benefits explain why customer journey analytics platforms are widely used by retailers, banks, SaaS companies, and telecom providers.
How can QuestionPro support customer journey analytics?
QuestionPro helps businesses measure and analyze customer experiences across the journey by combining feedback with behavioral insights. Organizations can track how customers interact with different touchpoints, such as onboarding, product usage, or support.
Key capabilities include:
- Experience data collection
Trigger surveys at critical journey stages such as post-purchase, onboarding, or support interactions.
- Multi-channel feedback capture
Collect feedback across websites, mobile apps, email, and in-product experiences.
- Journey stage measurement
Analyze satisfaction and effort at specific touchpoints to identify friction points.
- Analytics dashboards
Visualize trends and detect patterns across segments, touchpoints, and time periods.
By connecting feedback to real customer interactions, businesses gain clearer visibility into how the journey performs and where improvements will have the biggest impact.
What should businesses take away from these customer journey analytics examples?
Customer journey analytics examples show a simple reality. Customer behavior rarely follows a straight path. People move between channels, pause decisions, compare options, and return later. Without analyzing these paths as a connected journey, businesses only see fragments of the experience.
The examples above illustrate how journey analytics reveals what actually happens between touchpoints. Retail teams identify checkout friction. SaaS companies discover where onboarding fails. Marketing teams learn which interactions influence conversions. Support teams detect where service breakdowns occur.
For organizations in the United States, where customers interact across websites, mobile apps, and physical locations, understanding these journeys is critical. Companies that track behavior across these interactions gain a clearer view of how decisions happen and where improvements matter most.
Frequently Asked Questions (FAQs)
Customer journey analytics examples show how businesses analyze customer interactions across multiple touchpoints to improve experiences, reduce friction, and increase conversions.
Customer journey analytics collects behavioral data from channels such as websites, mobile apps, marketing campaigns, and support systems. This data is combined to map the full path customers take before completing an action.
US consumers interact with brands across many digital and physical channels. Journey analytics helps companies understand these complex paths and optimize the customer experience across platforms.
Common tools include analytics platforms, customer data platforms, product analytics tools, and journey mapping software. These systems combine behavioral data from multiple sources.
Journey mapping visualizes the customer experience based on assumptions or research. Journey analytics uses real behavioral data to measure how customers actually move through the journey.