Behavioral data is the record of what people actually do: the pages they view, the carts they abandon, the features they never open. It shows how customers behave, not how they say they behave, and that gap is where many costly assumptions hide.
Teams use it to lift conversion, engagement, and retention. But a click on its own rarely explains intent, so the best programs pair behavior with feedback.
In this guide, we’ll define behavioral data and separate it from similar data types. We’ll also cover examples, collection methods, measurement, and US compliance.
What is behavioral data?
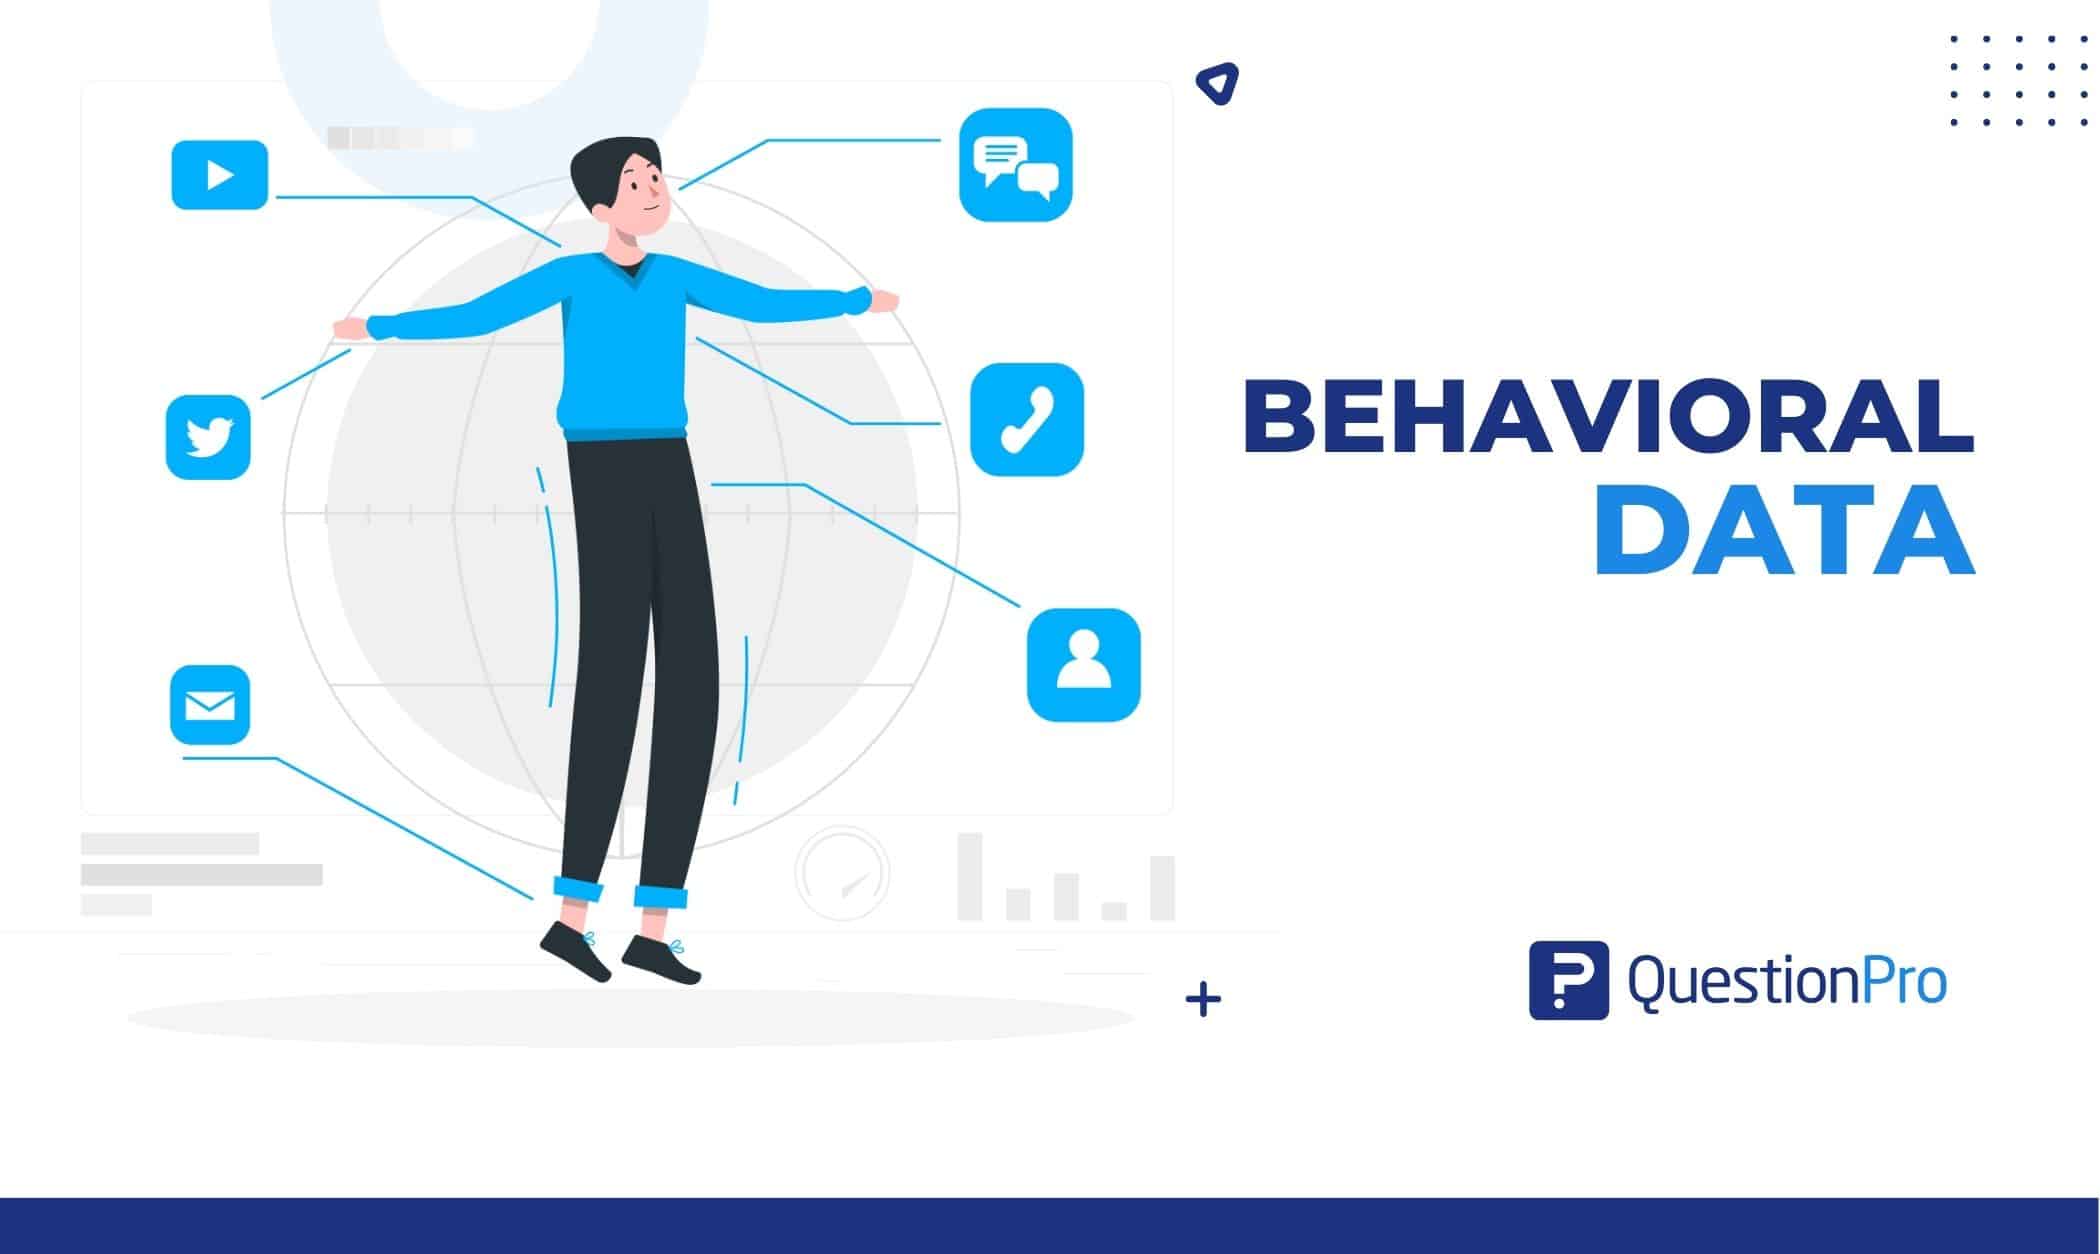
Behavioral data is information that records the actions people take when they interact with a business, product, or system, such as clicks, purchases, logins, and feature use. It describes what someone does, not who they are or what they say.
Most tools store each action as an event. Every event has three parts:
- A name: For example, “added_to_cart.”
- A timestamp: When the action happened.
- An identifier: The user, account, or device behind it.
Linking events in order builds a customer journey. That is the full path a person takes from first contact to repeat purchase or churn.
Common sources include websites, mobile apps, internet-connected (IoT) devices, point-of-sale systems, customer relationship management (CRM) systems, and support channels. Some teams call it interaction data. The practice of studying it is behavioral analytics, which turns raw events into patterns a team can act on.
How does behavioral data differ from attitudinal, demographic, and transactional data?
These four data types get mixed up often. Each answers a different question, and strong research uses more than one.
Nielsen Norman Group describes the core split as “what people say” versus “what people do”. It notes the two are often quite different, and that most usability studies should rely on behavior.
| Data type | What it tells you | Example | Main limit |
|---|---|---|---|
| Behavioral | What people do | Three visits to a pricing page in a week | Shows no reason |
| Attitudinal | What people say, think, or feel | A Net Promoter Score (NPS) or survey comment | Stated views can differ from actions |
| Demographic | Who people are | Age, location, job title | Says little about intent |
| Transactional | What people paid for | Order value, invoice date | Covers only completed purchases |
Transactional data is usually treated as a subset of behavioral data. Demographic data describes the person, while behavioral data describes the action.
What are the types of behavioral data?
Behavioral data falls into types by source (who collected it) and by channel (where it happened). Knowing both helps you judge how reliable, and how regulated, each dataset is.
Types of behavioral data by source
- First-party: Collected directly through your own website, app, and systems. It is the most accurate and the easiest to keep consent-compliant. See first-party data for a full breakdown.
- Second-party: Another company’s first-party data, shared through a partnership.
- Third-party: Data bought from aggregators or brokers. It is broader but less precise, and often harder to defend on consent.
- Zero-party: Preferences customers volunteer on purpose, usually through a survey or quiz. Zero-party data is declared, not observed, but it pairs well with observed behavior.
Types of behavioral data by channel
Online behavioral data comes from digital touchpoints. It includes page views, search queries, email opens, app sessions, and checkout steps.
Offline behavioral data comes from the physical world. It includes in-store visits, loyalty card swipes, call center contacts, and event attendance. Combining both gives a more complete view of one customer.
What are examples of behavioral data?
Behavioral data examples are specific actions tied to a business goal. The same action can mean different things in different contexts, so each example below names the likely signal.
- E-commerce: A shopper adds a jacket to the cart, then leaves at the shipping step. The signal may be price friction.
- SaaS: A free-trial user logs in twice, then never opens the reporting feature. The signal may be low activation.
- Streaming: A viewer pauses a series after episode two and never returns. The signal may be weak content fit.
- Fitness apps: Apps such as Strava log activity type, distance, and pace. The team defined those events on purpose to match the product.
- Retail stores: Foot traffic clusters near a display but sales stay flat. The signal may be a pricing or stock issue.
- Customer support: A customer contacts support three times in a month about the same issue. The signal may be churn risk.
How is behavioral data collected?
Teams collect behavioral data by tracking events across digital and physical touchpoints and storing them in an analytics tool or data warehouse. The method depends on where the behavior happens.
Exhaust data versus purpose-built data
Exhaust data and purpose-built data differ in who decides what gets recorded.
| Aspect | Exhaust data | Purpose-built data |
|---|---|---|
| Origin | Byproduct of tools you already run, such as a CRM, billing system, or server logs | Events you define and instrument on purpose |
| Strength | Cheap and fast to get | Clean, consistent, tied to a question |
| Weakness | Inconsistent, needs reshaping before sources combine | Takes planning and engineering time |
Common collection methods
- Event tracking: Record each named action with a timestamp.
- SDKs: Code snippets, often JavaScript, built into a website or app that fire on specific actions.
- Tag managers: Add or change tracking without a new code release.
- Session recordings and heatmaps: Replay or visualize how people move through a page.
- Point-of-sale and loyalty systems: Capture in-store purchases and visits.
- Surveys and feedback forms: Capture the stated side of the story, which explains the observed side.
Why is behavioral data important?
Behavioral data is important because it replaces guesses about customers with evidence of what they do. That evidence supports better personalization, sharper analysis, and faster decisions.
Customers now expect this. McKinsey found that 71% of consumers expect companies to deliver personalized interactions, and 76% get frustrated when that does not happen. The same research found personalization most often drives a 10 to 15 percent revenue lift.
Here is how that plays out in practice:
- Better data: Direct observation avoids recall errors and polite answers.
- Better analysis: Sequences of events reveal where people stall, loop, or leave.
- Better decisions: Teams can predict which visitors are likely to buy and prioritize accordingly. Behavioral segmentation groups customers by what they do rather than who they are.
- Better actions: Messages and offers land at the right stage of the journey.
How do you use behavioral data? A step-by-step guide
Using behavioral data well means starting with a question, not a dashboard. This process works for most teams.
- Define one decision: Write the question first, such as “Why do trial users stall before day seven?”
- List the events that answer it: Pick the five to ten actions that show progress or friction.
- Standardize event names: Agree on one naming rule so reports match across teams.
- Unify the data: Connect web, app, CRM, and support records, ideally with one customer ID.
- Map the journey: A journey management tool shows where behavior and experience diverge.
- Ask why: Send a short follow-up through survey software to people who showed the behavior.
- Act, then measure: Ship one change and compare results against a control group.
How do you decide which behavioral data to collect?
Collect the behavioral data that supports a decision you will actually make. Everything else adds cost, noise, and privacy risk.
Rank each candidate signal on three tests. Does it change a decision? Can you track it reliably? Would a customer be comfortable knowing you track it?
| Your goal | Signals to track | Decision it supports |
|---|---|---|
| Improve checkout conversion | Cart adds, step drop-offs, payment errors | Which step to redesign first |
| Reduce churn | Login frequency, feature use, support contacts | Who needs outreach this week |
| Prioritize features | Feature adoption, repeat use, time in feature | What to build or retire |
| Personalize marketing | Content views, email clicks, repeat visits | Which message goes to which segment |
How do you measure whether behavioral data is working?
You measure it in two ways: by the business outcomes it moves and by the quality of the data itself. Skipping the second makes the first unreliable.
For outcomes, track conversion rate, retention rate, churn rate, feature adoption rate, and time to first value. Set the target before you start, for example a two-point conversion gain over a full buying cycle. Then compare a test group against a control group.
For data quality, run four checks:
- Event coverage: Every key step in the journey fires an event.
- Identity match rate: The share of events tied to a known customer or account.
- Duplicate events: Counts of repeated records that inflate totals.
- Tracking breaks: Events that stop firing after a site or app release.
How can surveys add the “why” behind behavioral data?
Surveys add the “why” because behavior shows what happened, while a customer’s own words explain it. A shopper who abandons a cart will not tell your analytics tool that shipping felt too slow.
QuestionPro Customer Experience brings feedback from surveys, tickets, reviews, and digital behavior together, so teams read the signal and the story side by side. Its AskWhy question captures a score, the reason, and the comment in one response, which saves a second survey.
A practical pattern is the triggered follow-up. When someone abandons a cart or cancels a trial, a two-question survey asks what got in the way. The answers then explain the drop-off that the event data only counted.
What do US privacy laws mean for behavioral data?
In the US, behavioral data tied to a person can count as personal information, so collection needs consent, a clear purpose, and a way to opt out. California leads here, and its rules shape practice nationwide.
The California Consumer Privacy Act gives residents rights to know, delete, correct, and opt out of the sale or sharing of their data. It applies to for-profit businesses that meet any one of three tests. They earn over $25 million a year, handle data on 100,000 or more California residents or households, or earn half their revenue from selling personal information.
Trust is a business issue too. Research found that 67% of US adults understand little to nothing about what companies do with their data, and 73% say they have little to no control over it.
Four habits keep programs safe:
- Collect only what a decision needs.
- Explain tracking in plain language.
- Honor opt-out and global privacy signals.
- Delete data on a set retention schedule.
What are the common mistakes and risks with behavioral data?
The most common mistakes are collecting too much, reading too much into it, and forgetting the people behind it. Each one is avoidable with a little discipline.
- Tracking everything: Volume without a question produces noise.
- Confusing correlation with cause: Two behaviors that rise together do not prove one drives the other.
- Fragmented identity: One person on a phone, laptop, and tablet looks like three customers.
- Small samples: Acting on a handful of sessions leads to false patterns.
- Biased models: When behavioral attributes train machine learning models, test them for bias and discrimination before use.
- Ignoring the why: Behavior alone cannot tell you motive.
Final thoughts on behavioral data
Treat behavioral data as half of a conversation. It tells you what customers did, quietly and without bias from memory. It cannot tell you what they felt, wanted, or expected.
Start small and keep three habits:
- Pick one decision before you pick a metric.
- Track the few events that inform it.
- Ask the customers behind those events one honest question.
Do that consistently and the data stops being a pile of clicks. It becomes a working picture of how people really use what you build. For deeper study methods, see behavioral research.
Frequently Asked Questions (FAQs)
Yes. Free web analytics, point-of-sale reports, and email engagement already hold useful behavior. Add a short customer survey to explain the patterns. Start with one question, such as why customers abandon checkout, before buying any specialized platform.
Yes, but it works at the account level. Useful signals include repeat pricing page visits, seat usage inside a product, content downloads by several contacts from one company, and rising support tickets. These often predict renewal or expansion.
Often, when it links to an identifier such as an email, account, or device ID. Laws like California’s CCPA can then apply. Laws handle anonymized, aggregated data differently, so confirm your setup with qualified legal counsel.
There is no universal number. Wait until patterns hold across a full buying or usage cycle, and set a threshold before the test begins. For experiments, use a sample size calculator rather than gut feel.
Keep it only as long as it serves the purpose you told customers about. Set a retention schedule per dataset, such as raw event logs versus summarized reports, and delete or anonymize data once that purpose ends.