
Relationship NPS is a variation of the Net Promoter Score that focuses on the strength of an ongoing customer relationship. It asks whether someone would recommend your brand based on their overall experience over time.
In the USA, where customers switch providers quickly, Net Promoter Score (NPS) is used to understand trust, emotional connection, and long-term customer satisfaction. It is especially common in B2B, subscriptions, financial services, healthcare, and education.
In this article, we’ll explain what relationship NPS is, how it works, when it is useful, and the difference it has with transactional NPS.
What is relationship NPS?
Relationship NPS measures the likelihood that someone would recommend a company based on their cumulative experience across many interactions. Sometimes it is called relational NPS.
The question is simple:
“How likely are you to recommend this company to a friend or colleague?”
Relationship NPS captures:
- Long-term loyalty
- Emotional connection
- Trust built over time
- Perceived consistency across channels
This makes it especially useful for subscription businesses, financial services, B2B businesses, healthcare, and retail brands with repeat customers across the USA.
How relationship NPS works
Relationship NPS uses the standard Net Promoter Score framework. Respondents are grouped as:
- Promoters (9–10): Loyal advocates who are likely to recommend
- Passives (7–8): Neutral customers who can be influenced
- Detractors (0–6): At risk of churn or negative word of mouth
The formula is:
Relationship NPS = % Promoters − % Detractors
The score ranges from -100 to +100.
Timing makes the NPS different. It is generally measured quarterly, biannually, or annually, rather than after an event.
What is a good relationship NPS score
There is no universal definition of a “good” relationship NPS score. What counts as strong or weak depends on factors such as industry, customer expectations, switching costs, and the maturity of the relationship. This is especially true in the USA, where customers often have many alternatives and loyalty can shift quickly. Benchmarks are useful for orientation, but they should never replace context.
General benchmarks often cited in the USA include:
- Below 0: Relationship risk
- 0 to 30: Acceptable but fragile
- 30 to 50: Strong loyalty
- 50+: Exceptional advocacy
What matters more than the absolute number is direction. A flat or declining NPS over several waves usually signals unresolved trust issues.
Example:
Suppose a B2B software company has a relationship NPS of 42. On the surface, this suggests strong loyalty. However, when tracked over three consecutive quarters, the score drops from 48 to 45 and then to 42.
While the number is still positive, the downward trend points to emerging issues, such as unmet expectations after a product update or changes in customer support quality.
At the same time, segment-level analysis may show that long-tenured customers remain promoters, while newer customers are becoming passives. This kind of pattern is often more actionable than the overall score itself.
Relationship NPS vs transactional NPS: What is the difference?
Relationship NPS and transactional NPS answer different questions. Transactional NPS surveys measure satisfaction with a specific interaction, such as:
- A support call
- A checkout experience
- Onboarding or delivery
But relationship NPS measures how the entire relationship feels over time.
For example:
- Transactional NPS explains what just happened
- Relationship NPS explains why customers stay or leave
Get the Full Story: Transactional Vs Relational NPS
When you should use relationship NPS to track loyalty
Relationship NPS works best when customers have repeated interactions with your brand. Common use cases include:
- B2B SaaS and enterprise software
- Banks, credit unions, and insurance providers
- Healthcare systems and patient networks
- Universities and long-term education programs
- Membership and subscription services
If someone interacts with you only once, the relationship NPS will be unclear. If the relationship spans months or years, it becomes meaningful.
How to design a good relationship NPS survey
A good relationship Net Promoter Score survey is simple by design. Its job is not to ask everything, but to capture a clear loyalty signal and enough context to understand what is driving it.
Step 1: Ask the core question
Start with the standard NPS recommendation question and do not change the scale or wording.
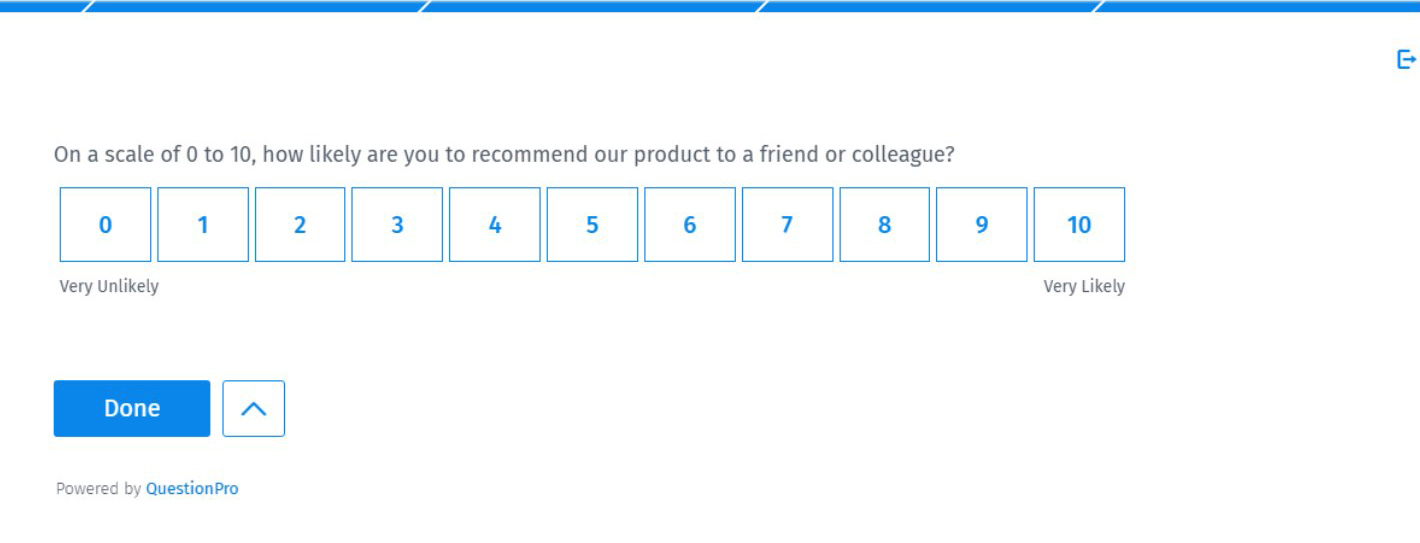
This question provides the benchmark that allows you to:
- Track loyalty trends over time
- Compare results across segments
- Spot early signs of risk or improvement
Keeping this question consistent is critical. Even small wording changes can break trend analysis.
Step 2: Add a why question
Always follow the NPS score with an open-text question asking respondents to explain their rating in their own words.
This is where tools like AskWhy add value. Instead of collecting comments in isolation, AskWhy combines the NPS score, root-cause feedback, and customer comments in a single flow. Customers can explain their score and also vote on feedback themes raised by others, helping surface what matters most right now.
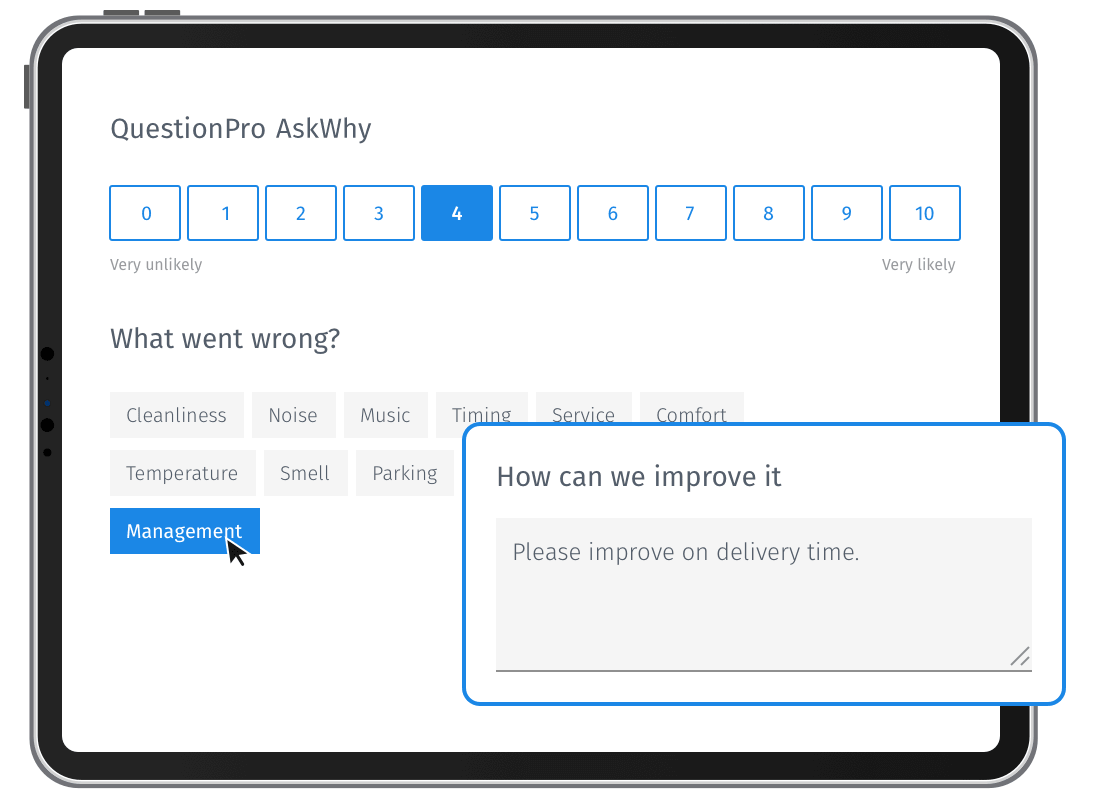
This approach reduces guesswork and highlights issues that require immediate attention.
Step 3: Include one or two diagnostic questions
Add a small number of targeted questions to understand what shapes the relationship.
For example:
- How confident are you that this company acts in your best interest?
- How would you rate the value you receive compared to the price you pay?
- How consistent has your experience been across different touchpoints?
Keep this section tight. One or two questions are usually enough to add clarity without increasing survey fatigue.
Step 4: Segment the data
Design the survey so results can be analyzed by meaningful attributes, such as:
- Customer tenure
- Product usage
- Account size
- Region or industry within the USA
Segmentation often reveals patterns that the overall score hides. A stable average NPS can still mask rising risk in a specific customer group.
Step 5: Track trends, not snapshots
Relationship NPS becomes meaningful when it is tracked over time rather than reviewed as a single data point. Focus on changes across survey waves, movement within key segments, and patterns that repeat.
Avoid over-surveying, as too many touchpoints create noise. For most organizations, a quarterly or biannual cadence provides reliable insight without exhausting respondents.
A well-designed NPS survey balances simplicity with insight. By keeping the survey short, adding meaningful follow-ups, and tracking results consistently, you turn a single score into a reliable indicator of long-term loyalty and relationship health.
Explore Further: NPS Survey Question: Examples, Types & Best Practices
Which metrics are necessary to include with relationship NPS
Relationship NPS is directional. It indicates relationship strength but does not explain the underlying causes.
Strong programs pair it with:
- Customer loyalty indicators
- Retention and churn rates
- Trust and confidence ratings
- Perceived value questions
- Open-ended follow-ups
This is where qualitative insight matters. Asking “What is the main reason for your score?” often explains movement better than dashboards.
How relationship NPS connects to customer loyalty
Relationship NPS is often described as a loyalty metric. But it measures intent rather than actual customer behavior.
High scores usually correlate with:
- Repeat purchases
- Contract renewals
- Referrals
- Lower service costs
However, loyalty also depends on price, switching barriers, and alternatives. In the USA, where alternatives are plentiful, NPS trends matter more than absolute values.
For deeper loyalty analysis, many companies connect NPS with churn modeling and cohort analysis. This is where linking it to broader feedback programs adds value.
How to improve the relationship NPS
Improving relationship NPS is not about chasing promoters. It is about reducing detractors. To improve the score, you should take some necessary actions, such as:
- Closing the loop with detractors and passives
- Fixing repeated issues revealed in comments
- Aligning product, service, and communication teams
- Tracking whether changes affect future scores
You should treat NPS as feedback, not a KPI to defend, and see better results. Loyalty grows when people feel heard and see visible change.
What are the pros and cons of relationship NPS
Relationship NPS is widely used because it offers a simple way to summarize how customers feel about a brand over time. Its strength lies in its clarity. A single number can quickly communicate whether relationships are improving, stable, or at risk.
At the same time, simplicity comes with trade-offs. Net Promoter Score is a high-level signal, not a detailed diagnostic tool. Understanding both its strengths and its limits helps teams use it appropriately and avoid drawing conclusions it was never meant to support.
Pros
- Simple and easy to benchmark
- Tracks loyalty trends over time
- Useful for executive-level reporting
- Strong signal for retention risk
Cons
- Lacks diagnostic detail on its own
- Slow to reflect recent changes
- Influenced by brand perception, not just experience
- Can hide specific operational problems
In practice, relationship NPS should never stand alone. It works best when paired with follow-up questions and behavioral data.
Common mistakes to avoid with relationship NPS
Relationship NPS is simple by design, but it is often misused in practice. Many problems do not come from the metric itself, but from how it is implemented, interpreted, or communicated internally.
- Running it too often
- Treating it as a KPI instead of a signal
- Ignoring verbatim responses
- Comparing across unrelated industries
- Tying bonuses directly to the score
Used correctly, relationship NPS supports better decisions and healthier conversations. It works best as a diagnostic input that prompts learning and improvement, not as a performance target that creates fear or defensiveness.
How QuestionPro helps measure loyalty using relationship NPS
QuestionPro helps companies measure loyalty by treating it as a long-term signal rather than a one-time score. The emphasis is on understanding how customer relationships change over time and connecting NPS results to real context, not just reporting a number on a dashboard.
With QuestionPro, you can:
- Run recurring NPS surveys on a quarterly or biannual cadence
- You can create your survey with QuestionPro AI with prompts
- Track score trends over time to spot improvement or early signs of risk
- Segment results by factors such as customer tenure, account size, or region
- Pair NPS scores with open-text feedback to understand what is driving sentiment
To go deeper into loyalty drivers, AskWhy extends relationship NPS by combining the score, root-cause feedback, and customer comments in a single flow. Customers explain their rating and can vote on feedback themes raised by others, which helps teams see which issues matter most and where action will have the biggest impact.
Beyond the NPS score itself, QuestionPro makes it easier to connect NPS with supporting experience signals. Trust, satisfaction, and communication questions can be included in the same survey, creating a more complete picture of why customers stay loyal or begin to disengage.
This approach helps companies move away from treating relationship NPS as a standalone KPI. Instead, it becomes part of a broader loyalty measurement system that supports informed retention decisions and continuous improvement over time.
Final thought
In many research programs, relationship NPS sits at the top of the measurement framework because it provides a clear view of long-term loyalty.
Companies use it to monitor how relationships evolve, flag accounts or segments that may be at risk, and decide where deeper investigation is needed. Rather than reacting to isolated feedback, relationship NPS helps organizations focus on patterns that matter over time.
Platforms like QuestionPro support this approach by making it easier to track NPS consistently, connect it with contextual feedback, and analyze trends across segments. By bringing scores, comments, and supporting metrics together in one place, teams can move from monitoring loyalty to actively improving it.
Frequently Asked Questions (FAQs)
Yes, especially when tracked over time. Declining scores often appear before churn shows up in revenue data.
Yes, if they have repeat customers. Even small samples can reveal trends when tracked consistently.
It works particularly well in B2B, where long-term trust and renewal matter more than single interactions.
They answer different questions. CSAT measures satisfaction with experiences. Relationship NPS measures loyalty and advocacy.
Most companies measure it quarterly or twice a year. Measuring too often can create noise without new insight.