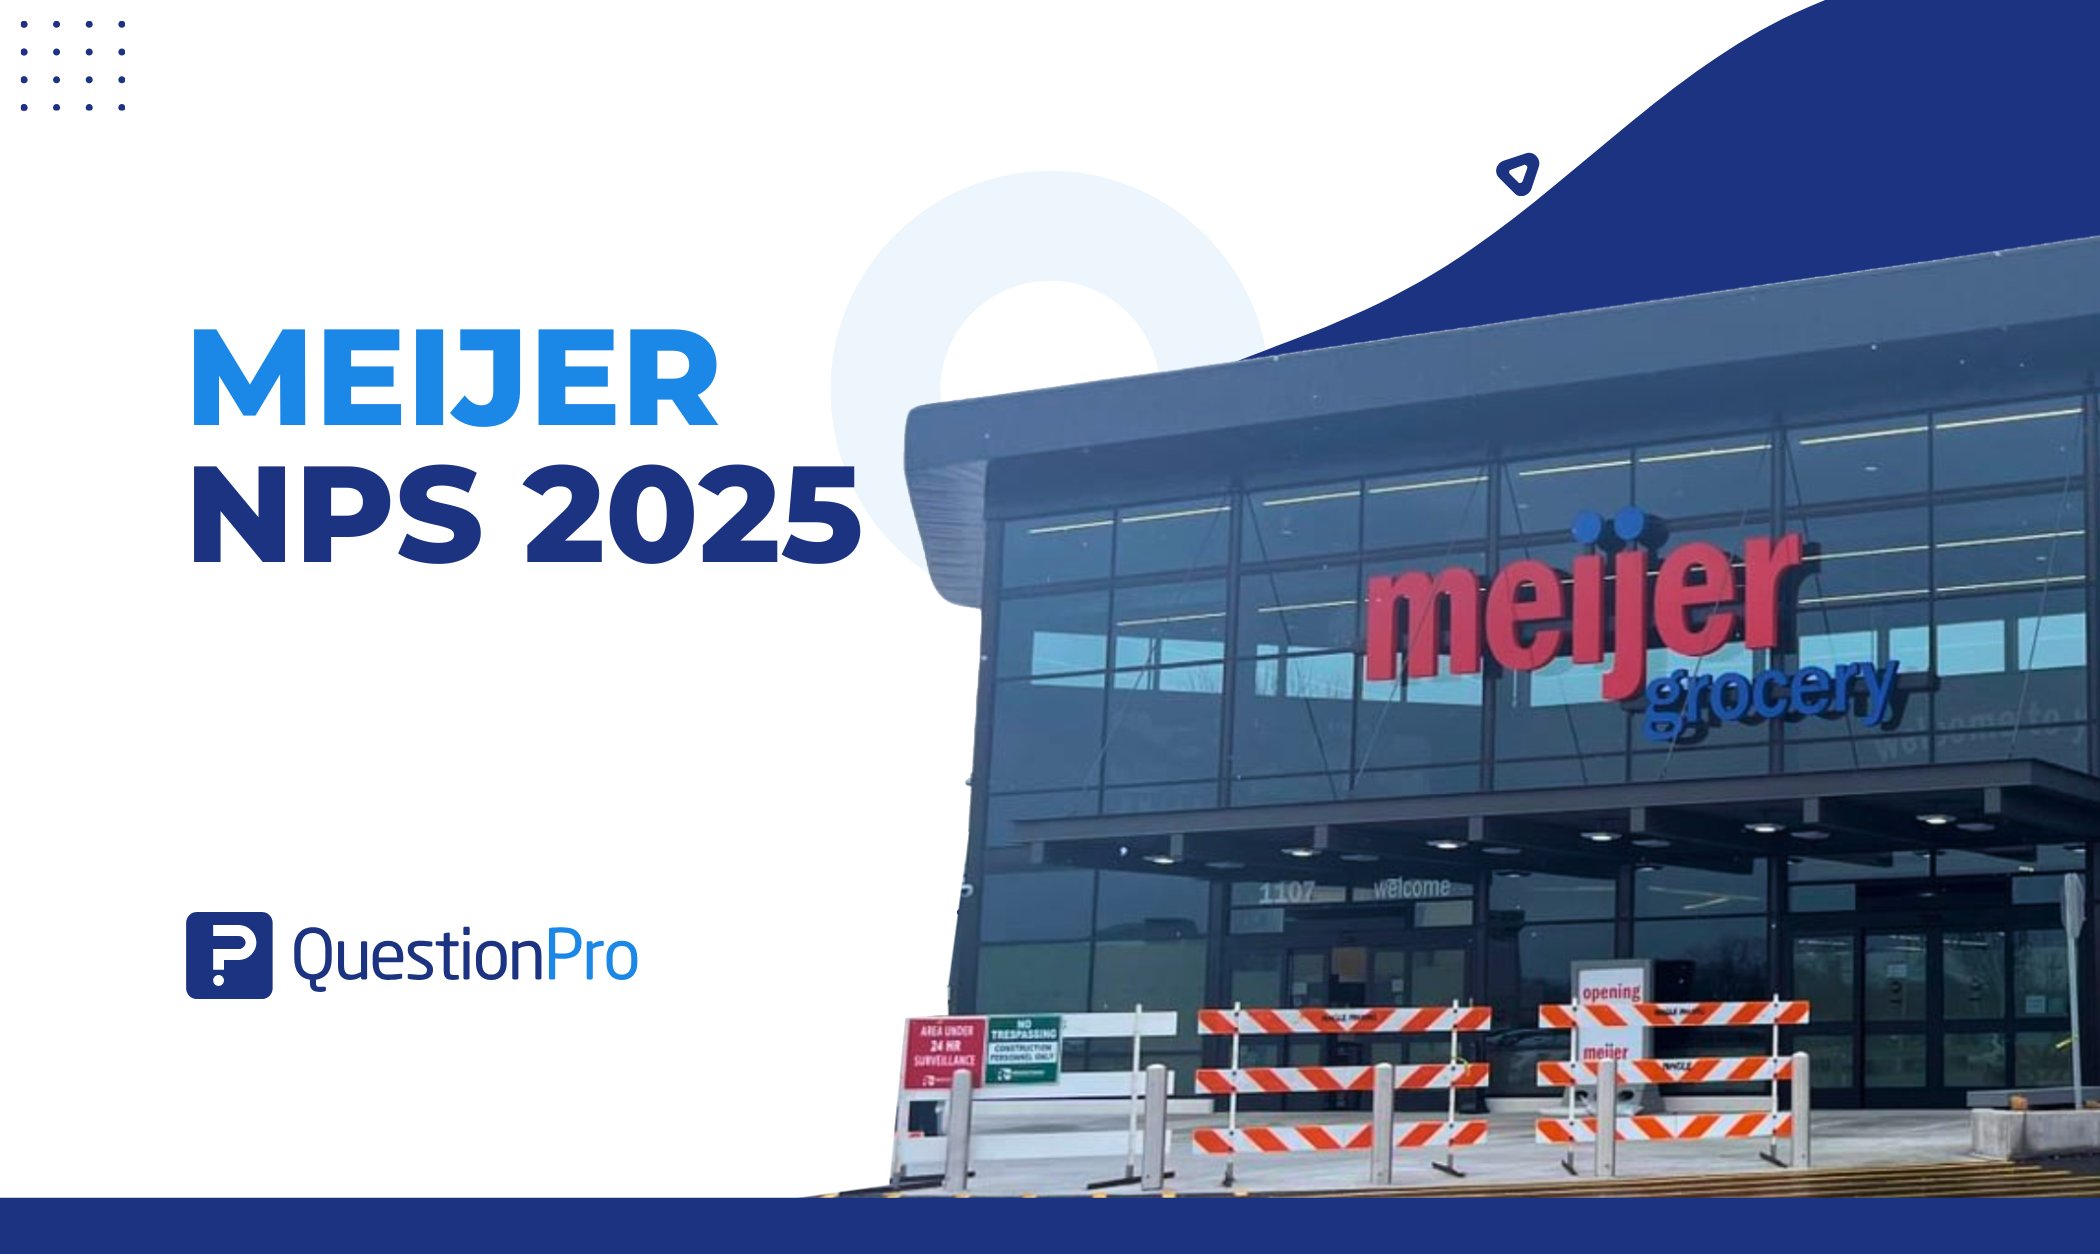
Meijer NPS 2025 data puts the Midwest grocery chain well ahead of the industry average, with a score of 50 built from real shopper feedback. That number reflects how customers feel about Meijer’s prices, service, and in-store experience relative to other grocery brands.
Grocery retail runs on repeat visits, and repeat visits depend on trust. A Net Promoter Score turns that trust into a number you can track, benchmark, and act on.
In this article, we’ll break down Meijer’s NPS score, explain why the figure varies across data sources, and show how to apply the same benchmarking approach to your own brand.
What is Meijer’s NPS score in 2025?
Meijer’s Net Promoter Score for 2025 is 50, based on a QuestionPro survey of 1,000 U.S. shoppers conducted in Q1 2025. That places Meijer well ahead of the grocery industry average of 37.
The score breaks down into three groups of respondents:
- Promoters: 63%
- Passives: 24%
- Detractors: 13%
A score in the 50s signals strong loyalty. Most Meijer shoppers actively recommend the brand, and detractors make up a small share of the total. Few grocery chains reach this level, which is why Meijer’s result stands out in a category known for thin margins and price-driven switching.
Grocery shoppers switch stores easily when price or convenience shifts even slightly. A promoter share above 60% means Meijer is retaining loyalty despite that pressure, which points to something structural in the experience rather than a short-term promotion or pricing win.
What is NPS, and how is it calculated?
Net Promoter Score is a single-question metric that gauges how likely customers are to recommend a business. It comes from asking shoppers: “On a scale of 0 to 10, how likely are you to recommend us to a friend or colleague?”
Responses sort into three groups:
- Detractors (0 to 6): Unhappy customers who may actively discourage others from shopping there.
- Passives (7 to 8): Satisfied shoppers who aren’t actively promoting the brand either way.
- Promoters (9 to 10): Loyal advocates who recommend the brand without being asked.
The formula subtracts detractors from promoters:
NPS = % Promoters − % Detractors
Scores range from -100 to 100. A positive score means promoters outnumber detractors, and a higher score points to stronger loyalty. You can run this calculation yourself with QuestionPro’s free NPS calculator, which is useful once you’ve collected your own Net Promoter Score (NPS) responses.
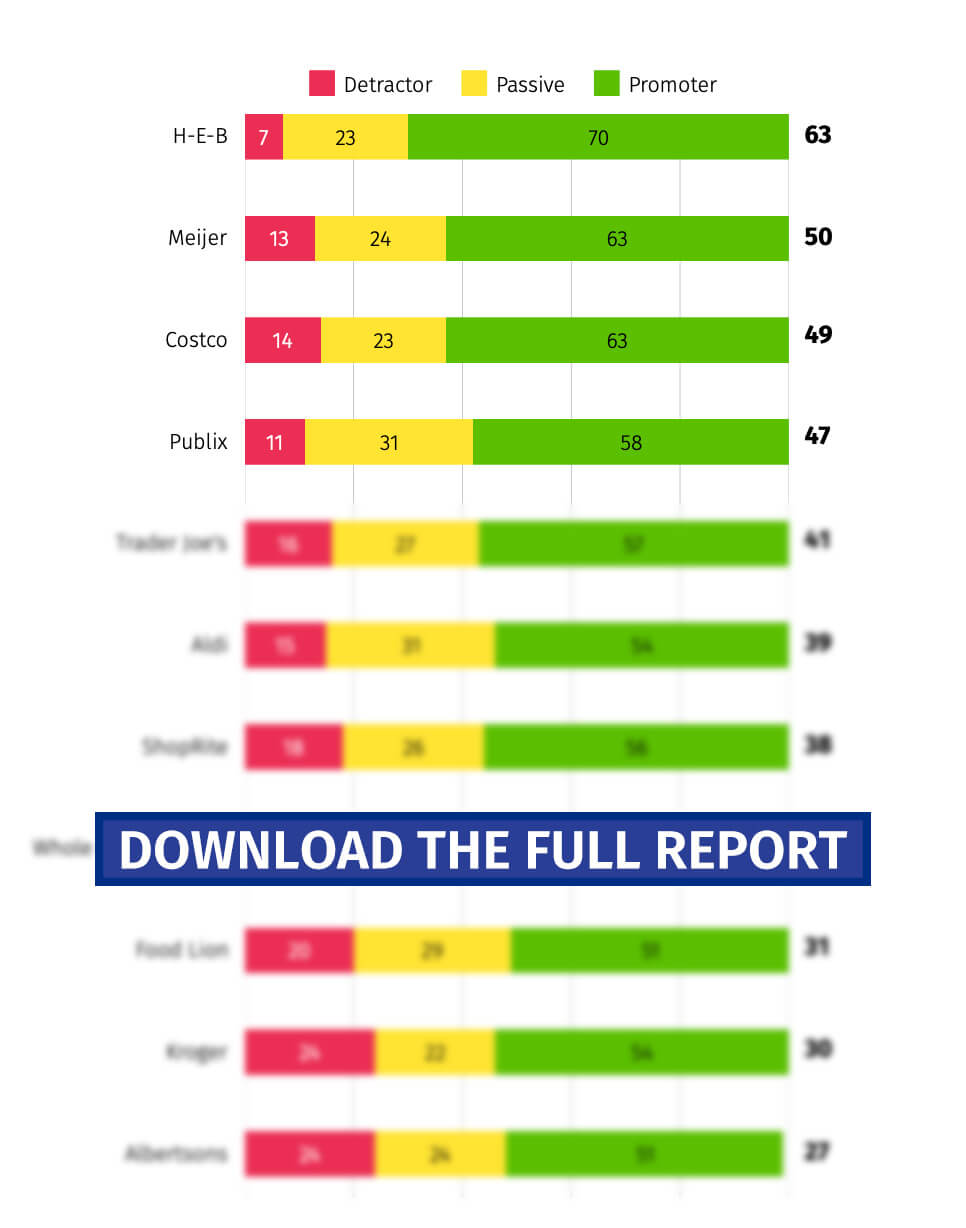
These results represent Q1 2025, and QuestionPro updates them quarterly to track industry shifts and trends.
Want to see how other major brands are performing? Download our latest report—it’s full of insights on what’s driving customer loyalty across industries.
Take a look at the Q1 2025 NPS Benchmark Report to see how top brands are winning over their customers and building loyalty.
Why do NPS scores for Meijer vary across different sources?
Different platforms report different NPS figures for the same brand because they measure different populations in different ways. This is one of the most overlooked issues in NPS benchmarking.
QuestionPro’s figure of 50 comes from a structured Q1 2025 study of 1,000 U.S. grocery shoppers, sampled specifically to represent the general shopping population. Comparably, by contrast, reports a continuously tracked score of 7 for Meijer, drawn largely from self-selected employees and site visitors rather than a representative shopper panel.
Sample composition explains most of the gap. A panel skewed toward one respondent type, or one that updates in small monthly batches, will move differently than a fixed quarterly benchmark study. Neither number is wrong. They are answering slightly different questions.
This matters for anyone comparing brands: always check the sample size, the respondent pool, and the collection window before treating two NPS figures as equivalent. Academic research on NPS methodology in services marketing makes a similar point about how sampling choices affect reported scores across industries.
If you’re benchmarking your own brand, pick one source and stick with it over time. A score that moves from 45 to 52 within the same methodology tells you something real. Comparing that same 45 against a different platform’s number tells you very little.
How does Meijer’s NPS compare to the grocery industry benchmark?
Meijer’s score of 50 sits well above the grocery industry average of 37, based on the same QuestionPro study. Among the grocery brands tracked, Meijer lands in the top three.
| Brand | NPS (Q1 2025) |
| H-E-B | 63 |
| Meijer | 50 |
| Costco | 49 |
| Trader Joe’s | 41 |
| Aldi | 39 |
| Kroger | 30 |
| Safeway | 17 |
For a fuller picture across twelve grocery brands, the NPS benchmarks for the grocery industry report breaks down where each competitor lands and why.
It’s worth noting that NPS isn’t the only way to measure grocery sentiment. The American Customer Satisfaction Index tracks a separate 100-point satisfaction score for the supermarket sector, which came in at 79 in 2025. ACSI doesn’t track Meijer individually, but the two indexes together suggest the grocery sector overall is performing reasonably well on both loyalty and satisfaction.
What drives Meijer’s customer loyalty?
Meijer’s score reflects specific, repeatable choices rather than luck. Four factors show up consistently in how shoppers describe the brand.
- A loyalty program that delivers.
The mPerks program offers personalized digital coupons and cashback tied to actual shopping habits, which makes savings feel individually tailored rather than generic. - Everyday value without a quality tradeoff.
Meijer keeps prices competitive across groceries, electronics, and home goods, so shoppers don’t feel they’re sacrificing quality to save money. - Convenient technology that actually works.
The Shop & Scan feature lets customers scan items as they shop and skip the checkout line, while curbside pickup and delivery cover shoppers in a hurry. - A genuine one-stop shopping experience.
Wide product selection, fresh food quality, and helpful staff mean fewer trips to multiple stores for one shopping list.
Each of these addresses a different friction point in the grocery experience, which is likely why Meijer’s promoter share stays high across such a broad customer base. This pattern lines up with what most customer loyalty research shows: loyalty compounds when convenience, price, and service improve together rather than in isolation.
Picture a typical mPerks shopper. She scans her app at checkout, sees a cashback offer tied to something she already buys weekly, and skips the line using Shop & Scan on a busy Sunday. None of those moments alone would justify a 9 or 10 on the recommendation question. Together, they add up to an experience worth mentioning to a friend, which is exactly how promoters get made.
How should you use this benchmark, and what mistakes should you avoid?
A benchmark is only useful if it changes what you measure or do next. Here’s how to apply Meijer’s numbers without falling into common traps.
Turn the benchmark into action
- Compare your own NPS against the grocery average of 37, not just against the top performer.
- Segment feedback by store location, channel, and shopping mission to find where detractors cluster.
- Track your score quarterly so you can see whether a new initiative actually moved the number.
- Prioritize fixes that reduce detractors first, since removing friction usually moves NPS faster than adding perks.
A platform like QuestionPro Customer Experience supports this kind of segmentation and quarterly tracking without manual spreadsheet work.
Common mistakes to avoid
- Treating NPS scores from different platforms as directly comparable without checking methodology.
- Assuming passives are safe, when they’re often one bad experience away from becoming detractors.
- Looking only at the number without asking customers why they gave that score.
- Running the survey once and never repeating it, which makes trend analysis impossible.
How can you measure and improve your own NPS?
Measuring your own NPS takes less setup than most teams expect. The process below mirrors how QuestionPro’s benchmark data itself gets collected.
- Ask the standard question.
Log in to your survey platform, create a new survey, and include: “On a scale of 0 to 10, how likely are you to recommend our company to a friend or colleague?” - Add a follow-up for context.
The AskWhy feature adds an open-ended question that captures the reasoning behind each score, which is exactly the context missing from a raw NPS number. - Distribute across channels.
Send the survey by email, embed it as a web link, use QR codes in-store, or push it through SMS and social channels. - Let the platform calculate automatically.
Survey Software from QuestionPro tallies promoters, passives, and detractors in real time, so there’s no manual math involved. - Close the loop.
Follow up with detractors directly when possible. Fixing an individual complaint often prevents it from becoming a pattern.
What Meijer’s score really tells the grocery industry
Meijer’s NPS isn’t an isolated number. It’s a signal that specific, unglamorous choices, a loyalty program that feels personal, checkout technology that removes friction, and consistent value, compound into measurable customer advocacy over time.
Brands that treat their own NPS the same way, as a starting point for investigation rather than a final grade, tend to see the score move in the right direction. The benchmark matters less than what a business does after seeing it.
Looking for expert guidance? Contact us, and we’ll help you optimize your customer experience strategy!
Frequently Asked Questions (FAQs)
Yes. At 50, Meijer ranks among the top three grocery brands in QuestionPro’s 2025 study, behind only H-E-B at 63. It beats larger national chains like Kroger, Whole Foods, and Safeway by a wide margin.
QuestionPro refreshes its NPS and CSAT benchmark report quarterly using fresh survey waves. That means a brand’s score can shift from one quarter to the next as customer sentiment changes, so it’s worth checking the latest release before making decisions.
No. Even with 63% promoters, 13% of respondents were detractors. A strong NPS means most customers are loyal, not that every experience is positive, so tracking detractor feedback still matters for a complete picture.
NPS measures how likely customers are to recommend a brand, while ACSI measures overall satisfaction on a 100-point scale. The two track related but different behaviors, so a business can score well on one and only average on the other.
Yes. Any grocery brand, regardless of size, can ask the same 0 to 10 recommendation question. What matters most is consistent measurement, an adequate response sample, and following up on the reasons behind each score.
Meijer isn’t the only company in the grocery retail industry with valuable lessons for those looking to improve their customer service and experience. Below, we recommend a few articles where you can learn how other major brands manage to maintain a high NPS and a loyal customer base — you’ll surely find some useful insights along the way.