Remember the 2008 economic crash in the US? Guess what started it – Speculative decision making by major companies […]
How QuestionPro’s free academic survey software is promoting safe and data-driven decision making in India
How free survey softwares are helping Indian startups grow
It took India 20 years to become the world’s 4th largest hub for startups, but only 1 year to […]
Van Westendorp Price Sensitivity Meter
The Van Westendorp price sensitivity meter is defined as a technique for market researchers to gauge consumer perceptions of the […]
The Communities Insights Platform: QuestionPro Newsletter
I’d like to welcome you to the first installment of the QuestionPro Communities Newsletter, our update on the world with […]
Top 7 Benefits of Mobile Market Research
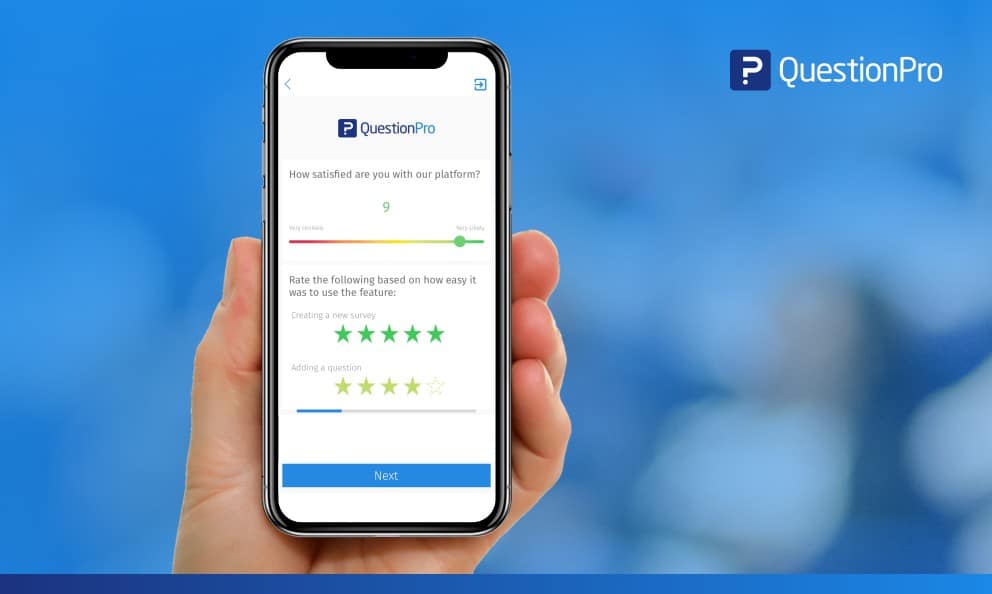
Mobile Market Research The technological achievements in the 21st century know no bounds. The invention of a smart mobile phone […]