Advanced Cross-Tabulation has always been one of the most powerful analytical tools in QuestionPro BI, helping teams uncover relationships between variables, validate statistical significance, and explore survey data across segments.
But when it came to customer experience metrics like NPS, CSAT, and CES, many teams still found themselves exporting data into spreadsheets to perform calculations manually.
That changes with Custom Metrics in Advanced Cross-Tabs.
Organizations can now calculate, customize, and analyze customer experience metrics directly within cross-tab reports – eliminating manual workflows while ensuring consistent metric definitions across teams.
The challenge with traditional CX reporting
Customer experience teams rely heavily on metrics such as Net Promoter Score (NPS), Customer Satisfaction Score (CSAT), and Customer Effort Score (CES) to measure loyalty, satisfaction, and effort across the customer journey.
However, calculating these metrics inside traditional cross-tab reports often creates operational challenges.
Common problems include:
- Exporting data into Excel for NPS, CSAT, or CES calculations
- Maintaining consistent scoring methodologies across teams
- Comparing customer experience scores across multiple segments
- Recalculating metrics whenever survey scales change
- Managing different interpretations of response classifications
As reporting environments grow more complex, these manual workflows slow down analysis and introduce inconsistencies into decision-making.
Custom Metrics was built to solve exactly these problems.
What are Custom Metrics?
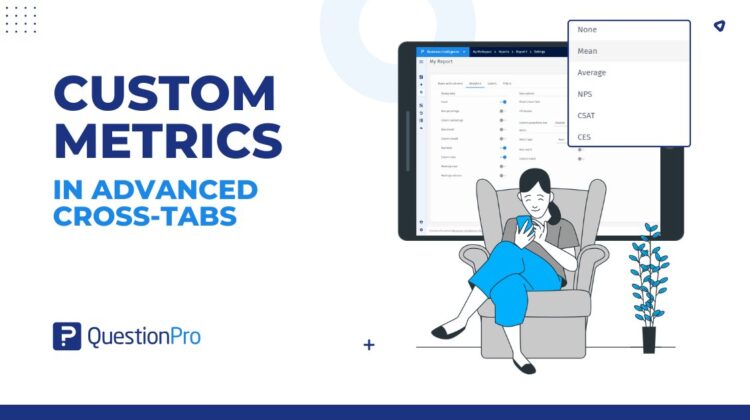
Custom Metrics introduces a dedicated metric layer within Advanced Cross-Tabs that allows organizations to calculate customer experience metrics directly inside reports.
Users can now select:
- NPS
- CSAT
- CES
- Mean
- Average
– and apply them across rows, columns, or both.
Unlike traditional aggregation methods, these metrics can also be customized to reflect an organization’s specific scoring methodology.
This means customer experience analysis no longer needs to happen outside the reporting workflow.
Key capabilities of Custom Metrics
Calculate NPS, CSAT, and CES directly within cross-tabs
Organizations can now generate customer experience metrics directly inside Advanced Cross-Tab reports.
Instead of exporting data for external calculations, teams can immediately analyze customer loyalty, satisfaction, and effort across segments, demographics, products, regions, and other business dimensions.
For teams evaluating customer experience programs, this significantly reduces time-to-insight.
If you’re exploring the differences between these metrics, our guide on NPS vs CSAT vs CES provides a deeper breakdown of when each should be used.
Apply metrics across rows, columns, or both
Different reporting scenarios require different analytical perspectives.
Custom Metrics allows users to:
- Calculate metrics across rows
- Calculate metrics across columns
- Apply metrics across both dimensions simultaneously
This enables customer experience comparisons across multiple segments within the same report.
For example, organizations can compare NPS across customer tiers while simultaneously analyzing differences across geographic regions.
Customize response classifications
One of the most powerful aspects of Custom Metrics is the ability to customize scoring logic directly from the report.
Users can configure how response options are classified for each metric.
For NPS, responses can be mapped into:
- Promoters
- Passives
- Detractors
For CSAT:
- Satisfied
- Neutral
- Not Satisfied
For CES:
- Simple
- Neutral
- Complicated
This flexibility allows organizations to align reporting with internal methodologies, survey scales, and business definitions.
Standardize CX reporting across teams
One common challenge with customer experience reporting is inconsistent metric calculations across departments.
Different analysts often use slightly different scoring rules, leading to reporting discrepancies.
Custom Metrics centralizes these definitions directly within the reporting workflow, helping organizations maintain consistency while reducing manual effort.
Teams can now build standardized customer experience reporting processes without relying on spreadsheets or external calculations.
A real-world example
Imagine a customer insights team analyzing satisfaction data across regions.
Previously, they might have exported survey responses into Excel, manually grouped response values into satisfaction buckets, calculated CSAT scores, and then re-imported findings into stakeholder reports.
With Custom Metrics, the entire process happens directly inside Advanced Cross-Tabs.
The team can:
- Select CSAT as the metric type
- Apply the metric across rows and columns
- Configure which responses are classified as Satisfied, Neutral, and Not Satisfied
- Instantly compare satisfaction scores across regions, customer segments, and products
All without leaving QuestionPro BI.
Why customer experience metrics matter
Organizations increasingly rely on customer experience indicators to understand customer behavior, loyalty, and retention.
Metrics like NPS, CSAT, and CES each provide different perspectives on the customer journey.
- NPS measures customer loyalty and advocacy
- CSAT measures satisfaction with specific interactions
- CES measures how easy it is for customers to complete a task or resolve an issue
Our articles on Customer Satisfaction Metrics and Customer Experience Management explore these concepts in greater detail.
By bringing these metrics directly into Advanced Cross-Tabs, organizations can combine statistical analysis with customer experience measurement in a single reporting environment.
As customer experience becomes an increasingly important business driver, organizations need reporting tools that can measure, analyze, and operationalize CX insights at scale.
Custom Metrics in Advanced Cross-Tabs brings that capability directly into QuestionPro BI.