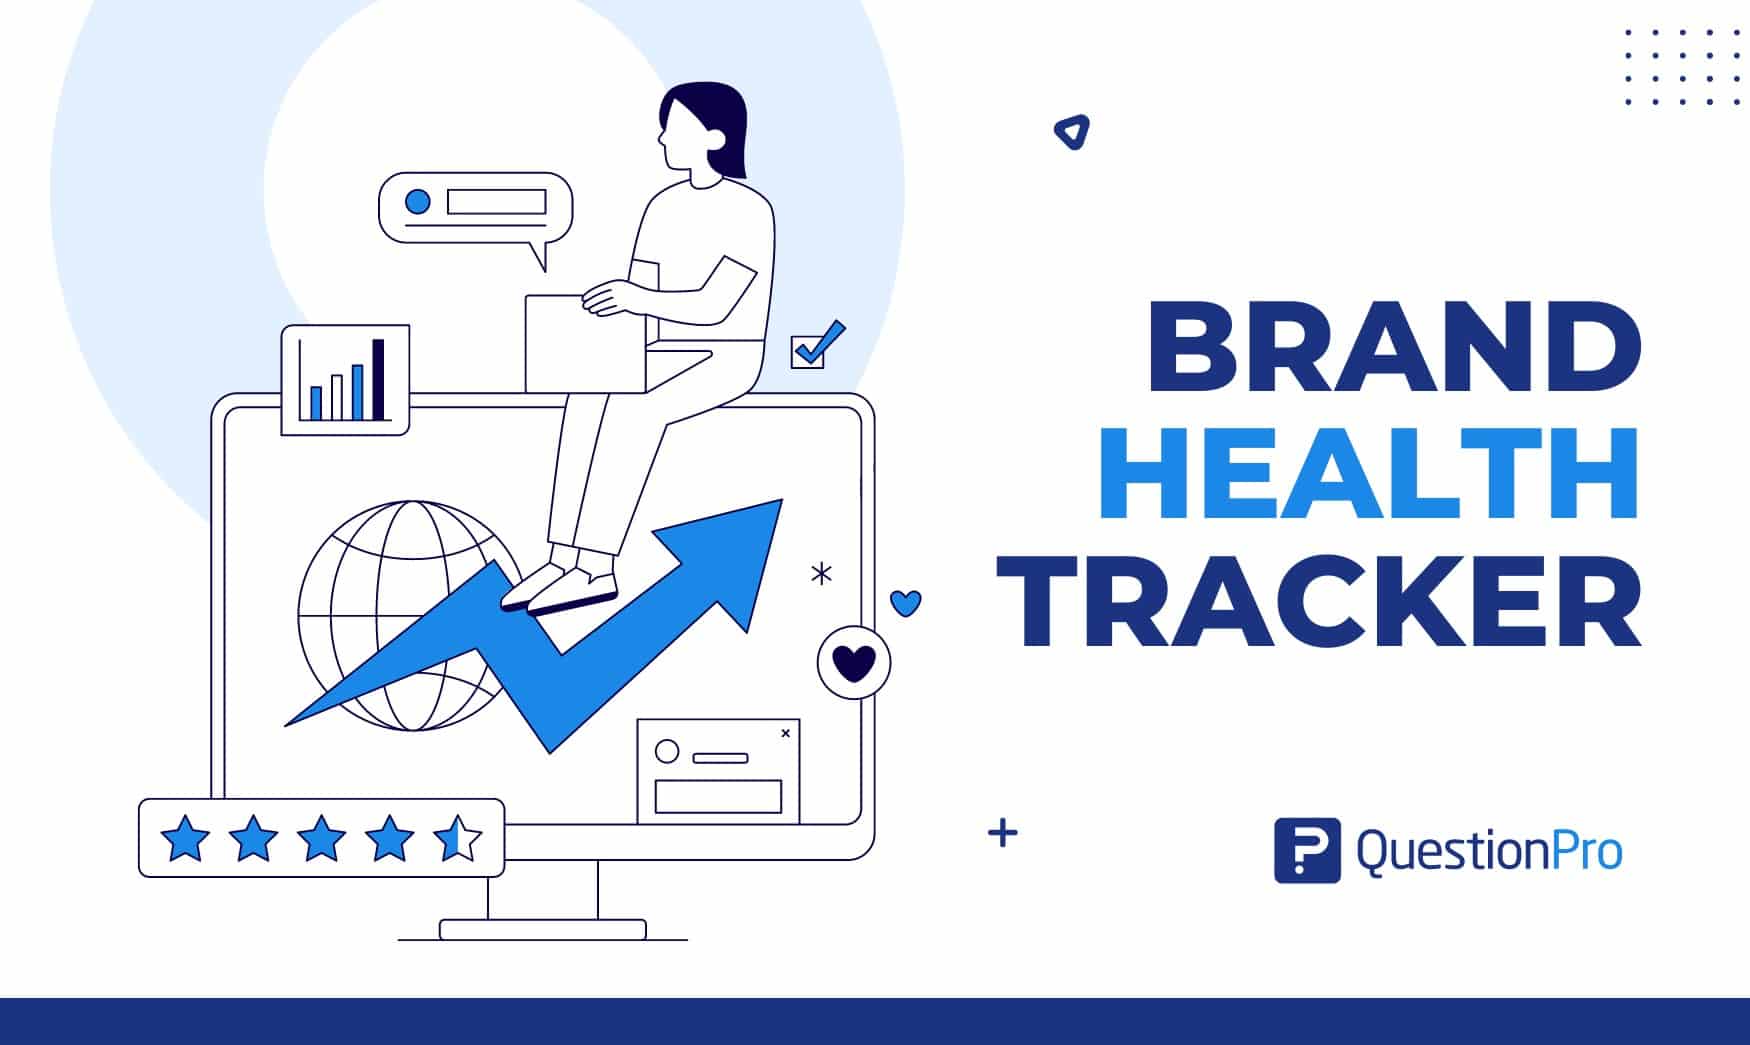
A brand health tracker is a system that measures how people perceive your brand and how that perception changes over time. It combines survey data, social conversation, and customer feedback into one trend line you can act on.
Most teams check brand health once a year, if at all. By then, a drop in awareness or trust has already cost them sales. A tracker turns that yearly audit into an early warning system.
In this guide, we’ll define brand health tracking, show the metrics that matter, walk through setup, and compare eight tools so you can choose one with confidence.
What is a brand health tracker?
A brand health tracker is a tool or program that repeatedly measures awareness, perception, loyalty, and competitive position for one brand. It uses the same questions and the same audience definition each time, so changes reflect real shifts, not noise.
Brand health itself is the overall strength of a brand in the minds of its audience. That includes how well people know you, what they believe about you, and how likely they are to buy or recommend you. Sales figures do not capture it. Brand health is the set of perceptions that predict future sales.
Trackers fall into two types:
- Survey-based trackers poll a representative sample at set intervals. They show awareness, consideration, and preference against competitors.
- Social listening trackers monitor public posts, reviews, and news. They show sentiment and share of voice in near real time.
Most mature programs use both. Surveys explain why perception moves. Listening shows when it moves.
How is brand health tracking different from similar terms?
Brand health tracking is often confused with brand tracking, brand monitoring, and brand measurement. They overlap, but each answers a different question.
| Term | Main question | Typical data | Frequency |
|---|---|---|---|
| Brand health tracking | Is the brand getting stronger or weaker? | Survey metrics plus sentiment | Ongoing waves |
| Brand tracking | How do awareness and usage move over time? | Survey waves | Quarterly or monthly |
| Brand monitoring | What are people saying right now? | Mentions, reviews, news | Real time |
| Brand measurement | What is the brand’s value at one point in time? | Surveys, equity models | One-off or annual |
Brand health tracking is the umbrella program. Brand tracking supplies the survey layer, and monitoring supplies the live conversation layer. For a wider look at one-off studies, see QuestionPro’s guide to brand measurement. For the survey method in detail, read the brand tracking guide.
Why should you track brand health?
You should track brand health because perception shifts before sales do. A tracker lets you see the shift, find the cause, and respond while the cost is still small.
Many leaders already measure brand health but struggle to use it. Research found that 57% of brand leaders assess brand health, yet only 21% say the metrics lead to actionable insights. The gap is rarely data. It is usually unclear goals and metrics that nobody owns.
A well-run tracker gives you five concrete benefits:
- Early warnings. Falling recall or souring sentiment shows up before revenue drops.
- Better budget calls. You can see which campaigns lifted awareness and which did not.
- Competitor context. Your 40% awareness means little until you know a rival holds 65%.
- Faster crisis response. You can measure how far trust fell and when it recovers.
- Shared language. Leadership, marketing, and CX teams work from one scorecard.
Which brand health metrics should you track?
Track four groups of metrics: awareness, perception, loyalty, and competitive position. Add one or two internal signals if your reputation depends on your people.
Pick the few that match your goal. A tracker with twelve metrics and no owner helps nobody.
Awareness metrics
Awareness shows whether people know you exist. Track two versions, and read more on brand awareness if you need the basics.
- Unaided awareness: Respondents name brands in your category without prompts. This is the harder, more telling number.
- Aided awareness: Respondents see a list and say which brands they recognize.
Perception and sentiment metrics
Perception covers what people believe about you. Track brand associations, such as “trustworthy” or “expensive”, and net sentiment from reviews and social posts. Sentiment analysis is the use of text analytics to label language as positive, negative, or neutral. Survey it with open-ended and rating questions.
Loyalty and advocacy metrics
Loyalty shows whether people stay and speak up for you. The standard measure is Net Promoter Score (NPS), which asks how likely someone is to recommend you on a 0 to 10 scale. NPS equals the percent of promoters minus the percent of detractors.
| Group | Score given | Meaning |
|---|---|---|
| Promoters | 9 to 10 | Loyal fans who recommend you |
| Passives | 7 to 8 | Satisfied but easy to lose |
| Detractors | 0 to 6 | Unhappy and likely to warn others |
Add repeat purchase rate where you have sales data.
Competitive position metrics
Position shows how you compare with rivals. Build competitors into the survey from the start, because these metrics need their data.
- Share of voice: your share of all brand mentions in your category.
- Market share: your share of category sales.
- Consideration: the percent of buyers who would consider purchasing from you.
Internal signals
Employees shape brand reputation too. Employee engagement and employer reviews can predict service quality and public sentiment. Track them if your brand depends on frontline staff, such as in hospitality or retail.
How do you set up brand health tracking step by step?
Setting up a brand health tracker takes seven steps. Follow them in order, because each step depends on the one before it.
- Set one clear goal.
Examples are “grow unaided awareness among adults 25 to 44” or “protect NPS after a price rise.” - Define your audience.
Choose your category buyers, not just your customers. You need non-customers to measure awareness. - Pick 5 to 8 metrics.
Use the groups above. Fewer metrics make cleaner trends. - Choose your competitors.
Include three to five rivals in every question set. - Run a baseline wave.
A wave is one round of fielding the survey, and this first one becomes your benchmark. Do not change the questions afterward. - Add always-on listening.
Connect review sites and social channels so you see issues between survey waves. - Report and assign owners.
Set action thresholds, such as “investigate if NPS drops 5 points.” Name one owner per metric.
Keep the question wording identical across waves. Even a small rewrite can move scores and break your trend.
How big should your sample be, and how often should you track?
Use at least 400 respondents per wave for a rough read, and 1,000 for a reliable one. Track quarterly for most categories, and monthly if your market moves fast.
Sample size sets your margin of error, which is the range your true result likely falls within. The figures below assume a 95% confidence level and a worst-case 50% result. For the method, see QuestionPro’s guide to sample size determination.
| Respondents per wave | Margin of error | Best for |
|---|---|---|
| 400 | About ±4.9 points | Directional reads, small niches |
| 800 | About ±3.5 points | Mid-size brands |
| 1,000 | About ±3.1 points | National US trackers |
Subgroups shrink fast. A 1,000-person wave split into four age bands leaves about 250 per band, with a margin near ±6.2 points. Size your sample for your smallest key segment.
| Category speed | Suggested cadence | Example |
|---|---|---|
| Slow | Twice a year | Mattresses, appliances |
| Moderate | Quarterly | Banking, insurance, apparel |
| Fast | Monthly | Food delivery, consumer apps |
| Any | Always-on listening | Review and social monitoring |
Run an extra wave around product launches, big campaigns, and any public incident.
What does brand health tracking look like in practice?
Three short scenarios show how a tracker changes decisions. The numbers below are illustrative, not from a real company.
Scenario 1: Catching a slow decline
A US meal-kit brand sees a quiet decline that sales data hides.
- Signal: Unaided awareness slides from 18% to 14% over two quarters, while NPS stays flat.
- Cause: A rival outspends the brand in streaming ads.
- Action: The team shifts budget before customer acquisition slows.
Scenario 2: Proving a campaign worked
A regional bank runs a spring campaign. It compares the pre-campaign wave with a post-campaign wave among the same target group. Consideration rises 6 points among adults 25 to 34 and stays flat elsewhere. The bank keeps the channel mix for that group and cuts spend on the others.
Scenario 3: Measuring a crisis
A restaurant chain faces a food safety headline, and the tracker shows the damage in stages.
- Day 1: Social sentiment turns negative, so the team pauses promotions and publishes a statement.
- Weeks 1 to 4: Weekly pulses show trust falling 11 points, so the team shares inspection results openly.
- Weeks 5 to 10: Trust recovers to its prior level, so ads and loyalty offers restart.
What are the best brand health tracker tools?
The best brand health tracker depends on whether you need survey data, social listening, or both. The eight tools below cover each type. We checked pricing against vendor pages in October 2026, so confirm current rates before you buy.
| Tool | Type | Best for | Published pricing |
|---|---|---|---|
| QuestionPro | Survey plus reputation | Survey trackers with open-text analysis | See vendor |
| Qualtrics | Survey | Teams already on an experience suite | See vendor |
| YouGov BrandIndex | Survey (syndicated) | Daily brand health data | See vendor |
| Tracksuit | Survey | Growing brands wanting always-on tracking | Subscription |
| Brandwatch | Social listening | Consumer research at scale | Not published |
| Talkwalker | Social listening | Global social and visual listening | See vendor |
| Brand24 | Social listening | Small teams tracking mentions | From $199 a month |
| Awario | Social listening | Budget-friendly monitoring | From $29 a month |
1. QuestionPro
QuestionPro suits teams that want to run their own survey tracker and read the open-ended answers at scale. Its Market Research Software combines survey tools, dashboards, and text analytics.
- Best for: Repeatable survey trackers with open-text analysis.
- Watch for: Social listening needs a separate tool for broad coverage.
2. Qualtrics
Qualtrics offers brand tracking inside a broader experience management suite. It fits large organizations that already run customer or employee programs there. Expect an enterprise sales process.
3. YouGov BrandIndex
YouGov BrandIndex provides syndicated daily brand health data across many brands. Syndicated means the same shared dataset is sold to many subscribers. You buy access to ongoing data rather than running your own surveys.
- Best for: Daily competitor comparisons across a whole category.
- Watch for: YouGov ranks its own product first in its 2026 brand tracking guide, so weigh that view with care.
4. Tracksuit
Tracksuit targets growing brands that want always-on tracking without a custom research project. It uses subscription pricing. Ask about category coverage and sample sizes before you commit.
5. Brandwatch
Brandwatch Consumer Research analyzes online conversations from more than 100 million sources. It includes an AI assistant called Iris and an archive of posts dating back to 2008.
- Best for: Large-scale conversation research.
- Watch for: Brandwatch lists no prices, so you must request a quote.
6. Talkwalker
Talkwalker focuses on global social and visual listening. It suits brands with large international audiences. Pricing is quote-based, so request a demo to compare it with rivals.
7. Brand24
Brand24 tracks mentions across social media and the web. Higher tiers add mentions and keywords, and a 14-day free trial is available.
- Pricing: The pricing lists an Individual plan at $199 a month on annual billing, or $249 per month to month. It includes 2,000 mentions and 3 keywords.
- Watch for: Older reviews quoting $79 a month are out of date.
8. Awario
Awario offers social listening at a lower entry price. Its pricing shows a Starter plan at $49 a month, with a discounted rate of $29, covering 3 topics and 30,000 mentions. It offers a free Starter trial. It is a strong fit for small teams that need alerts, not survey depth.
How do you choose the right brand health tracker?
Choose by matching the tool type to your main question, then check budget, data quality, and reporting. Start with the question, not the feature list.
Use this decision guide:
| If you need to know… | Choose | Why |
|---|---|---|
| Why awareness or preference moved | Survey-based tracker | Surveys capture reasons and non-customers |
| What people are saying today | Social listening tool | Mentions arrive in near real time |
| How you compare to rivals daily | Syndicated tracker | Shared data covers many brands |
| Both of the above | Survey tracker plus listening | Each covers the other’s blind spot |
Then test each shortlisted tool on five criteria:
- Methodology: Ask how it samples and screens respondents.
- Audience fit: Confirm it reaches your US buyers, not just general consumers.
- Speed: Check how fast new data reaches your dashboard.
- Explanatory power: Look for text analysis that tells you why a score moved.
- Total cost: Add panel fees, seats, and setup, not only the license.
How does QuestionPro work as a brand health tracker?
QuestionPro lets you run a repeatable brand tracking survey and read the results in one place. You build the question set once, field it each wave, and compare waves on a dashboard.
Four capabilities matter for this job:
- Repeatable surveys.
Reuse the same awareness, perception, and NPS questions every wave, so trends stay comparable. - Panel reach.
QuestionPro Audience can source US consumer groups when you need respondents beyond your customer list. - Open-text analysis.
Text AI groups open-ended answers into topics and sentiment, so “why did trust drop?” gets a quick answer. - Review monitoring.
CX Reputation gathers reviews from sites such as Google, Yelp, and Trustpilot, with AI sentiment analysis.
Together, these cover both the survey layer and the live conversation layer. Pair them with a social listening tool if you also need broad social coverage.
What are the most common brand health tracking mistakes?
The most common mistakes are changing questions between waves, tracking too many metrics, and ignoring non-customers. Each one weakens your trend line or hides the real problem.
- Rewording questions: Small edits shift scores and break comparisons.
- Surveying only customers: You will overstate awareness and miss why others ignore you.
- Skipping competitors: A score without a rival benchmark has no context.
- Using samples that are too small: A 3-point change on 200 respondents is noise.
- Tracking vanity metrics: Likes and follower counts rarely predict purchase.
- Reporting without owners: Metrics need a named person and an action threshold.
Brand health is a trend, not a snapshot
A single reading tells you where you stand. A tracker tells you where you are heading, and that is the number leaders need.
Start small, and add listening and extra segments once the first trend line proves its value. A workable first month looks like this:
- Week 1: Pick one goal and five metrics.
- Weeks 2 to 3: Write the question set and field the baseline wave.
- Week 4: Set action thresholds and name an owner for each metric.
The brands that stay healthy are not the ones with the highest score today. They are the ones that notice a change early and respond before it spreads.
Frequently Asked Questions (FAQs)
A brand health tracker measures perception through repeated surveys of a defined audience. A social listening tool monitors public posts and reviews. Surveys reach non-customers and explain why opinions change, while listening shows live reactions. Most teams need both.
Costs range widely. Social listening tools publish entry plans from about $29 to $199 a month. Survey trackers usually depend on sample size, markets, and wave frequency, so vendors quote custom prices. Always add panel fees to the license cost.
Yes. Run a quarterly survey of 400 category buyers, add free review alerts, and track three metrics: unaided awareness, NPS, and sentiment. Entry-level listening tools add mention tracking. Keep the questions identical every wave so your small dataset still shows a clear trend.
NPS ranges from negative 100 to positive 100. Scores above zero mean more promoters than detractors. Benchmarks vary by industry, so compare yours with direct competitors and your own past waves. The direction of your trend matters more than one number.
Watch for falling unaided awareness, rising negative sentiment, a shrinking share of voice, and slipping NPS. Also watch for slower customer acquisition and higher churn. Two or more signals moving the wrong way across consecutive waves call for investigation.