An eNPS score calculator turns a stack of survey responses into one clear number. That number shows how likely your employees are to recommend your company as a place to work. You enter how many people gave each score from 0 to 10. The calculator handles the grouping, the math, and the labeling for you.
Employee Net Promoter Score (eNPS) is a single-question metric adapted from customer Net Promoter Score. It sorts every response into a promoter, a passive, or a detractor. Then it reduces the whole group into one figure between -100 and +100. That figure becomes a fast, repeatable way to track sentiment, compare teams, and catch problems before they turn into resignations.
This guide breaks down how the eNPS formula works. It walks through a full worked example. It also covers what counts as a good score, the mistakes that quietly distort your results, and what to do once you have a number in hand.
What is an employee net promoter score (eNPS)?
Employee Net Promoter Score (eNPS) is a single-question survey metric. It measures how likely employees are to recommend their employer as a place to work, expressed as a number from -100 to +100.
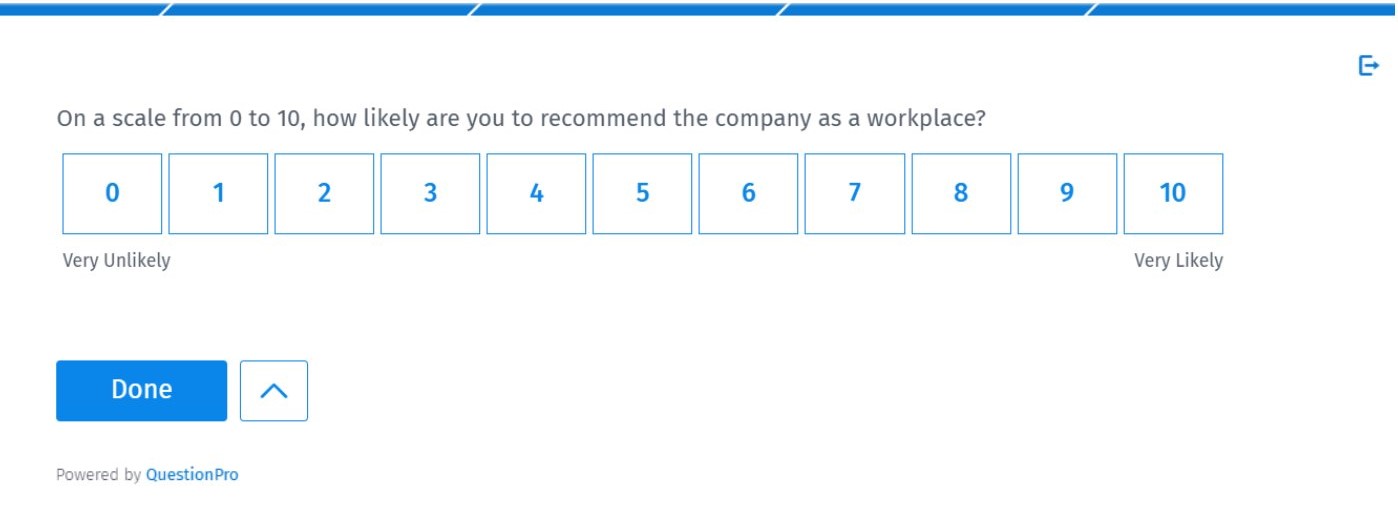
The standard question reads: “On a scale of 0 to 10, how likely are you to recommend this company as a place to work?” Every response gets sorted into one of three groups:
- Promoters (score 9-10): Loyal employees who actively speak well of the company.
- Passives (score 7-8): Satisfied but unenthusiastic employees who rarely advocate either way.
- Detractors (score 0-6): Disengaged employees who are more likely to speak negatively about the company or leave.
Passives count toward your total response pool. They still drop out of the final calculation entirely. Only the promoter and detractor percentages determine your score. That’s what makes eNPS quick to calculate and easy to explain to leadership.
Employee Net Promoter Score Calculator
To make the process easier for you, we’ve created this eNPS score calculator that allows you to quickly and freely calculate your Employee Net Promoter Score. You just need to enter the collected data into the calculator below, and you’ll immediately see your score.
Now that you have your eNPS, it’s essential to compare it with other companies’ results or your industry benchmark to understand how well you’re doing. For that, we recommend our study: eNPS Industry Benchmarks 2025.
How to calculate employee net promoter score (eNPS)
eNPS equals the percentage of promoters minus the percentage of detractors. Passives are excluded from the subtraction.

eNPS = % Promoters – % Detractors
Follow these steps to get from raw responses to a final score:
- Collect every response to the 0-10 question.
- Sort responses into promoters (9-10), passives (7-8), and detractors (0-6).
- Divide each group’s count by the total number of responses, then multiply by 100 to get a percentage.
- Subtract the detractor percentage from the promoter percentage.
Here’s what that looks like with real numbers. Say 200 employees respond to your survey. 120 give a 9 or 10, 50 give a 7 or 8, and 30 give a 6 or below. Promoters make up 60% of responses (120 divided by 200). Detractors make up 15% (30 divided by 200). Subtract the two: 60 minus 15 equals 45. That company’s eNPS is 45, a strong result compared with most industries.
eNPS vs. NPS vs. Employee engagement score: What’s the difference?
These three terms get used interchangeably, but they measure different things. They shouldn’t be treated as substitutes for each other.
| Metric | What it asks | What it measures | Typical range |
|---|---|---|---|
| eNPS | How likely are you to recommend this company as a place to work? | Employee loyalty and advocacy | -100 to +100 |
| NPS (customer) | How likely are you to recommend this product or company to a friend? | Customer loyalty and advocacy | -100 to +100 |
| Employee engagement score | A multi-item survey covering purpose, growth, recognition, and manager support | Emotional commitment and day-to-day effort | Usually 0-100% |
eNPS is a single question and a leading indicator. A full engagement score takes longer to collect, but it explains the “why” behind a rising or falling eNPS. Most HR teams run both: eNPS for frequent pulse checks, and a fuller engagement survey once or twice a year.
How to use this eNPS score calculator
Enter the number of responses you received for each score, 0 through 10, into the calculator above. It totals your responses automatically. It sorts them into promoters, passives, and detractors, and displays your eNPS instantly, so you don’t need a spreadsheet or a manual formula.
For a reliable company-wide score, keep these two guardrails in mind:
- Aim for at least 50 responses, or a response rate above 60% of your workforce, whichever gives you the larger sample.
- If you plan to break results down by department or location, make sure each segment has at least 20 to 30 responses on its own.
Smaller segments produce scores that swing wildly with just one or two changed answers. That makes them unreliable for decision-making.
What is a good eNPS score?
A good eNPS score is anything above 0, since that means you have more promoters than detractors. What counts as strong still varies by industry and company size.
As a general guide, scores from 10 to 30 are considered healthy, 30 to 50 is strong, and above 50 is excellent. Below 0 signals more detractors than promoters and calls for immediate attention. QuestionPro’s 2025 eNPS benchmark study surveyed 5,000 full-time employees. It put the overall average eNPS at 32, up from 25 the year before. Information Technology led at 66, while Government trailed at 11.
Context matters as much as the number itself. Broader workforce sentiment has also been under pressure. Gallup’s most recent global data found that only 20% of employees worldwide were engaged at work in 2025. An average eNPS today reflects a genuinely harder engagement environment than it did five years ago. A score of 25 might be excellent for a manufacturing floor and only average for a software company. Always compare against your own sector and past results, not a single global figure. QuestionPro’s culture benchmark dataset, drawn from more than 700,000 responses, breaks down what consistently pushes eNPS up or down across industries.
How to calculate eNPS in Excel
If you would rather build the calculation yourself, Excel handles it in a few steps.
- List every survey response in a single column.
- Use COUNTIFS to count how many responses fall into each bucket: promoters (9-10), passives (7-8), and detractors (0-6).
- Divide the promoter count by the total number of responses and multiply by 100 to get a percentage. Repeat for detractors.
- Subtract the detractor percentage from the promoter percentage to get your eNPS.
This works fine for a one-time calculation. It breaks down as soon as you want to track eNPS by department, compare quarter over quarter, or refresh the number every time new responses arrive. At that point, a dedicated eNPS score calculator or survey platform saves far more time than it costs to set up.
Common mistakes that skew your eNPS results
A few recurring errors quietly distort eNPS scores. They lead teams to act on numbers that don’t reflect reality.
- Surveying too small a group.
With only 8 to 10 responses, one person changing their answer from a detractor score to a promoter score can swing the result by 20 points or more overnight.
- Ignoring passives entirely.
Passives don’t count in the formula, but a growing passive group often signals employees who are one bad quarter away from becoming detractors.
- Skipping the follow-up question.
A score without an open-ended “why” question tells you that something changed, not what to fix.
- Running the survey once and stopping.
A single eNPS reading is a snapshot. The trend across several quarters is what actually predicts turnover.
- Comparing against the wrong benchmark.
A score of 25 in retail and a score of 25 in technology mean very different things. Match your comparison to your own industry and company size.
What to do after you get your eNPS score
Your eNPS score only becomes useful once it changes what you do next. Treat the number as a starting point for action, not a final grade.
- Below 0: Run listening sessions or focus groups within the next few weeks. Identify the top two or three detractor complaints, then act on at least one before the next survey cycle.
- 0 to 29: Identify the single biggest recurring theme in detractor comments. Close the loop with a visible change within one quarter.
- 30 to 49: Protect what’s already working. Expand recognition programs and career-development paths rather than introducing unrelated new initiatives.
- 50 and above: Maintain your current cadence. Lean on promoters for referral programs and employer-branding stories, since they’re your most credible internal advocates.
eNPS gives you a group-level pulse, not individual-level detail. For teams that want to go deeper on a specific person’s performance or growth areas, a 360-degree feedback cycle on the same survey platform fills that gap without introducing a second, disconnected tool.
Real-time eNPS tracking with QuestionPro Employee Experience
Calculating a single eNPS score is a fine starting point. Most teams eventually need to track it continuously across departments, locations, and time. That’s where a dedicated platform earns its place. QuestionPro Employee Experience collects that feedback and turns it into a live view of sentiment, rather than a one-time snapshot.
With QuestionPro Employee Experience, you can:
- Segment eNPS results by department, location, or tenure to find exactly where sentiment is dropping.
- Visualize loyalty trends on live dashboards instead of rebuilding a spreadsheet every quarter.
- Distribute the eNPS question through email, mobile app, or QR code, which matters for frontline or warehouse employees who don’t sit at a desk.
- Sync results with existing HR tools so eNPS trends sit alongside turnover and performance data, instead of living in a separate spreadsheet.
Your eNPS score is a starting point, not a finish line
A single eNPS number, whether it’s 45 or -10, tells you almost nothing on its own. What matters is what you do with it. Dig into the comments behind a low score. Protect the habits behind a high one.
Keep measuring often enough to catch changes before they turn into resignations. Treat the eNPS score calculator as the fastest way to get that first number, then build the follow-up process around it.
Frequently Asked Questions (FAQs)
Not necessarily. A score of 0 means promoters and detractors are equal, a neutral baseline rather than a failure. Company size shifts this further: benchmark data shows smaller organizations average an eNPS near 30, while companies over 5,000 employees average closer to 9.
Aim for at least 30 to 50 responses before treating a score as directionally reliable. Smaller samples carry a wide margin of error. A score built on 10 responses can shift 20 or more points from one changed answer, so treat those numbers as provisional.
No. eNPS is a fast pulse metric that flags whether sentiment is rising or falling. It doesn’t explain drivers like manager support, growth opportunities, or workload. Most HR teams pair frequent eNPS pulses with a deeper engagement survey once or twice a year.
Quarterly is the most common cadence, though some teams add lighter monthly pulses during periods of change. Gallup’s most recent US data put employee engagement at a decade low of 31%, a decline steep enough that waiting a full year between surveys risks missing it.
Anything below 0 signals more detractors than promoters and warrants a closer look. One low reading isn’t automatically a crisis. What matters more is the direction: a score climbing from -10 toward 0 reflects real progress, even while still negative.