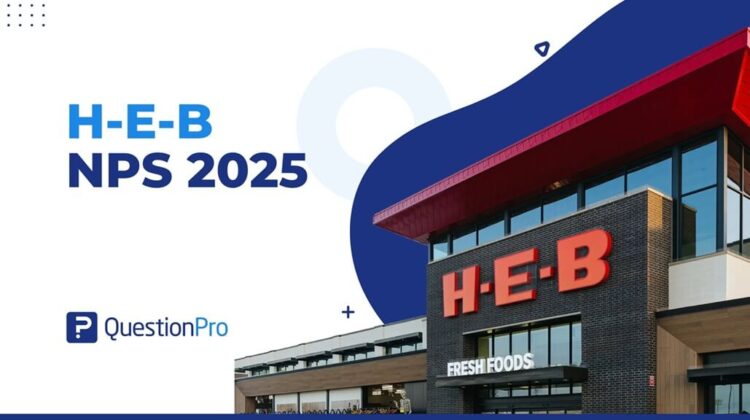
H-E-B’s NPS in 2025 is 63, according to QuestionPro’s Q1 2025 Benchmarking NPS and CSAT Report. That is nearly double the grocery industry’s average score of 37, and it helps explain why the Texas-based grocer keeps showing up at the top of national loyalty rankings.
Net Promoter Score is one of the clearest ways to see how customers actually feel about a brand, beyond star ratings or complaint counts. A single number captures whether shoppers are loyal enough to recommend a store to a friend, or frustrated enough to warn them away.
This article breaks down H-E-B’s 2025 NPS and CSAT scores, what is driving them, and how any customer experience team can apply the same measurement approach to its own brand.
What is H-E-B’s NPS score in 2025?
H-E-B’s Net Promoter Score in 2025 is 63, based on QuestionPro’s Q1 2025 Benchmarking NPS and CSAT Report, which surveyed 1,000 U.S. consumers about their grocery shopping experience. That score sits far above the grocery industry’s average of 37 for the same quarter.
Net Promoter Score (NPS) measures customer loyalty with one question: how likely a customer is to recommend a brand to a friend or colleague, scored from 0 to 10. Respondents are sorted into promoters, passives, and detractors, and the final score is the percentage of promoters minus the percentage of detractors, landing somewhere between -100 and 100.
A score of 63 places H-E-B in the range most CX practitioners consider excellent. Most industries treat anything above 50 as a strong sign of customer loyalty.
H-E-B’s promoters, passives, and detractors in 2025
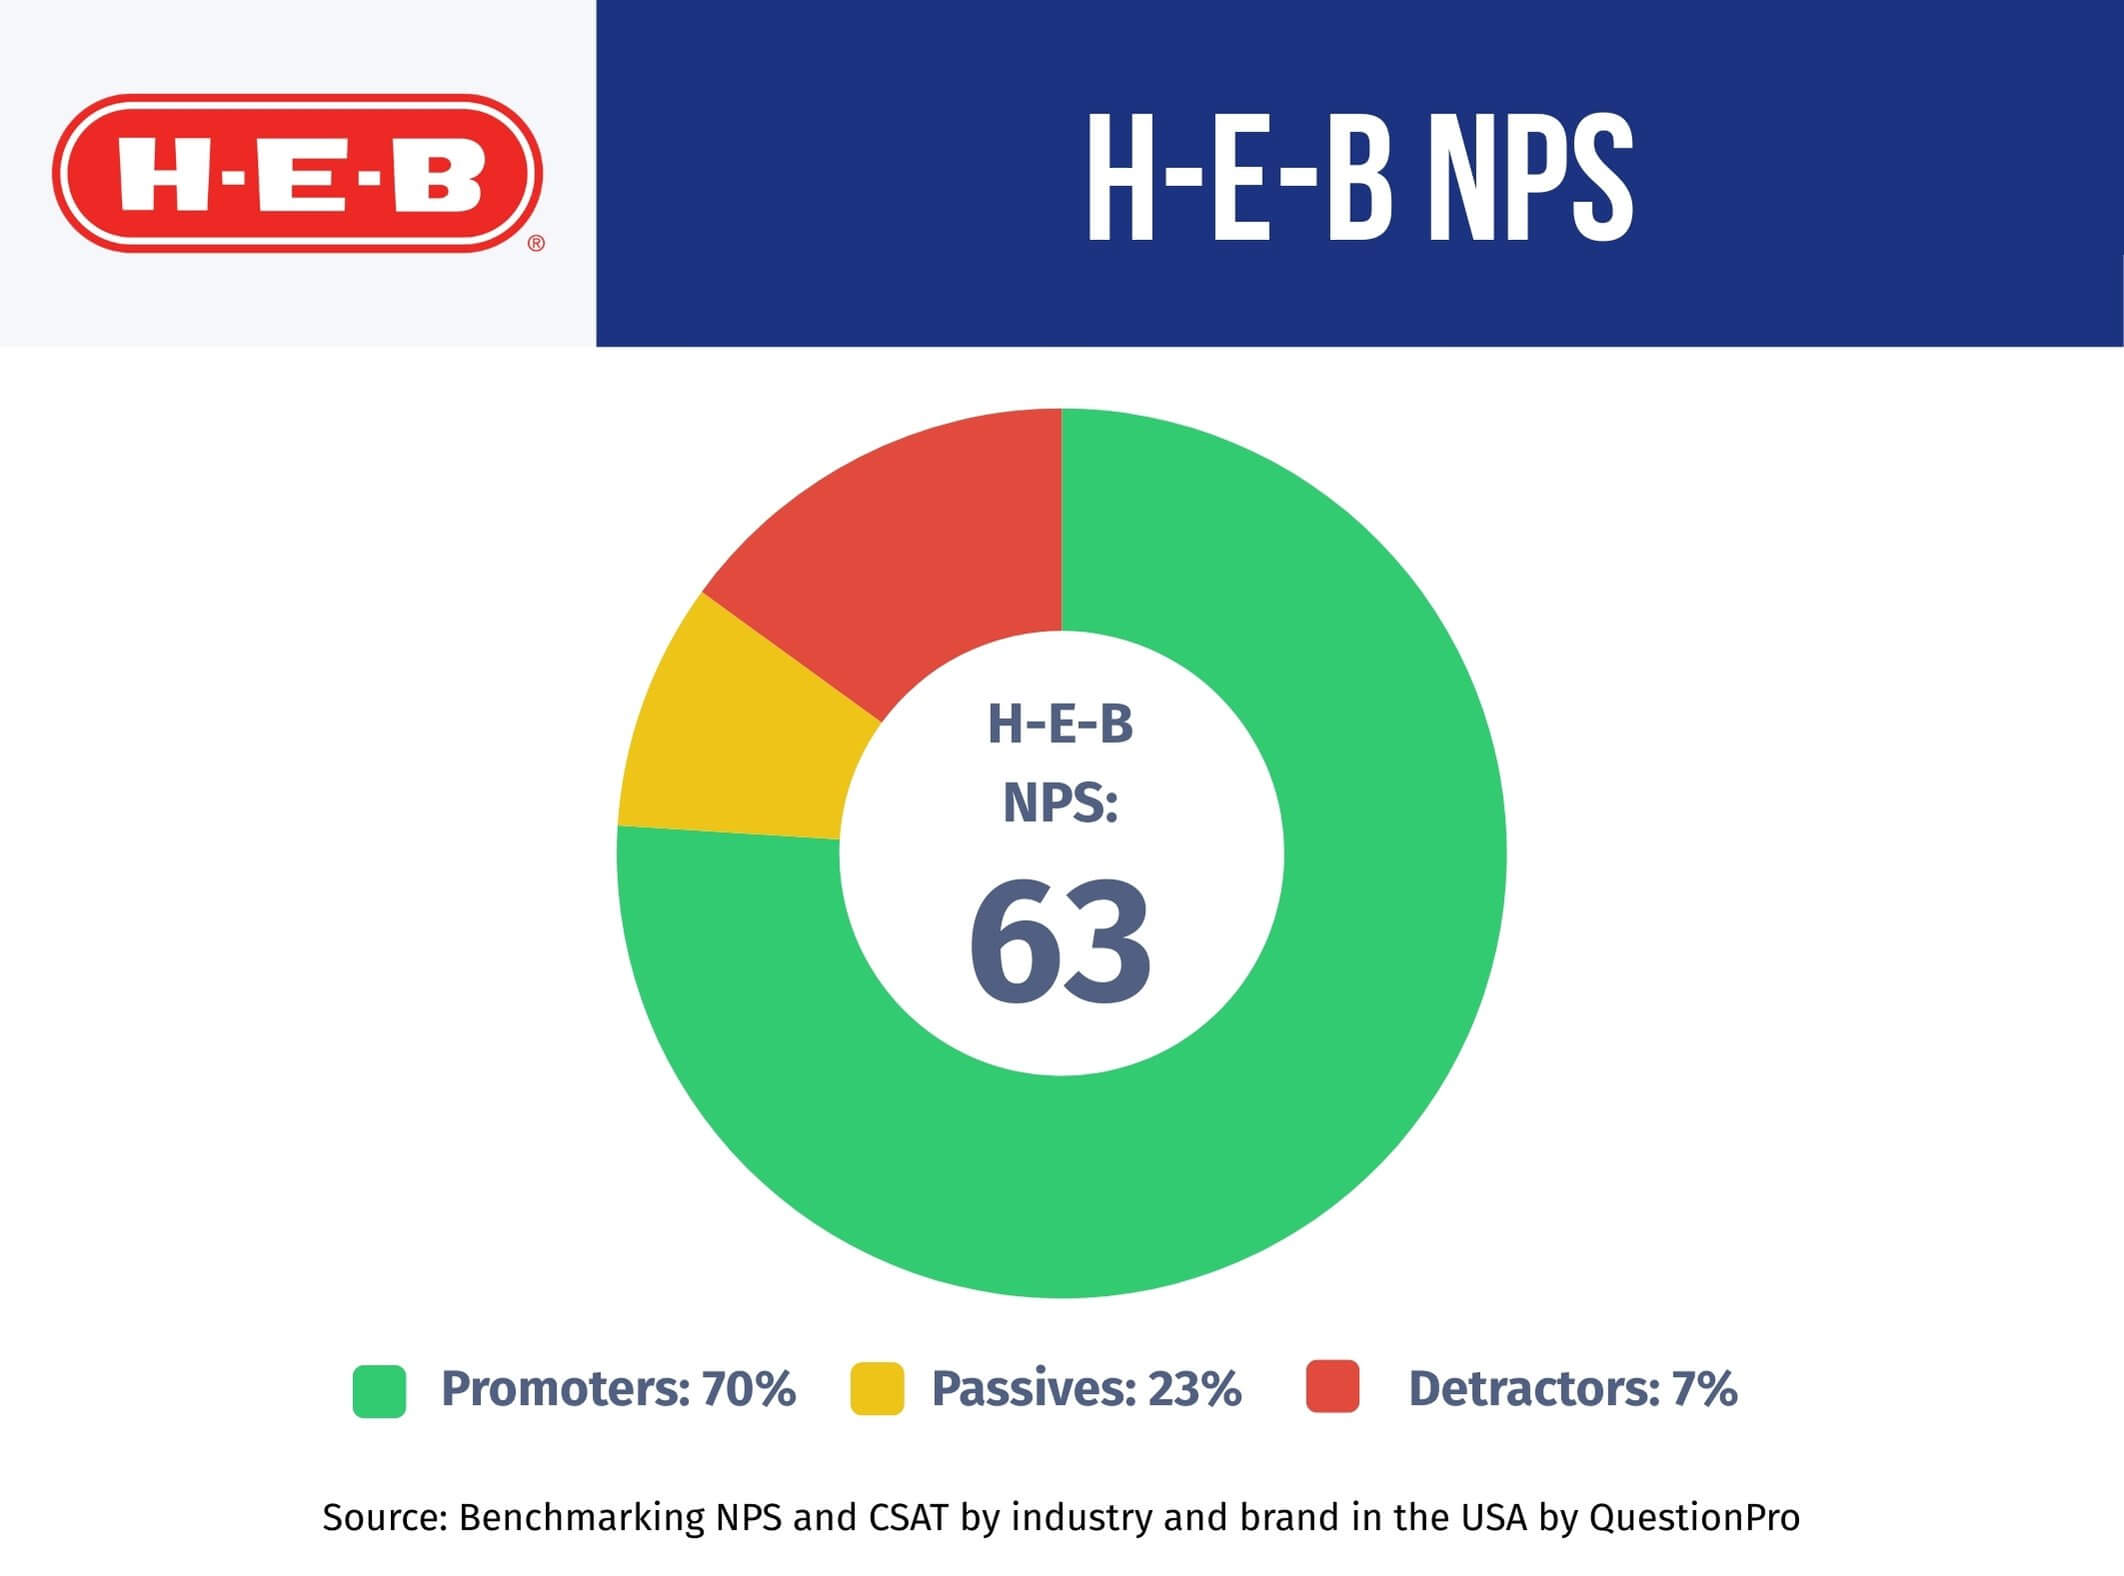
H-E-B’s overall score comes from how respondents split across the three NPS groups. The breakdown below shows why the final number lands so high.
| Group | Score given | Share of H-E-B respondents |
| Promoters | 9 to 10 | 70% |
| Passives | 7 to 8 | 23% |
| Detractors | 0 to 6 | 7% |
Seventy percent of respondents are promoters, more than double the share found at a typical grocery chain, while only 7% fall into the detractor group. That gap between promoters and detractors is what drives strong customer advocacy and repeat visits.
How H-E-B’s NPS compares to other industries
Grocery is not the only sector QuestionPro tracks in its Q1 2025 report. Comparing H-E-B against other industry averages shows just how far ahead the grocer is running.
- Hotel and hospitality: 44
- Banking and credit unions: 41
- Automotive: 41
- Big box retail: 37
- Grocery retail: 37
- Airlines: 33
- Insurance: 23
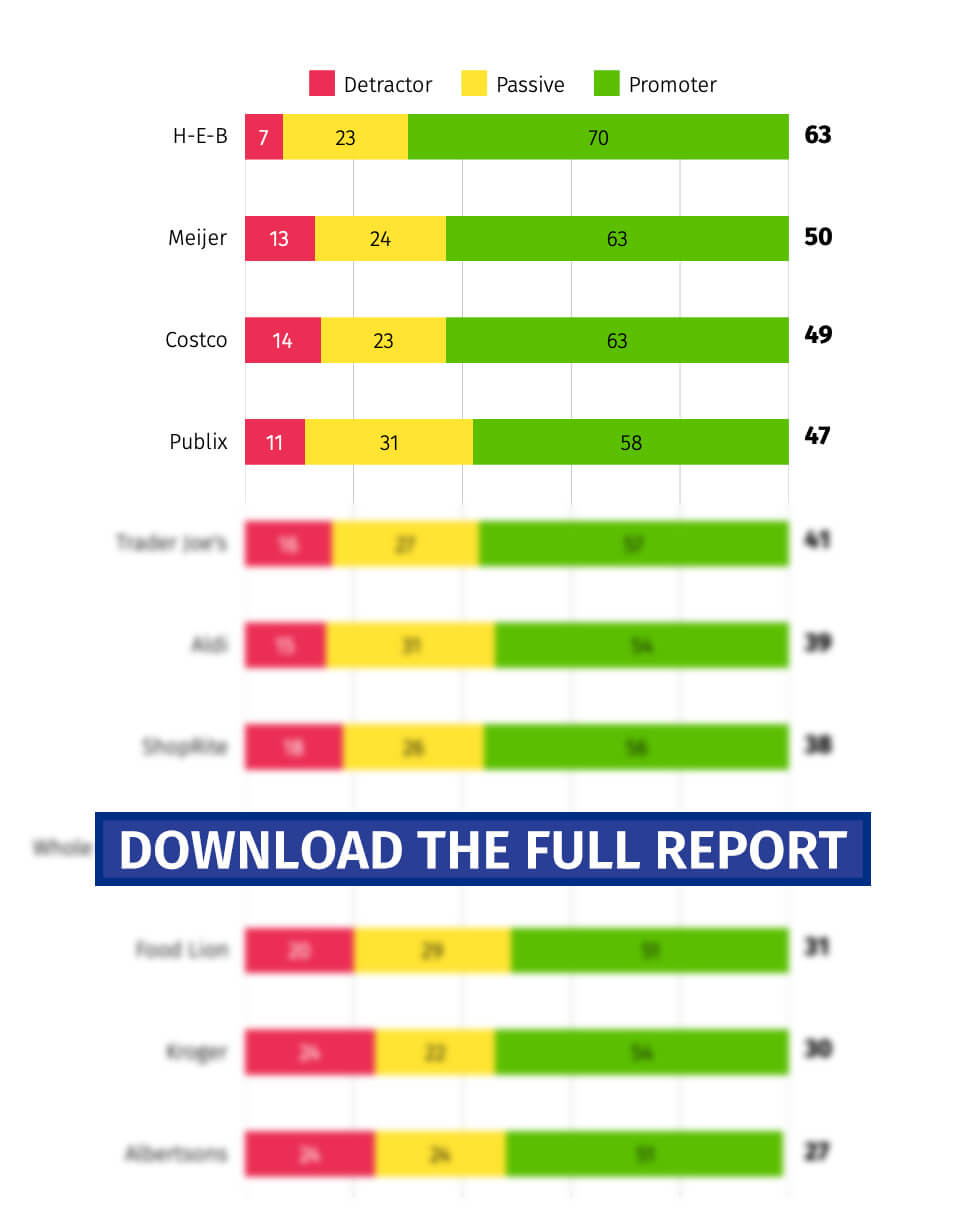
These insights are based on QuestionPro’s latest study, which surveyed 1,000 participants to measure the NPS of various companies and industries. This report reflects real user opinions from Q1 2025 and is updated quarterly.
H-E-B’s score of 63 beats every one of these sector averages, not just its own industry. Businesses outside grocery can still use these figures as a general reference point for what a strong NPS looks like across retail and service categories.
Context matters when judging a single score. A 63 in insurance, where the average sits at 23, would be a remarkable outlier. In grocery, it is still exceptional, but H-E-B shares the top tier with a small group of regional chains that lean heavily on local trust rather than national scale.
NPS vs CSAT: how H-E-B scores on both metrics
NPS and CSAT often get used interchangeably, but they measure different things. NPS asks about long-term loyalty and willingness to recommend a brand, while Customer Satisfaction (CSAT) score measures how happy a customer was with one specific interaction or visit.
H-E-B’s CSAT score in the same Q1 2025 report is 82, on a scale that typically runs from 0 to 100. Pairing a high CSAT with a high NPS suggests H-E-B is not just satisfying customers in the moment. It is converting individual good experiences into long-term loyalty, which is the harder metric to earn.
A brand can have a solid CSAT and still have a mediocre NPS, if customers leave happy but see no reason to actively recommend the store. H-E-B avoids that gap, which is why both numbers are worth tracking side by side rather than picking one.
What’s driving H-E-B’s high NPS score
Five factors show up consistently in the data behind H-E-B’s 2025 score.
A strong emotional connection with Texas shoppers
Many respondents point to H-E-B’s identity as a company that is made, owned, and operated in Texas. That local pride creates an emotional bond that is difficult for national chains to replicate, especially among longtime residents.
Consistent performance across demographics
H-E-B’s NPS holds up across customer groups, with some variation. Female shoppers rate the brand about 3 points higher than male shoppers, and Asian or Pacific Islander customers report the highest scores of any group tracked. Customers who have shopped at H-E-B for 2 to 5 years show the strongest customer loyalty, suggesting satisfaction builds with tenure rather than fading.
High customer satisfaction and service quality
An 82 CSAT score reflects consistent, positive in-store experiences. Shoppers frequently cite reliable stock availability and staff professionalism as reasons they keep coming back.
Perceived value for money
Perceived return on H-E-B’s pricing varies by customer segment. Respondents working in mechanical, civil, and industrial engineering fields rate H-E-B’s value the highest, while those in security and investigations report a lower perceived return, pointing to room for improvement in how the brand communicates value to that segment.
Independent validation from outside research
H-E-B’s strength is not limited to QuestionPro’s data. In dunnhumby’s ninth annual Retailer Preference Index, H-E-B ranked as the top U.S. grocer for the fifth time in nine years, with researchers citing the same mix of value, quality, and emotional connection found in the NPS data.
What H-E-B customers are saying
Verified reviews add color to the numbers, and common themes echo what the data already shows.
- Shoppers frequently say H-E-B’s private-label products, especially snacks, taste better and cost less than national brands.
- Customers highlight friendly greetings at the door and respectful service at checkout as a consistent experience across visits.
- Loyal shoppers mention reliable stock, easy curbside pickup, and steady service quality even during periods of high demand, including during the COVID-19 pandemic.
- A smaller group of reviewers note frustration with store availability outside Texas, which lines up with the regional gaps mentioned later in the FAQ section.
These patterns match the top drivers identified in the NPS data: product quality, service consistency, and a dependable shopping experience. They also show that H-E-B’s high score is not built on a single strength, but on several reinforcing ones.
Common mistakes that lower a grocery brand’s NPS score
H-E-B’s score did not happen by accident, and brands that fall short usually make a few avoidable mistakes.
- Only tracking the score, without asking a follow-up question to understand the reasons behind it.
- Treating passives as safe customers, when they are often one bad experience away from becoming detractors.
- Benchmarking against the wrong industry average, which can make a decent score look worse or better than it really is.
- Failing to close the loop with unhappy customers after they respond to a survey.
- Measuring NPS company-wide without breaking it down by store, region, or customer segment.
Avoiding these mistakes is often what separates a brand that tracks NPS from one that actually improves it.
How to measure and improve your NPS score
Any grocery brand, or a business in another category, can apply the same measurement process behind H-E-B’s data.
- Start with an NPS survey.
Use a ready-made NPS survey template with the standard 0 to 10 question, then add a follow-up question asking customers why they gave that score. - Share the survey widely.
Distribute it through email, SMS, QR codes, or a link at checkout to reach a representative sample of shoppers. - Review results as they come in.
Group responses into promoters, passives, and detractors, and watch for patterns by store location or customer segment. - Act on what you learn.
Prioritize fixes where detractor feedback clusters, and track whether changes move the score over time.
None of these steps require a large research team. A single store manager can run a monthly NPS pulse and get a usable signal within a few weeks, though larger chains typically need a standardized process across every location to compare fairly.
A platform like QuestionPro can automate this process end to end, from sending the survey to calculating the score and flagging where to focus next.
What H-E-B’s 2025 score means for your CX strategy
H-E-B’s 63 NPS is not just a number to admire. It is proof that consistent service, a clear local identity, and genuine follow-through on customer feedback compound over time into real loyalty.
Any brand chasing a similar score should treat the 37-point grocery average as a floor, not a target, and look at H-E-B’s approach as a working example of what is possible above it. The lesson scales beyond grocery too, since the same combination of consistency, local relevance, and closed-loop feedback drives loyalty in almost any customer-facing category.
Teams that want to run the same kind of benchmarking can start with a Customer Experience management platform built to track NPS, CSAT, and the feedback loop together.
Stay Ahead with the Latest NPS Insights
Get the Q1 2025 NPS Benchmark Report and discover how leading brands are keeping their customers loyal.
Looking to improve your NPS? Contact the experts at QuestionPro for personalized guidance on measuring and improving customer satisfaction.
Frequently Asked Questions (FAQs)
Historical data suggests yes. A 2015 Temkin Group benchmark study found H-E-B among a small group of grocers scoring 55 or higher, showing the brand has sustained strong loyalty for roughly a decade rather than spiking in a single quarter.
Third-party tracking from Comparably placed H-E-B first among grocery competitors for NPS, with Costco and Amazon following behind. Rankings vary slightly by source and methodology, but H-E-B consistently lands at or near the top of grocery loyalty comparisons.
QuestionPro’s Benchmarking NPS and CSAT Report is refreshed quarterly, using new survey waves of U.S. consumers each time. That means H-E-B’s score, along with every other brand and industry average in the report, can shift from one quarter to the next.
Yes. Feedback shows strong loyalty in markets where H-E-B has a long-standing presence, while some customers in cities without a nearby store, such as El Paso, express disappointment over limited access, which can affect regional perception even when overall loyalty stays high.
In grocery, scores above 37 beat the industry average, and anything above 50 is generally considered excellent. H-E-B’s 63 places it well into the range CX practitioners treat as world-class for a retail category.
H-E-B isn’t the only company in the grocery retail industry with valuable lessons for those looking to improve their customer service and experience. Below, we recommend a few articles where you can learn how other major brands manage to maintain a high NPS and a loyal customer base — you’ll surely find some useful insights along the way.