• Skip to main content
  • Skip to primary sidebar
  • Skip to footer
QuestionPro

QuestionPro

questionpro logo
  • Products
    survey software iconSurvey softwareEasy to use and accessible for everyone. Design, send and analyze online surveys.research edition iconResearch SuiteA suite of enterprise-grade research tools for market research professionals.CX iconCustomer ExperienceExperiences change the world. Deliver the best with our CX management software.WF iconEmployee ExperienceCreate the best employee experience and act on real-time data from end to end.
  • Solutions
    IndustriesGamingAutomotiveSports and eventsEducationGovernment
    Travel & HospitalityFinancial ServicesHealthcareCannabisTechnology
    Use CaseAskWhyCommunitiesAudienceContactless surveysMobile
    LivePollsMember ExperienceGDPRPositive People Science360 Feedback Surveys
  • Resources
    BlogeBooksSurvey TemplatesCase StudiesTrainingHelp center
  • Features
  • Pricing
Language
  • English
  • Español (Spanish)
  • Português (Portuguese (Brazil))
  • Nederlands (Dutch)
  • العربية (Arabic)
  • Français (French)
  • Italiano (Italian)
  • 日本語 (Japanese)
  • Türkçe (Turkish)
  • Svenska (Swedish)
  • Hebrew IL (Hebrew)
  • ไทย (Thai)
  • Deutsch (German)
  • Portuguese de Portugal (Portuguese (Portugal))
Call Us
+1 800 531 0228 +1 (647) 956-1242 +52 999 402 4079 +49 301 663 5782 +44 20 3650 3166 +81-3-6869-1954 +61 2 8074 5080 +971 529 852 540
Log In Log In
SIGN UP FREE

Home Audience

Top 10 Infographics of December 2017

As an industry leader in market research, people look to us for thought-provoking content. We love sharing insightful data with our readers, so we curated a list of our top 10 favorite projects from the month of December. Enjoy!

Select your respondents

1 – Comparing the World’s Money & Markets

By: The Money Project

image
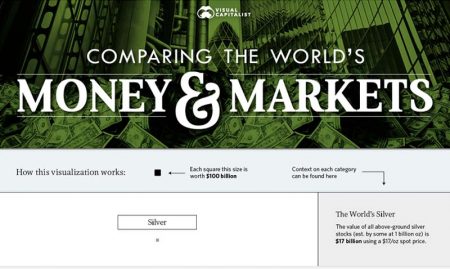
Imagine the amount of detail that went into an infographic that took two years to make. In 2015, The Money Project created an infographic as a way of simplifying currencies, assets and other financial instruments in a way people can understand, and it evolved into a new way to understand the vast universe of global assets. How much money exists? How much does the top 1% really have? What are global assets? Prepared to be blown away by all the money that you do not have.

2 – Best of Prime 2107

By: Amazon

image
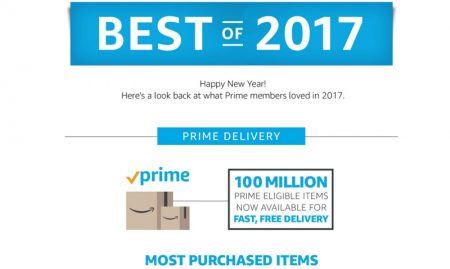
This infographic features a compilation of all the data you’ve always wanted to know when it comes to Jeff Besos’ e-commerce giant. From Echo Dots, to the most played artists, songs, and movies, Amazon detailed it all. Also, FYI, people really love their Instant Pots.

3 – Mapping Slavery Against US Incarceration

By: Slavery Data/Mapping: Bill Rankin, Code/Story: Matt Daniels

image
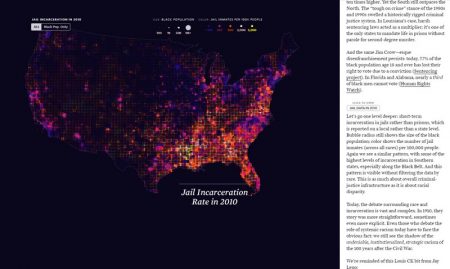
Every now and then we come across reports that completely blow us away. And those reports are usually created by the Pudding, a visual essay website with impressively detailed insights. Most recently, the team analyzed how incarceration rates in the U.S. differ between slave states and non-slave states. It’s a compelling report we couldn’t get enough of.

4 – The Evolution of the Retail Shopper

By: CardConnect

imageRetail shopping during the holiday season has been the subject of many infographics, but CardConnect’s take on how mobile is impacting the retail industry provides a breath of fresh air to a stale topic.

5 – Youtube: The Video Giant

By: Filmora

image
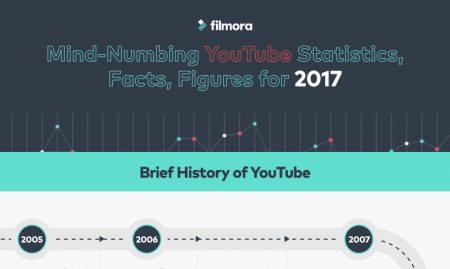
You’ve heard of Youtube, but do you know the data behind it? This infographic starts with a brief history of the video sharing platform, and closes with mind-blowing stats about 2017 such as  “1 billion hours of YouTube are watched per day”.

6 – Visualizing the Journey to $10,000 Bitcoin

By: Blockchain Intelligence Group

image 

We recently posted a blog about bitcoin and the craze that surrounds the cryptocurrency market. The Blockchain Intelligence Group breaks down the cryptocurrency’s monumental rise from less than $1,000 to $10,000 in just 11 months.

7 – The Percentage of World Debt (By Country)

By: Jeff Desjardins

image
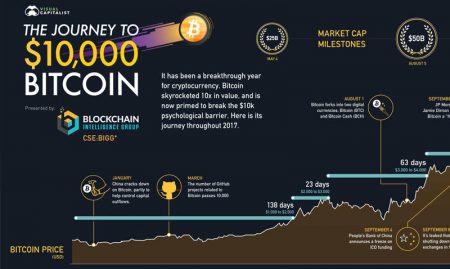
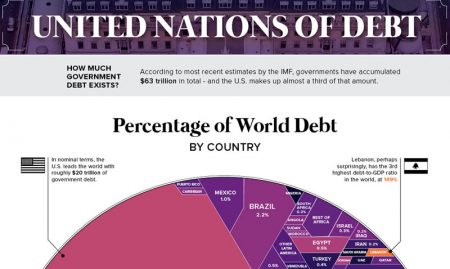
Have you ever wondered what $63 trillion in debt looks like? Here’s a hint: it looks a lot like the United States.

8 – 2017: The Year in Pharmacy

By Dawn Connelly, Pharmaceutical Journal
image
It’s fair to say that the pharma industry has had a tumultuous year. In December, the Pharmaceutical Journal detailed every major event throughout 2017 in a clean and easy-to-follow format.

9 – Walmart’s Top Selling Items of 2017

By: Walmart.com

imageA good map-graphic is always an interesting read when it comes to trends in consumer insights. So when one of the world’s top-selling companies created one, we tuned in to learn something new—and we learned that the most purchased item in Illinois are erasers. With a revenue of $482B in 2016, it’s safe to say Walmart knows what they’re talking about.

10 – Land of the Free and Home of the Taxed?

By: QuestionPro Audience

image
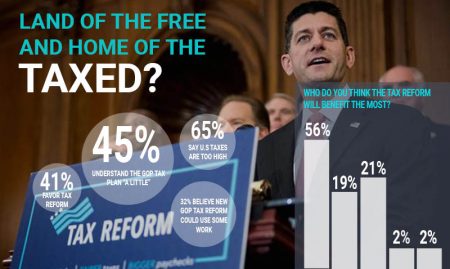
The call to reform the tax code was one of President Trump’s biggest promises during the 2016 presidential campaign, and after much debate and fanfare, the Senate passed the proposal, 51-49, marking the first time in 27 years the tax code has been substantially changed. The tax reform bill has been covered by every news channel and political reporter, but how do the American people feel about it? We conducted our own research with our registered voter panel and detailed the responses in a 16-page report, which you can download here.

SHARE THIS ARTICLE:

About the author
Rudly Raphael
Rudly has more than 15 years of experience in the market research industry, implementing primary and secondary research for a number of high profile clients. He's a frequent blogger and has published a number of articles in various online journals, magazines, and other publications.
View all posts by Rudly Raphael

Primary Sidebar

Unlock the Power of Research with QuestionPro Audience

Gain insights from more than 22 million high-quality respondents around the globe

Get a Free Quote Now!

RELATED ARTICLES

HubSpot - QuestionPro Integration

Organizational Trust: What it is & How to Build It

Aug 06,2022

HubSpot - QuestionPro Integration

Perception Survey: Types, Sample Questions & Templates

Jul 06,2022

HubSpot - QuestionPro Integration

Synthetic Data Benefits: Using the Power of Synthetic Data

Sep 19,2023

BROWSE BY CATEGORY

  • Academic
  • Academic Research
  • Artificial Intelligence
  • Assessments
  • Audience
  • Brand Awareness
  • Business
  • Case Studies
  • Communities
  • Consumer Insights
  • Customer effort score
  • Customer Engagement
  • Customer Experience
  • Customer Loyalty
  • Customer Research
  • Customer Satisfaction
  • CX
  • Employee Benefits
  • Employee Engagement
  • Employee Engagement
  • Employee Retention
  • Enterprise
  • Events
  • Forms
  • Friday Five
  • General Data Protection Regulation
  • Guest Post
  • Insights Hub
  • Life@QuestionPro
  • LivePolls
  • Market Research
  • Marketing
  • Mobile
  • Mobile App
  • Mobile diaries
  • Mobile Surveys
  • New Features
  • non-profit
  • NPS
  • Online Communities
  • Polls
  • Question Types
  • Questionnaire
  • QuestionPro
  • QuestionPro Products
  • Release Notes
  • Research Tools and Apps
  • Revenue at Risk
  • Startups
  • Survey Templates
  • Surveys
  • Tech News
  • Tips
  • Training
  • Training Tips
  • Trending
  • Tuesday CX Thoughts (TCXT)
  • Uncategorized
  • VOC
  • Webinar
  • Webinars
  • What’s Coming Up
  • Workforce
  • Workforce Intelligence

Footer

MORE LIKE THIS

albertsons-companies-nps-2025

Albertsons Companies NPS and Insights in 2025

May 23, 2025

data-augmentation

What is Data Augmentation? Methods & Uses in Research

May 22, 2025

livecast a new way to do research

Here’s how LiveCast can help you survive the great Stanley Cup debate of 2025

May 22, 2025

Credit-Unions-NPS-2025

Credit Unions NPS Leading in Loyalty in 2025

May 21, 2025

Other categories

  • Academic
  • Academic Research
  • Artificial Intelligence
  • Assessments
  • Audience
  • Brand Awareness
  • Business
  • Case Studies
  • Communities
  • Consumer Insights
  • Customer effort score
  • Customer Engagement
  • Customer Experience
  • Customer Loyalty
  • Customer Research
  • Customer Satisfaction
  • CX
  • Employee Benefits
  • Employee Engagement
  • Employee Engagement
  • Employee Retention
  • Enterprise
  • Events
  • Forms
  • Friday Five
  • General Data Protection Regulation
  • Guest Post
  • Insights Hub
  • Life@QuestionPro
  • LivePolls
  • Market Research
  • Marketing
  • Mobile
  • Mobile App
  • Mobile diaries
  • Mobile Surveys
  • New Features
  • non-profit
  • NPS
  • Online Communities
  • Polls
  • Question Types
  • Questionnaire
  • QuestionPro
  • QuestionPro Products
  • Release Notes
  • Research Tools and Apps
  • Revenue at Risk
  • Startups
  • Survey Templates
  • Surveys
  • Tech News
  • Tips
  • Training
  • Training Tips
  • Trending
  • Tuesday CX Thoughts (TCXT)
  • Uncategorized
  • VOC
  • Webinar
  • Webinars
  • What’s Coming Up
  • Workforce
  • Workforce Intelligence

questionpro-logo-nw
Help center Live Chat SIGN UP FREE
  • Sample questions
  • Sample reports
  • Survey logic
  • Branding
  • Integrations
  • Professional services
  • Security
  • Survey Software
  • Customer Experience
  • Workforce
  • Communities
  • Audience
  • Polls Explore the QuestionPro Poll Software - The World's leading Online Poll Maker & Creator. Create online polls, distribute them using email and multiple other options and start analyzing poll results.
  • Research Edition
  • LivePolls
  • InsightsHub
  • Blog
  • Articles
  • eBooks
  • Survey Templates
  • Case Studies
  • Training
  • Webinars
  • All Plans
  • Nonprofit
  • Academic
  • Qualtrics Alternative Explore the list of features that QuestionPro has compared to Qualtrics and learn how you can get more, for less.
  • SurveyMonkey Alternative
  • VisionCritical Alternative
  • Medallia Alternative
  • Likert Scale Complete Likert Scale Questions, Examples and Surveys for 5, 7 and 9 point scales. Learn everything about Likert Scale with corresponding example for each question and survey demonstrations.
  • Conjoint Analysis
  • Net Promoter Score (NPS) Learn everything about Net Promoter Score (NPS) and the Net Promoter Question. Get a clear view on the universal Net Promoter Score Formula, how to undertake Net Promoter Score Calculation followed by a simple Net Promoter Score Example.
  • Offline Surveys
  • Customer Satisfaction Surveys
  • Employee Survey Software Employee survey software & tool to create, send and analyze employee surveys. Get real-time analysis for employee satisfaction, engagement, work culture and map your employee experience from onboarding to exit!
  • Market Research Survey Software Real-time, automated and advanced market research survey software & tool to create surveys, collect data and analyze results for actionable market insights.
  • GDPR & EU Compliance
  • Employee Experience
  • Customer Journey
  • Synthetic Data
  • About us
  • Executive Team
  • In the news
  • Testimonials
  • Advisory Board
  • Careers
  • Brand
  • Media Kit
  • Contact Us

QuestionPro in your language

  • English
  • Español (Spanish)
  • Português (Portuguese (Brazil))
  • Nederlands (Dutch)
  • العربية (Arabic)
  • Français (French)
  • Italiano (Italian)
  • 日本語 (Japanese)
  • Türkçe (Turkish)
  • Svenska (Swedish)
  • Hebrew IL (Hebrew)
  • ไทย (Thai)
  • Deutsch (German)
  • Portuguese de Portugal (Portuguese (Portugal))

Awards & certificates

  • survey-leader-asia-leader-2023
  • survey-leader-asiapacific-leader-2023
  • survey-leader-enterprise-leader-2023
  • survey-leader-europe-leader-2023
  • survey-leader-latinamerica-leader-2023
  • survey-leader-leader-2023
  • survey-leader-middleeast-leader-2023
  • survey-leader-mid-market-leader-2023
  • survey-leader-small-business-leader-2023
  • survey-leader-unitedkingdom-leader-2023
  • survey-momentumleader-leader-2023
  • bbb-acredited
The Experience Journal

Find innovative ideas about Experience Management from the experts

  • © 2022 QuestionPro Survey Software | +1 (800) 531 0228
  • Sitemap
  • Privacy Statement
  • Terms of Use