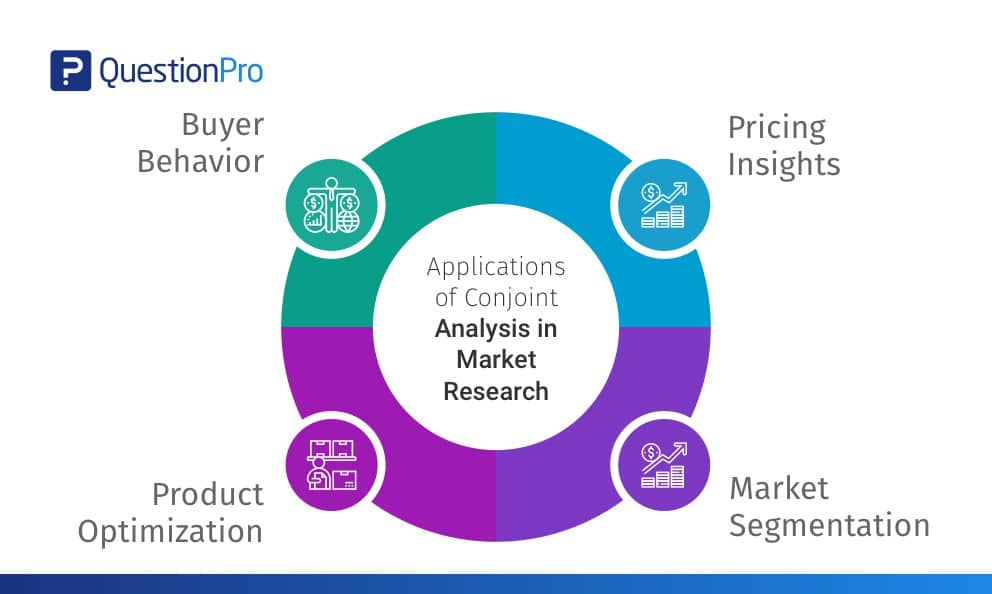
Conjoint analysis for market research is a survey method that shows people realistic product options and asks them to choose. Their choices reveal which features, brands, and prices drive decisions, and how much each is worth. Businesses use it to set prices, shape products, and predict demand before they spend on a launch.
In this guide, we break down the main business uses, show examples by industry, and walk through how to run a study and read the results.
What is conjoint analysis for market research?
Conjoint analysis is a market research method that measures the value people place on each attribute of a product or service by asking them to make trade-offs. An attribute is a feature such as price, brand, or battery life. A level is one setting of that feature, such as $29 or $39.
Instead of asking “How important is price?”, a conjoint survey shows several complete offers and asks which one the respondent would pick. Statistical models then work backward from those choices. The result is a score for every level, called a part-worth utility, that shows how much that level adds to or subtracts from appeal.
This matters because people say everything is important when asked directly. Forced trade-offs expose what they will actually give up. For a full definition and the math behind it, read our guide to conjoint analysis.
How is it different from other research methods?
Conjoint is often confused with simpler survey methods. This table separates them.
| Method | What it asks | What you learn | Best for |
|---|---|---|---|
| Rating questions | “How important is each feature?” | Stated importance, often inflated | Quick pulse checks |
| MaxDiff | “Which feature is most and least important?” | A ranked list of items | Prioritizing long feature lists |
| Conjoint analysis | “Which full offer would you choose?” | Trade-offs, price value, market share | Pricing and product design |
| A/B test | “Which live version converts better?” | Behavior on two versions | Optimizing existing assets |
If you only need to rank items, see MaxDiff vs conjoint for when each fits.
Why do businesses use conjoint analysis?
Businesses use conjoint analysis because it turns opinions into numbers they can plan around. It answers a question that is hard to ask directly: what will customers give up to get what they want?
Four benefits explain its popularity:
- Trade-off measurement: Respondents must weigh price against features, so you see real priorities instead of a wish list.
- Hidden drivers: Models can show that a feature people rarely mention, such as delivery speed, moves choices more than the ones they talk about.
- Individual-level preferences: Each respondent gets their own utilities, so you can compare groups and find segments.
- Testing without building: You can test products, bundles, and prices that do not exist yet, which cuts the cost of being wrong.
These benefits depend on good design. A weak attribute list produces weak answers, no matter how advanced the model is.
How do businesses use conjoint analysis for market research?
The core applications are pricing, product optimization, new product launches, market segmentation, buyer behavior, brand valuation, and bundling. Each answers a different business question with the same survey method.
- Pricing: Find what buyers will pay and where demand drops.
- Product design: Rank features and test combinations.
- Launch planning: Simulate share against competitors.
- Segmentation: Group buyers by what they value.
- Brand and bundles: Measure brand premium and package appeal.
Pricing and willingness to pay
Price is usually one attribute in the study, set at several levels. The results show how demand changes as price moves and how much people will pay for a feature. For example, you can learn whether a premium tier is worth an extra $10 a month or whether that feature only matters to a small group.
Pair this with pricing research when you also need to test other pricing methods.
Product optimization and feature prioritization
Conjoint ranks features by how much they add to appeal, so teams can see what to build, keep, or cut. It also shows which combinations work together. A feature that looks minor alone can matter a lot beside a certain price.
- Keep: Features with high utility at a price buyers accept.
- Cut: Features with low utility that add cost.
- Rework: Features that only pay off in certain combinations.
New product and concept testing
Before launch, a market share simulator lets you test your planned offer against competitors. You can change one attribute and see the predicted shift in share. This replaces guesswork in go or no-go meetings.
Market segmentation
Because every respondent has their own utilities, you can group people by what they value instead of by age or income. One group may be price-driven, another quality-driven, and a third loyal to a brand. This is the basis of needs-based market segmentation.
- Price-driven: Chooses the lowest cost and accepts fewer features.
- Quality-driven: Pays more for performance and support.
- Brand-loyal: Sticks with a trusted name even at a higher price.
Buyer behavior and brand value
Including brand as an attribute shows how much the name alone adds to choice at the same price. It also shows which competitor brands your buyers consider close substitutes. That helps you judge where your brand earns a premium and where it does not.
Bundling and packaging
For subscriptions, plans, and menus, conjoint shows which add-ons buyers want together and what they will pay for the bundle. This guides tier design and avoids packages nobody picks.
- Good for: Subscription plans, telecom packages, restaurant menus, and benefits packages.
Which business goal fits which conjoint study?
Match the goal to the decision you need to make, then to the output you need. This table shows common pairings.
| Business goal | Question to answer | Key output | Typical conjoint type |
|---|---|---|---|
| Set or change a price | What will buyers pay for each feature? | Willingness to pay, price curve | Choice-based |
| Choose features | Which features move choice most? | Attribute importance | Choice-based or adaptive |
| Launch a product | What share can we win against rivals? | Simulated market share | Choice-based |
| Design tiers or bundles | Which add-ons sell together? | Best combinations | Menu-based |
| Find segments | Which groups value different things? | Utility clusters | Choice-based with segmentation |
To pick the type that fits, see our breakdown of types of conjoint analysis.
What are examples of conjoint analysis in different industries?
The method works in any category where buyers weigh several features and a price. The examples below are illustrative setups, not reported results.
- Software and SaaS: A team tests plan tiers by varying seats, support level, integrations, and monthly price. The output shows which tier mix maximizes sign-ups.
- Retail and consumer goods: A brand varies pack size, flavor, claim, and shelf price to find the version that wins against private label.
- Healthcare: A provider tests appointment type, wait time, location, and out-of-pocket cost to see what patients value in a clinic.
- Financial services: A bank varies fees, rewards, interest rate, and app features to design a credit card that fits a target segment.
- Travel and hospitality: A hotel chain varies room type, breakfast, cancellation terms, and nightly rate to price add-ons.
- Employee benefits: An HR team tests health plan, remote days, and bonus options to learn which package staff value most.
Each case follows the same pattern. List the attributes that drive choice, set realistic levels, and let respondents trade them off.
How do you run a conjoint analysis study?
A conjoint study follows six steps, from the business question to a simulator your team can use. Plan the first two steps carefully, because they decide whether the data can answer your question.
- Define the decision.
Write the choice the study must support, such as “Which of three tiers should we launch, and at what price?” A clear decision keeps the attribute list short. - Choose attributes and levels.
Pick the features buyers weigh and set realistic levels for each. A common range is four to six attributes with three to five levels each. Include levels slightly beyond what you plan to offer so the model can estimate trends. - Pick the conjoint type.
Choice-based conjoint suits most pricing and share studies. Menu-based fits bundles. Use adaptive types when you have many attributes. - Build the survey and recruit.
Show each respondent a series of choice tasks, often 8 to 12, each with two to four options and a “none” option. A common rule of thumb is at least 300 respondents overall and around 200 per group you want to compare. - Estimate utilities.
The software models the choices and calculates part-worth utilities for every level, plus the relative importance of each attribute. - Simulate and decide.
Use the market share simulator to test scenarios, such as a price rise or a new feature, and compare predicted share before you commit.
Run a quick pilot with a small group first. It catches confusing wording and unrealistic combinations before you spend on a full sample.
How do you read conjoint analysis results?
Read the results in three layers: attribute importance, level utilities, and simulated outcomes. Each answers a different question, and none should be read alone.
Attribute importance shows which feature type drives choice most, such as price or brand. Level utilities show which setting within each feature wins, such as the 12-month plan over the 24-month plan. The simulator then combines both to predict share and revenue for any offer you build.
Keep two cautions in mind. First, utilities are relative, so compare levels within an attribute, not across attributes. Second, stated choices in a survey can run higher than real purchases, so treat predicted share as a direction, not a forecast. Our help page on part-worths in conjoint analysis explains the scores in detail.
What mistakes should you avoid in conjoint analysis?
Most failed studies share a few avoidable errors that come from design, not from the model.
- Too many attributes: Long profiles tire respondents and they start answering on one feature only. Cut to the attributes that change decisions.
- Unrealistic combinations: Pairs like a luxury brand at a bargain price break trust in the task. Set rules for levels that cannot occur together.
- Narrow price range: If the price levels barely differ, the model cannot measure price sensitivity.
- Wrong audience: Surveying current customers only hides what prospects and rivals’ buyers think. Recruit from the market you want to win.
- Treating the model as a forecast: Share predictions ignore ads, distribution, and awareness. Adjust for them before you present numbers.
How does QuestionPro support conjoint analysis?
QuestionPro Market Research Software includes a conjoint analysis tool that handles the design, fieldwork, and analysis in one place. You add attributes and levels, and the platform builds the choice tasks and randomizes them to reduce order bias.
After data collection, the software reports part-worth utilities and attribute importance, and includes a simulator for what-if scenarios. You can filter by subgroup to compare segments, which supports the segmentation use case above.
- Setup: Add attributes, levels, and rules for combinations that cannot occur.
- Analysis: Review part-worth utilities, importance scores, and subgroup filters.
- Decisions: Run what-if scenarios in the simulator.
Teams that want the wider toolset can explore Market Research Software.
Conjoint analysis turns “what do customers want?” into a number you can plan around
Conjoint analysis earns its place in market research because it measures what surveys usually miss: the price of every preference. Used well, it helps a business choose features, set prices, and size demand with evidence instead of instinct.
Start with one decision, keep the attribute list tight, and test your offer against realistic alternatives. A small, well-designed study beats a large one that asks about everything.
Frequently Asked Questions (FAQs)
Businesses use conjoint analysis to set prices, choose product features, test new concepts, design bundles, and find customer segments. It measures the trade-offs buyers make between features and cost, so teams can predict demand for an offer before building or launching it.
A common rule of thumb is at least 300 respondents for a choice-based study, and about 200 per segment you want to compare. Needs rise with more attributes and levels, so confirm sample size during design, not after fieldwork.
It is better when the goal is to understand trade-offs, especially price against features. Regular surveys capture opinions and satisfaction well, but people rate everything as important. Conjoint forces choices, so the results reflect value more realistically.
Yes. Online tools make conjoint accessible without a research team. A small business can run a focused study with three or four attributes and a modest sample to test a price change or a new offer, using templates and automated analysis.
MaxDiff asks respondents to pick the best and worst items from a list, giving a ranking. Conjoint shows complete product profiles with prices, so it measures trade-offs and predicts share. Use MaxDiff to screen features and conjoint to price and configure them.