



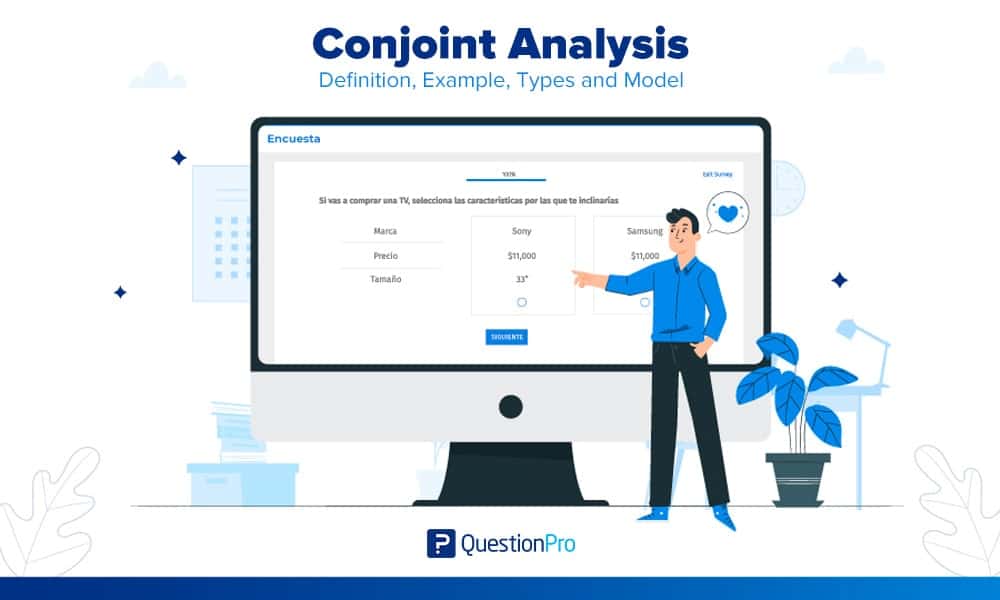
Think about the last time you bought a house or a car. You weighed location against price, size against monthly payments, and features against your budget, often without realizing you were running a mental trade-off exercise. Conjoint analysis takes that same everyday decision-making process and turns it into a measurable research method.
Instead of asking customers to rate features one at a time, conjoint analysis shows them realistic product combinations and asks which one they would actually choose. The result is a set of numbers that show exactly how much weight people place on price, brand, size, or any other attribute.
In this guide, we will cover what conjoint analysis is, how it compares to MaxDiff, the main study types, and how to run one from start to finish.
What is conjoint analysis?
Conjoint analysis is a survey-based market research method that measures how much value people place on individual product or service attributes. It does this by asking them to choose between realistic combinations of those attributes, rather than rating each one separately. The word “conjoint” comes from “conjoin,” meaning to join together, because respondents evaluate features as a joined package rather than in isolation.
Researchers break a product down into attributes and levels, the specific options within each attribute. A laptop study, for example, might test:
- Brand: Dell, Apple, Samsung
- Price: $800, $1,200, $1,600
- Screen size: 13-inch, 15-inch, 17-inch
Respondents see several product concepts built from different combinations of those levels and choose the one they would be most likely to buy. Statistical modeling then converts those choices into a part-worth utility score for every level, showing how much each one contributes to a customer’s decision.
This approach works because it mirrors real shopping behavior. Nobody buys a phone based on camera quality alone. They weigh camera quality against price, battery life, and screen size all at once, and conjoint analysis captures that same trade-off. That is why researchers consider it one of the most accurate ways to model purchase decisions.
Conjoint analysis vs. MaxDiff analysis: What’s the difference?
Conjoint analysis and MaxDiff analysis both ask respondents to make trade-offs. But they answer different research questions. Conjoint measures how attributes combine to drive a purchase decision. MaxDiff instead ranks a long list of individual items against each other, without combining them into product concepts.
| Aspects | Conjoint analysis | MaxDiff analysis |
|---|---|---|
| What it measures | How attributes and their levels combine to drive a choice | The relative importance of individual items in a list |
| Question format | Two or more full product concepts, pick one | A set of items, pick the most and least important |
| Best for | Pricing, product configuration, willingness to pay | Prioritizing features, messages, or brand claims |
| Typical scale | About 5 attributes with 2-3 levels each | 12 to 100+ items, shown in small sets |
| Output | Part-worth utilities and market share simulations | A ranked, additive-free preference score per item |
A common research sequence is to run MaxDiff first when a list of potential attributes is too long to test directly. That step narrows the list down before building a conjoint study around the attributes that mattered most. For a deeper breakdown of each method, see this comparison of MaxDiff vs conjoint analysis or explore QuestionPro’s MaxDiff analysis tool directly.
Why conjoint analysis matters in market research
Traditional rating scales cannot place a dollar value on individual product attributes, and conjoint analysis can. When a survey simply asks how important price is on a 1-to-5 scale, nearly everyone answers “very important,” which tells a research team almost nothing useful.
Conjoint analysis solves this by forcing trade-offs instead of ratings. A respondent who has to choose between a cheaper phone with a smaller screen and a pricier phone with a bigger one reveals far more about their actual priorities than any rating scale could. That data feeds directly into decisions researchers care about most:
- Which features to include in a new product, and which to cut
- How much customers will actually pay for a specific feature or brand
- How a proposed product is likely to perform against named competitors
In the US, consumer electronics and CPG brands frequently run a conjoint study before a national launch specifically to answer these three questions with data instead of internal opinion. Learn more about how conjoint analysis fits into the wider discipline of market research.
Types of conjoint analysis
There are two main types of conjoint analysis: choice-based conjoint (CBC) and adaptive conjoint analysis (ACA). The right one depends on how many attributes are being tested and whether price is a central question.
Choice-based conjoint (CBC) analysis
Choice-based conjoint is the most widely used form of conjoint analysis because it mirrors real purchasing behavior most closely. Respondents see two or more complete product profiles and simply pick the one they would buy, exactly as they would in a store or online.
For example, a smartphone study might show two devices side by side at a similar price. One has a larger battery and a dual camera, the other a smaller battery and a triple camera. Whichever device a respondent chooses reveals how they weigh battery life against camera configuration, without ever asking them directly.
CBC studies typically run on one of three design types:
- Random design: Attributes are combined randomly and uniquely for each respondent
- D-optimal design: An algorithm selects combinations that minimize bias and variance for the given sample size
- Import design: Researchers import a pre-built design, such as a fractional factorial orthogonal design from SPSS
Adaptive conjoint analysis (ACA)
Adaptive conjoint analysis works best when a study needs to test more attributes than a standard choice-based design can handle without exhausting respondents. Instead of full product profiles, ACA presents graded-pair comparisons, where respondents rate their relative preference between two attributes at a time on a point scale.
ACA is well suited to product design and segmentation research. It is a weaker choice when price sensitivity is the primary question, since it does not simulate a direct purchase decision the way CBC does.
Key terms in conjoint analysis
Conjoint analysis has its own vocabulary, and understanding these terms makes the results far easier to interpret. The table below defines the ones that show up most often in a conjoint report.
| Term | What it means |
|---|---|
| Attribute | A product feature being tested, such as brand, size, or price |
| Level | A specific value within an attribute, such as $200 or “Samsung” |
| Task | One choice a respondent makes during the survey; a study might include five tasks |
| Concept or profile | A hypothetical product built from one level of each attribute, shown to a respondent |
| Relative importance | The percentage weight an attribute carries in the overall decision, such as price at 35% |
| Part-worth or utility | The numeric value a specific level contributes to a respondent’s overall preference |
| Market share simulation | A model that predicts how a new or changed product would perform against competitors |
| Price elasticity | How demand shifts as price changes, plotted as a demand curve from the choice data |
How to run a conjoint analysis study
Running a conjoint study follows a consistent process regardless of the product category being tested. Here is how it works using a television study as a running example.
- Define the attributes and levels.
Keep the list focused. About 5 attributes with 2-3 levels each is the general benchmark researchers follow to avoid respondent fatigue, which can reduce data quality on longer surveys. For a television study, that might mean price ($800, $1,200, $1,500), size (36″, 45″, 52″), and brand (Sony, LG, Vizio).
- Choose a design type.
Select random, D-optimal, or import design based on the sample size and how many tasks each respondent will complete.
- Set the task count and concepts per task.
Decide how many product profiles appear side by side and how many choices each respondent makes before the survey ends.
- Add design constraints.
Fixed tasks and prohibited concept combinations prevent illogical pairings, such as the lowest price with every premium feature enabled.
- Field the survey and collect responses.
A single-group study without subgroup comparisons generally needs a minimum of around 200 to 300 completed responses for reliable part-worth estimates, with segmentation studies requiring more per group.
- Analyze the results.
Utility calculation and relative importance scores are generated automatically from the choice data, showing which attributes and levels drove the most preference.
Conjoint analysis example
Consider a smartphone maker comparing two device concepts. Device 1 has a 6.7-inch display, a dual rear camera, and a 4,000 mAh battery. Device 2 has a nearly identical display, a triple rear camera, and a smaller battery split across two cells.
The two devices are close enough that a rating scale would likely score them almost the same. A forced choice is different. It reveals exactly how much battery life is worth relative to an extra camera lens, something a rating question could never surface. Applied across hundreds of respondents, that same trade-off data becomes a part-worth score for every attribute level in the study.
In a QuestionPro-hosted webinar, a former Zynga product director described using a related method to test candidate names for an upcoming game release before committing to a final title. A best practice from that session applies just as well to conjoint studies. Anticipate the follow-up questions stakeholders are likely to ask, and build those into the original survey design instead of fielding a second study later.
Advantages of conjoint analysis
Conjoint analysis offers several advantages that direct-rating surveys cannot match:
- It estimates the trade-offs people make instinctively when weighing several attributes at once, rather than asking them to explain their own reasoning
- It measures preferences at the individual respondent level, not just in aggregate
- It surfaces drivers of preference that respondents may not consciously recognize themselves
- It supports market share simulation, letting a team test hypothetical products that do not exist yet
Common mistakes to avoid in conjoint analysis
Most conjoint studies fail for a handful of predictable reasons, and each one is avoidable with the right design choices upfront.
- Testing too many attributes at once.
Beyond roughly 5-6 attributes, respondents start satisficing rather than genuinely evaluating each choice, which distorts the resulting utilities.
- Skipping a screening step for long attribute lists.
If a business genuinely needs to test more than 8-10 potential attributes, running MaxDiff first to narrow the list produces a cleaner conjoint design than trying to test everything at once.
- Under-sampling the study.
Fielding fewer than 100-150 completed responses per group being compared makes the resulting part-worths unreliable, especially for pricing-focused studies.
- Ignoring stakeholder follow-up questions during design.
Teams that only plan for the first round of questions often need a second study to answer the second round, adding weeks to a project that better upfront design could have avoided.
When to use conjoint analysis
Conjoint analysis fits best when a decision genuinely depends on trade-offs between several product or pricing variables, not when a single yes-or-no answer is enough. It is a strong fit when a team is trying to:
- Launch a new product or service and needs to know which feature combination will sell
- Repackage or reprice an existing product without knowing how customers will react
- Understand which attributes customers value most before a redesign
- Place a dollar value on brand relative to competing brands
- Revamp a pricing structure based on real willingness-to-pay data rather than guesswork
How QuestionPro supports conjoint analysis
QuestionPro’s conjoint analysis tool is built around choice-based conjoint, the design type that most closely simulates real purchasing decisions. Researchers enter attributes and levels through a guided wizard, and the platform automatically generates the task combinations respondents will see.
The toolset includes a few capabilities worth knowing about before starting a study:
- Conjoint task creation wizard: Builds tasks from entered attributes and levels without manual configuration
- Design parameter controls: Adjust task count, profiles per task, and “not applicable” options
- Automatic utility calculation: Generates part-worth scores directly from collected responses
- Relative importance reporting: Ranks attributes by their share of the overall decision
- Segmentation and filtering: Reruns relative importance calculations against specific respondent subgroups
These tools sit inside QuestionPro’s broader Market Research Software, which also supports the MaxDiff studies, pricing research, and general survey work that often accompany a conjoint project.
Getting the most value from your next conjoint study
Conjoint analysis takes more planning than a standard survey, but the payoff is a level of insight that rating scales and open-ended questions cannot deliver.
A well-designed study with a focused attribute list and an adequate sample size turns a vague sense of “customers seem to like this” into a specific, defensible answer. It tells a team what to build, how to price it, and which features actually move the needle.
Start with a clear research question, keep the attribute list disciplined, and the trade-off data will do the rest of the work.
Frequently Asked Questions (FAQs)
A single-group study without subgroup comparisons generally needs at least 200 to 300 completed responses for reliable results. Studies comparing multiple segments, such as age groups or regions, need roughly that many responses within each group being compared separately.
No. A/B testing compares two live versions of something and measures actual behavior, while conjoint analysis uses survey-based hypothetical choices to estimate preferences before a product exists. Conjoint works well earlier in development, when live testing is not yet possible.
Yes. Including price as one of the tested attributes lets researchers calculate a demand curve and estimate willingness to pay for specific feature combinations, which is why conjoint is a common method in pricing research.
Around 5 attributes with 2-3 levels each is the general benchmark for choice-based conjoint. Testing significantly more increases respondent fatigue and can reduce the reliability of the resulting data, so a MaxDiff screening step is often better for longer attribute lists.
Choice-based conjoint shows full product profiles and asks respondents to pick one, closely mirroring real purchases. Adaptive conjoint uses graded-pair comparisons instead, and works better when a study needs to test more attributes than a choice-based design can handle.



