
The NPS survey question, also known as the Net Promoter Score question, is a single 0 to 10 rating question that measures customer loyalty by asking how likely someone is to recommend a company, product, or service. It segments respondents into promoters, passives, and detractors to calculate a Net Promoter Score.
From SaaS startups to retail chains, organizations use this simple metric to understand advocacy, predict retention, and identify growth opportunities.
Despite its simplicity, it remains one of the most widely used customer experience metrics in the USA. It looks simple, but the way you design, time, and follow up on it determines whether you get useful insight or just another number.
In this guide, you will learn how the NPS survey question works, when to use it, how to calculate Net Promoter Score, and how to turn feedback into measurable improvements.
What is an NPS Survey Question?
An NPS survey question measures customer loyalty by asking respondents to rate their likelihood of recommending a business on a scale from 0 to 10.
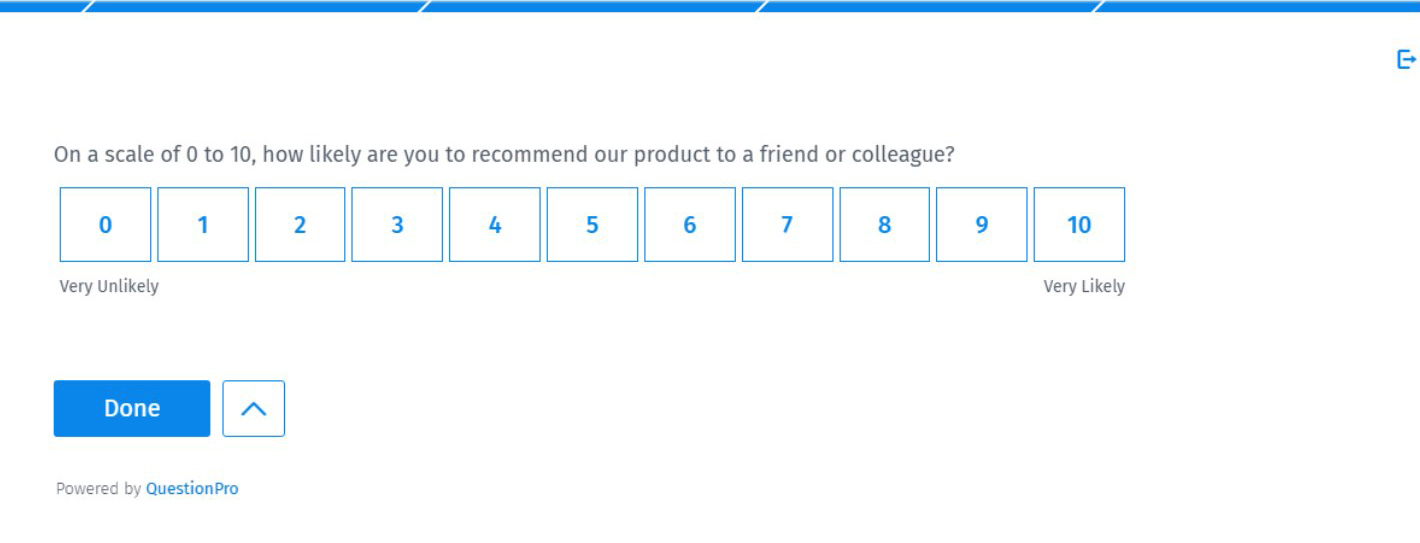
The standard format is:
On a scale from 0 to 10, how likely are you to recommend [Company/Product/Service] to a friend or colleague?
It classifies respondents into three categories to calculate a Net Promoter Score:
- Promoters (9–10): Loyal and enthusiastic customers
- Passives (7–8): Satisfied but not committed
- Detractors (0–6): Unhappy customers who may discourage others
The final Net Promoter Score is calculated as:
NPS = % of Promoters – % of Detractors
The final result can range from -100 (all detractors) to +100 (all promoters).
Read the complete guide: How to utilize the Net Promoter Score survey question in your research.
What is a Good NPS Score?
An NPS score ranges from -100 to +100 and is interpreted based on the balance between promoters and detractors. Positive scores indicate more promoters than detractors, while higher scores reflect stronger customer advocacy.
A good NPS score depends on your industry, but in general:
- 0 or below: Needs improvement
- 0–30: Average
- 30–50: Good
- 50–70: Excellent
- 70+: Exceptional
Most US B2B SaaS companies aim for a score above 30, while high-performing subscription brands often target 50 or higher. Consumer industries may see wider variation depending on competition and switching costs.
It is important to evaluate NPS within your industry context and track trends over time rather than focusing only on the absolute number. A steadily improving score often signals meaningful progress, even if the current score is moderate.
Average NPS Scores by Industry in the USA
NPS benchmarks vary significantly by industry. Competitive markets with many alternatives often show lower scores, while niche or relationship-driven industries may score higher.
General US benchmarks:
- SaaS and Technology: 30–50
- Retail and E-commerce: 20–40
- Financial Services: 20–40
- Healthcare Providers: 10–30
- Telecommunications: 0–25
These numbers are directional. Your goal should be to outperform competitors in your category rather than comparing across unrelated industries.
Because scoring environments change over time, annual benchmarking reports provide more accurate industry comparisons.
Explore further: NPS benchmarks for leading industries in 2025
When Should You Send an NPS Survey?
Choosing the right moment to send an NPS survey question directly impacts the accuracy and usefulness of the data. Ask too early, and customers have not formed a full opinion. Ask too late and details fade. The goal is to capture feedback when the experience is still clear, but complete enough to evaluate fairly.
Best moments:
- After a completed purchase
- After support resolution
- During renewal cycles
- Inside SaaS dashboards
- Via email, 7–14 days post-delivery
In the US B2B environment, email remains common. In SaaS and fintech, in-app surveys dominate.
Types of NPS Survey Questions: Transactional, Relationship, and eNPS
There are three primary types of NPS rating questions: Transactional NPS, Relationship NPS, and Employee NPS. Each serves a different purpose.
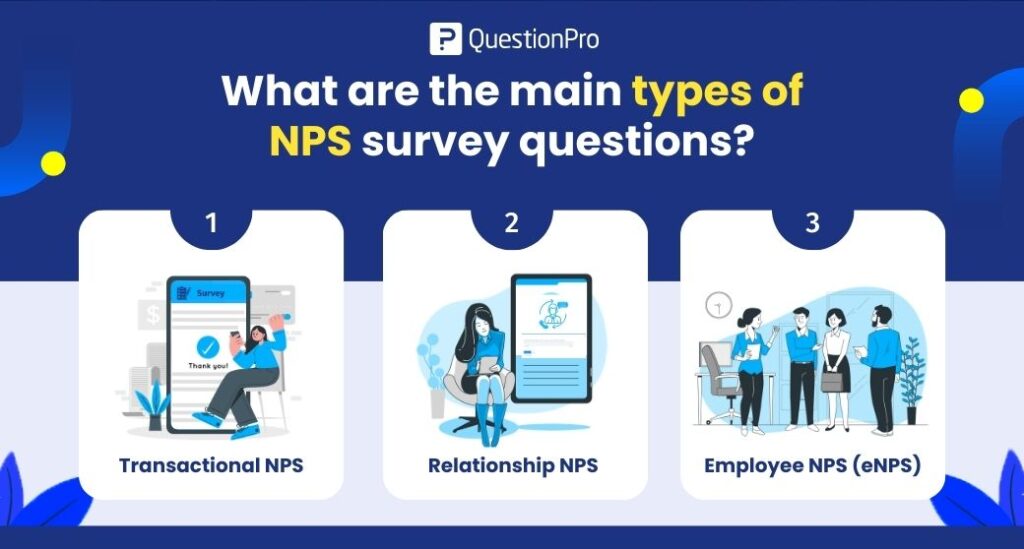
1. Transactional NPS
Transactional NPS measures sentiment after a specific interaction.
It is typically triggered:
- After a customer support call
- After a purchase
- After onboarding
- After a service visit
Example:
How likely are you to recommend us based on your recent support experience?
This type helps identify operational issues. If support wait times increase, transactional NPS will often reflect that quickly. It is tactical and event-driven.
2. Relationship NPS
Relationship NPS measures overall brand loyalty.
It is usually sent:
- Quarterly
- Biannually
- Annually
Example:
How likely are you to recommend our company to a friend or colleague?
This type reflects long-term perception, not just one interaction. US subscription-based companies often rely on relationship NPS to track loyalty trends over time.
3. Employee NPS (eNPS)
Employee NPS, or eNPS, measures internal loyalty.
It asks employees:
How likely are you to recommend this company as a place to work?
This version helps HR teams assess employee engagement and workplace satisfaction. In competitive US labor markets, eNPS is often used alongside retention and engagement metrics.
Also check: Key differences between Transactional vs Relational NPS
What Are Good NPS Survey Question Examples?
Good NPS question examples stay simple, neutral, and easy to answer. What changes is the object of recommendation. That object should reflect the experience you want to measure, whether it is a product, a service interaction, or overall brand perception.
Clarity matters more than creativity. In real-world US business environments, overly clever wording reduces response quality. Direct language improves comparability and avoids confusion.
Product example: Use this when you want feedback about a specific product rather than the entire company.
- How likely are you to recommend our payroll software?
- How likely are you to recommend this product to a colleague in your industry?
Service example: Use this after a customer interacts with a support or service team.
- How likely are you to recommend our support team?
- Based on your recent service experience, how likely are you to recommend us?
Post-purchase example: Retailers and e-commerce businesses in the USA often trigger this within 24 to 72 hours of delivery or checkout.
- Based on your recent purchase, how likely are you to recommend us?
- After completing your purchase, how likely are you to recommend our company?
B2B US example: In B2B environments, precision matters. Mentioning the professional context can increase relevance.
- How likely are you to recommend our compliance platform to other US finance professionals?
- How likely are you to recommend our solution to peers in your organization or industry?
Healthcare Industry Example: In regulated industries like healthcare, wording must stay clear and compliant. The focus is usually on the patient experience rather than clinical outcomes.
- How likely are you to recommend our clinic to friends or family?
- Based on your recent visit, how likely are you to recommend our healthcare services?
Best NPS Follow-Up Questions to Ask After the Rating
An NPS follow-up question provides context behind the number.
Best practice:
What is the primary reason for your score?
Additional options:
- What could we improve?
- What did we do well?
- What nearly stopped you from giving a higher rating?
Keep it short. One or two follow-ups are optimal.
An NPS survey question gives you a number. The follow-up question explains the reason behind it. The most effective approach is to tailor follow-up questions based on whether the respondent is a promoter, passive, or detractor.
Segmenting this way turns NPS from a score into an action plan.
1. Follow-Up Questions for Promoters (Scores 9–10)
Promoters are loyal and enthusiastic. The goal is to understand what drives their advocacy and amplify it.
Ask:
- What do you value most about our product or service?
- What made you give us this score?
- What feature or experience stands out to you?
- Would you be open to sharing a testimonial or review?
These responses reveal strengths you should protect and promote. In competitive US markets, promoter feedback often highlights differentiators like customer support speed, pricing transparency, or product reliability.
2. Follow-Up Questions for Passives (Scores 7–8)
Passives are satisfied but not impressed. They are vulnerable to competitors.
Ask:
- What would make you more likely to recommend us?
- What is one thing we could improve?
- What almost made you give a higher score?
- If you could change one thing, what would it be?
Passive feedback usually points to small friction areas. Addressing these issues can convert neutral customers into promoters.
3. Follow-Up Questions for Detractors (Scores 0–6)
Detractors are unhappy and at risk of churn. The focus here is damage control and recovery.
Ask:
- What was missing or disappointing in your experience?
- How can we make this right?
- What specific issue led to your rating?
- Would you be open to discussing this further?
In the US service industries, especially, rapid follow-up with detractors can prevent negative online reviews and reduce churn.
How to Calculate and Analyze NPS Step by Step
The logic behind the Net Promoter Score question is behavioral prediction. Instead of asking if someone is satisfied, it asks whether they would put their reputation on the line to recommend you.
Recommendation intent correlates strongly with retention and revenue growth. Research originally published in Harvard Business Review by Fred Reichheld established NPS as a loyalty indicator, and it is now widely used across US industries.
Here is how the process works step by step with the NPS survey:
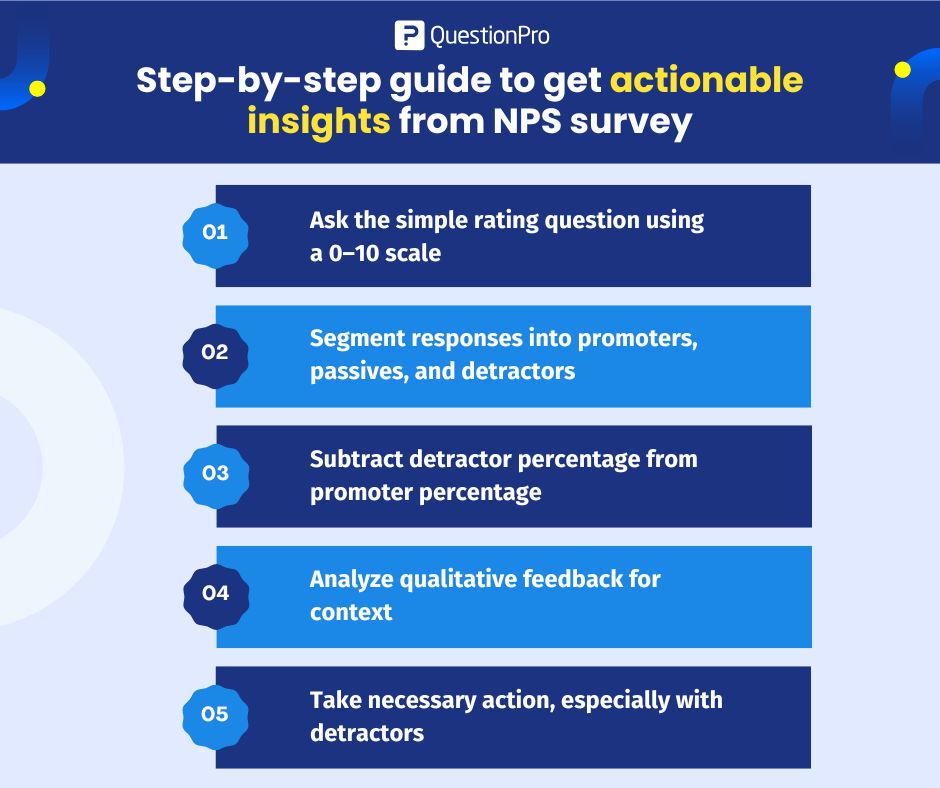
- Ask the simple rating question using a 0–10 scale
The first step is to ask the core NPS question. This ensures consistency and comparability across surveys.
- Segment responses into promoters, passives, and detractors
Based on their score, categorize respondents into three groups:- Promoters
- Passives
- Detractors
- Subtract detractor percentage from promoter percentage
Calculate your Net Promoter Score by subtracting the percentage of detractors from the percentage of promoters. This gives you the overall score, which can range from -100 to +100.
- Analyze qualitative feedback for context
Follow up with an open-ended question. This helps you understand the factors driving the score, providing valuable insights that cannot be captured by the numeric rating alone.
- Take necessary action, especially with detractors
Use the feedback to improve customer experience. Respond quickly to detractors to address issues and prevent churn. Engage promoters for advocacy opportunities and passives to turn them into loyal supporters.
While the NPS process is simple in structure, its effectiveness depends on consistent use and the willingness to act on the feedback received.
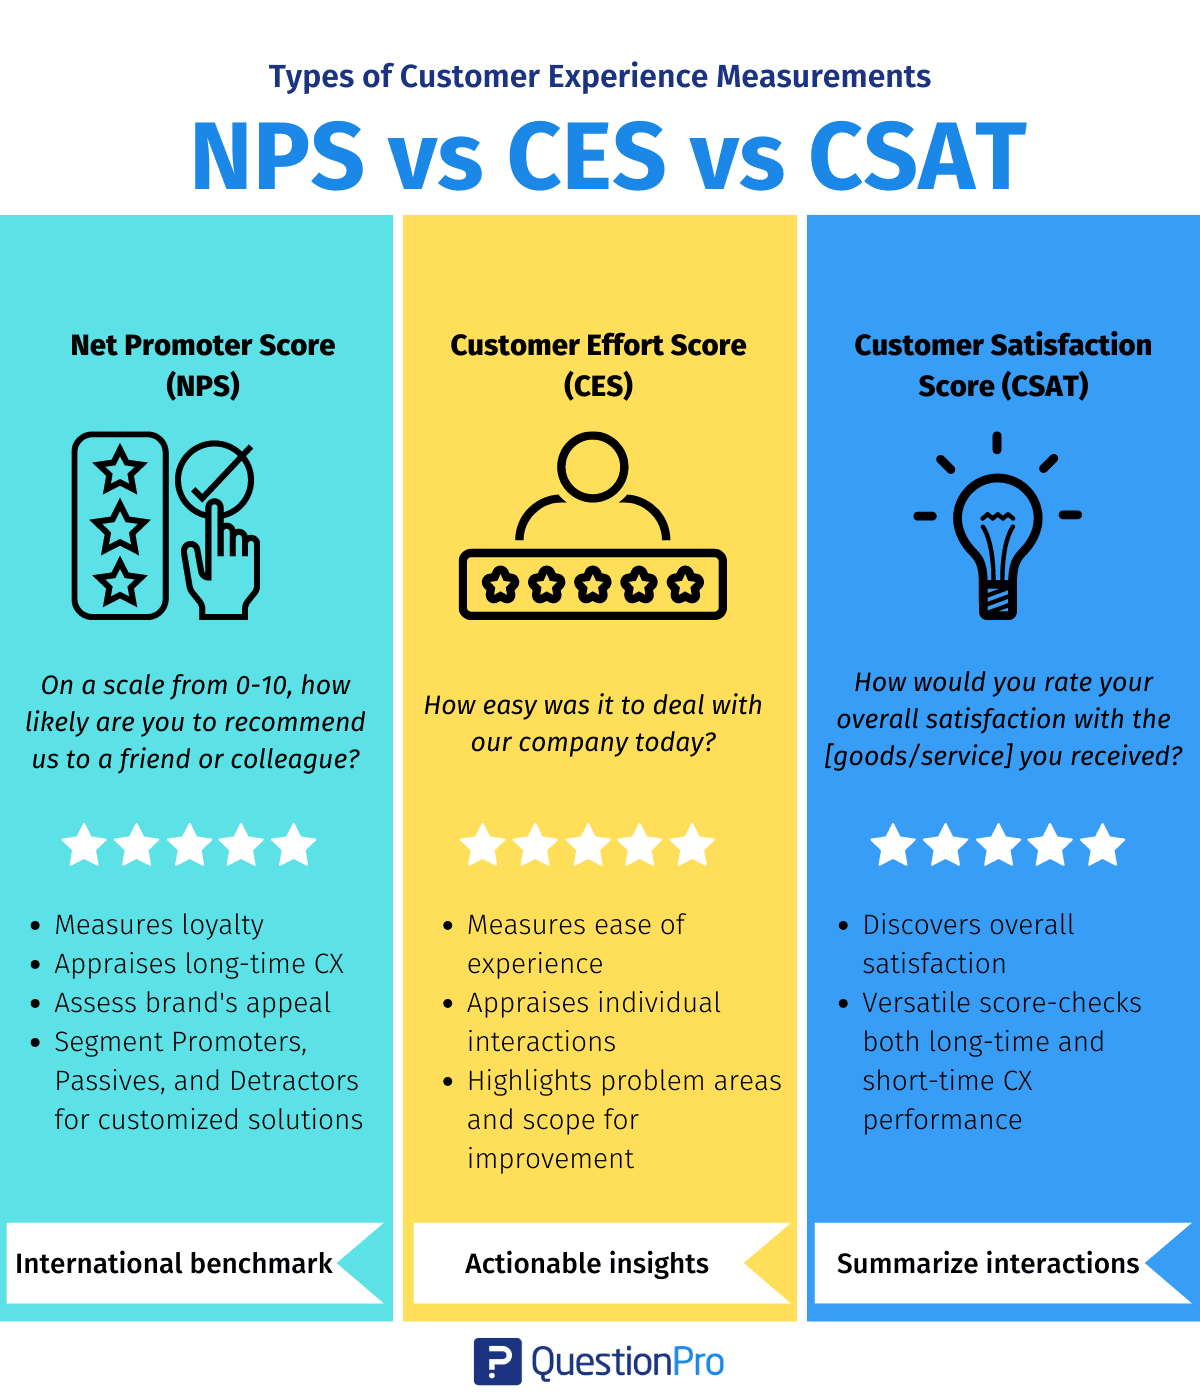
NPS vs CSAT vs CES: What Is the Difference?
While the NPS survey question measures recommendation intent, other customer experience metrics focus on different aspects of satisfaction and effort. Understanding the difference helps you choose the right metric for your goals.
Here is a simplified comparison:
| Metric | Measures | Scale | Best Used For |
| NPS (Net Promoter Score) | Loyalty and likelihood to recommend | 0–10 scale | Tracking long-term brand perception and growth potential |
| CSAT (Customer Satisfaction Score) | Satisfaction with a specific interaction | 1–5 or 1–7 scale | Evaluating support experiences, purchases, or service events |
| CES (Customer Effort Score) | Ease of completing a task or resolving an issue | 1–5 or 1–7 scale | Identifying friction in support, onboarding, or digital journeys |
- Use NPS when your goal is to measure overall loyalty and predict advocacy behavior.
- Use CSAT when you need immediate feedback about a specific touchpoint.
- Use CES when reducing customer effort and friction is your priority.
Many US companies combine all three. NPS highlights long-term loyalty trends, CSAT reveals satisfaction gaps, and CES uncovers operational inefficiencies.
Used together, these metrics provide a more complete view of the customer experience.
Also check: Net Promoter Score Advantages and Disadvantages
Common NPS Survey Question Mistakes to Avoid
A Net Promoter Score question looks simple, but small wording or process mistakes can distort results. Most scoring problems are not caused by customers, but by poorly designed surveys. Avoiding these common errors protects data accuracy and makes trend analysis reliable over time.
- Adding marketing language
Words like “amazing” or “world-class” introduce bias and influence how people respond.
- Combining satisfaction and recommendation in one question
Asking about satisfaction and likelihood to recommend together confuses respondents and weakens clarity.
- Using a 1–5 scale
The standard NPS format requires a 0–10 scale; changing it makes benchmarking impossible.
- Over-surveying customers
Sending surveys too frequently leads to survey fatigue and lower response quality.
- Ignoring qualitative feedback
Focusing only on the score and not the written comments eliminates the context needed for improvement.
Consistency builds trend reliability. When wording, scale, and timing stay stable, NPS becomes a dependable long-term indicator rather than a fluctuating number.
How QuestionPro Helps You Design and Manage NPS Surveys
Running an effective NPS program requires structure, automation, and consistency. QuestionPro supports the full lifecycle of an NPS survey question with practical tools:
- QuestionPro AI survey builder
Generates properly structured NPS questions and follow-ups while maintaining the correct 0–10 scale and neutral wording.
- Standardized NPS templates
Ensures accurate promoter, passive, and detractor segmentation with automatic score calculation.
- Automated follow-up logic
Sends tailored follow-up questions based on the respondent’s score.
- Real-time dashboards
Tracks trends, segments results, and surfaces recurring feedback themes.
- Transactional and relational automation
Triggers surveys after specific interactions or on scheduled intervals.
- Detractor alerts and workflow tracking
Flags low scores and supports fast follow-up to close the loop.
The advantage is consistency. A structured system keeps your recommendation score question accurate, comparable over time, and tied to real operational improvements.
Is the NPS Survey Question Still Relevant?
Companies that combine NPS with segmentation and customer journey analytics typically see clearer patterns in churn risk and advocacy behavior. For organizations building structured customer experience programs, NPS works best when integrated with journey mapping and behavioral analytics.
Despite advanced analytics tools, the NPS survey question remains effective because it measures recommendation intent, which directly connects to reputation and growth. In US markets where online reviews and word-of-mouth drive decisions, that signal still matters.
Modern platforms like QuestionPro reinforce this relevance by integrating NPS into broader customer experience programs. Instead of treating NPS as a standalone metric, companies can combine it with journey analytics, segmentation, and automated follow-ups.
Frequently Asked Questions (FAQs)
Answer: The purpose of an NPS survey question is to measure customer loyalty by asking how likely someone is to recommend your company, product, or service on a 0 to 10 scale. It helps businesses identify promoters, passives, and detractors and predict retention, advocacy, and growth trends.
Answer: There are three main types of NPS survey questions: transactional NPS, relationship NPS, and employee NPS (eNPS). Transactional NPS measures feedback after a specific interaction, relationship NPS tracks overall brand loyalty over time, and eNPS measures employee advocacy and engagement.
Answer: Transactional NPS surveys are sent immediately after key interactions such as support calls or purchases. Relationship NPS surveys are typically sent quarterly or annually to track long-term loyalty trends.
Answer: Yes. Small US businesses can use an NPS survey question effectively as long as responses are collected consistently. Even smaller sample sizes can reveal meaningful loyalty trends if the customer base is stable and feedback is tracked over time.
Answer: No. NPS does not replace customer satisfaction surveys such as CSAT. While NPS measures the likelihood to recommend, CSAT measures satisfaction with a specific interaction. Many companies use both metrics together for a more complete view of customer experience.
Answer: A good NPS score depends on industry benchmarks, but scores above 0 are positive, above 30 are strong, and above 50 indicate high customer advocacy. Comparing your score against competitors in your industry provides better context than using a universal benchmark.