Best Buy’s reputation for helpful service and tech expertise shows up clearly in its numbers. The Best Buy NPS 2025 score sits well above the retail industry average, a sign that shoppers are leaving stores and the Best Buy app ready to recommend the brand to friends and family.
Net Promoter Score (NPS) is the standard metric companies use to track that kind of loyalty, and Best Buy’s result says a lot about how the retailer competes against Walmart, Target, and Home Depot.
In this article, we’ll break down Best Buy’s current NPS, how it compares across benchmarking sources, what is driving the score, and how any retail brand can start measuring its own.
What is Net Promoter Score (NPS)?
Net Promoter Score (NPS) is a customer loyalty metric that measures how likely customers are to recommend a company to someone else, scored on a scale from -100 to 100.
Companies calculate it with one survey question: “On a scale of 0 to 10, how likely are you to recommend us to a friend or colleague?” Responses sort into three groups.
- Detractors (0-6): Unhappy customers who are unlikely to return and may discourage others.
- Passives (7-8): Satisfied but unenthusiastic customers who rarely promote a brand on their own.
- Promoters (9-10): Loyal customers who actively recommend the business to others.
The formula is simple. NPS equals the percentage of Promoters minus the percentage of Detractors. A positive score means promoters outnumber detractors. Above 0 is generally considered positive, above 30 is strong, and above 70 is rare even among top-performing brands.
Retailers rely on NPS because it is fast to collect and easy to compare year over year or against competitors through NPS benchmarks.
Best Buy’s NPS score in 2025
Best Buy posted a Net Promoter Score of 43 in QuestionPro’s Q1 2025 Benchmarking NPS and CSAT Report, a study that surveyed 1,000 U.S. consumers across major retail brands. That score sits well above the retail industry average of 37, placing Best Buy among the stronger performers in its category.

The result breaks down to 56% Promoters, 31% Passives, and 13% Detractors. More than half of the shoppers surveyed said they would actively recommend Best Buy, while fewer than one in seven reported a negative enough experience to become a Detractor.
That gap between Promoters and Detractors is where Best Buy earns its score. A large Promoter base paired with a small Detractor base pushes a company’s NPS into positive, above-average territory, rather than a middling score weighed down by complaints.
How does Best Buy’s NPS compare to other retail benchmarks?
Retail is not the highest-scoring sector overall, but Best Buy still lands near the top of its category. QuestionPro’s Q1 2025 study placed retail third among seven industries measured, behind hotel and hospitality and automotive.
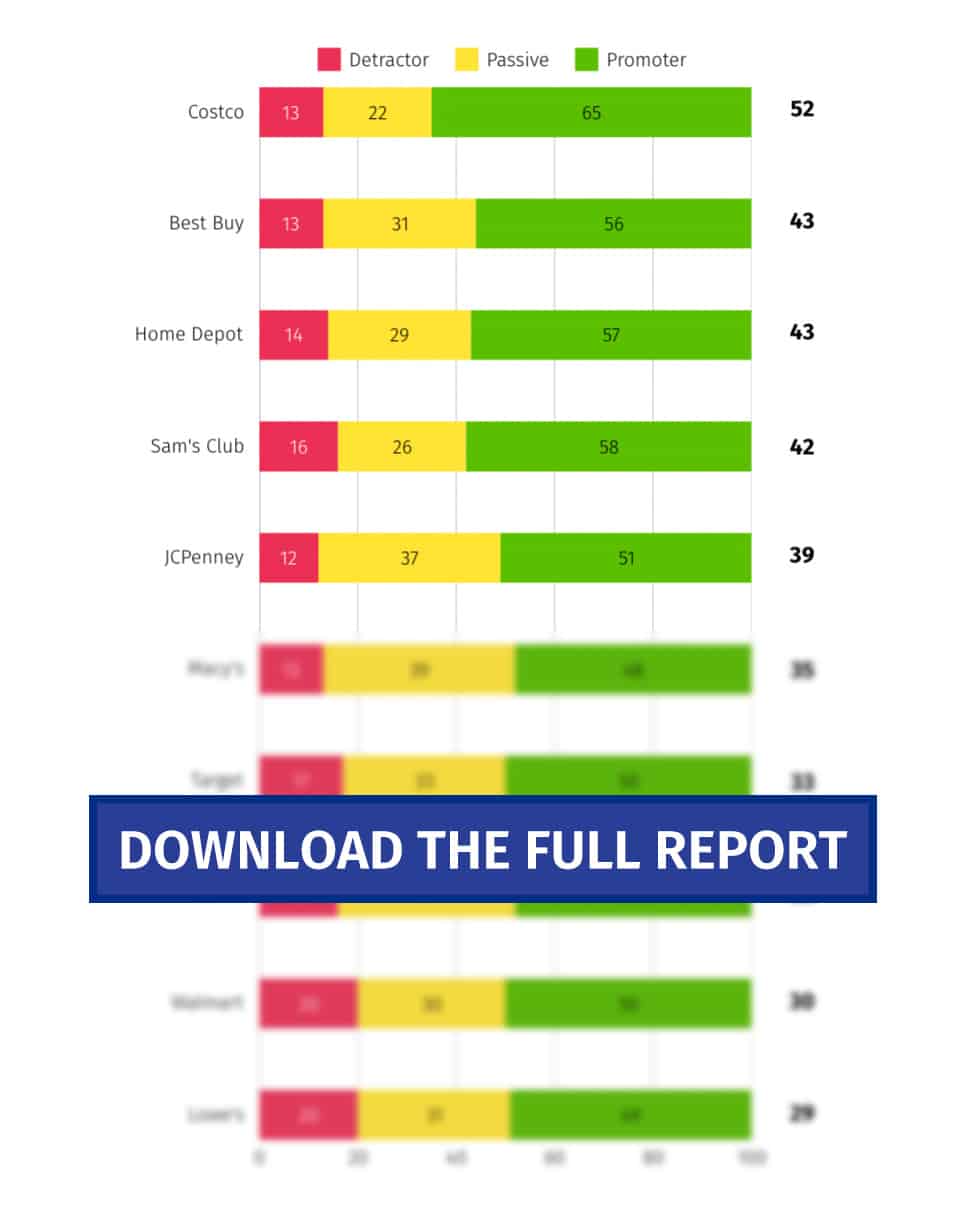
These insights are based on QuestionPro’s latest study, which surveyed 1,000 participants to measure the NPS of various companies and industries. The report reflects real customer opinions from Q1 2025 and is updated quarterly.
| Industry or brand | NPS score (Q1 2025) |
|---|---|
| Hotel & Hospitality (industry) | 44 |
| Automotive (industry) | 41 |
| Best Buy | 43 |
| Home Depot | 43 |
| Retail (industry average) | 37 |
| Airlines (industry) | 33 |
| Insurance (industry) | 23 |
Best Buy edges out the broader retail average and ties Home Depot, two brands built on staff who can answer specific product questions rather than general retail help. For a closer look at how other major retailers compare, including Walmart, Target, and Costco, see QuestionPro’s full NPS in retail benchmark breakdown.
Why do NPS scores for the same company vary by source?
Best Buy’s NPS looks different depending on who is measuring it, and that is normal. Net Promoter Score is not a single official number. It is a result that depends on sample size, survey wording, and who gets asked.
QuestionPro’s Q1 2025 report surveyed a broad, demographically balanced panel of 1,000 U.S. consumers and asked the standard 0 to 10 recommendation question. Other research and review platforms calculate NPS from their own visitor pools, which often skew toward people with a strong opinion, positive or negative, strong enough to leave a public review.
Comparably, for example, reports negative NPS figures for Best Buy when segmented by gender, pulled from self-selected site visitors rather than a representative consumer panel. Neither number is wrong. They measure different populations with different methods, which is why comparing a brand’s score across sources matters less than tracking the trend from one consistent source over time.
What’s driving Best Buy’s customer experience in 2025?
Best Buy’s above-average score is not an accident. Several specific investments show up consistently in how the company describes its customer experience strategy, and in third-party reporting on its results.
- Personalization across channels.
Tailored app screens, custom deals, and product recommendations keep shoppers engaged on both web and mobile. - A loyalty program with real perks.
The My Best Buy Membership program offers free shipping, early access to deals, extended returns, and tech support across its paid tiers. - AI-powered self-service.
Best Buy’s use of AI to expand self-service options drove a 17% decline in customer contacts in a recent quarter, without lowering satisfaction scores, according to a Q3 fiscal 2026 earnings recap from Customer Experience Dive. - Store redesigns based on shopping behavior.
Updated layouts and refreshed product displays reflect how customers actually move through the store. - Employee training.
Better-trained staff translate directly into more confident service, which feeds customer loyalty and repeat visits.
That same earnings call reported relationship NPS climbing year over year, with the strongest gain in customers saying Best Buy met their tech needs, alongside revenue of $9.7 billion for the quarter. The independent benchmark score and the company’s own reported trend are pointing in the same direction.
Customer NPS vs. employee NPS: What’s the difference at Best Buy?
Not every “NPS” number tied to Best Buy measures the same thing. Customer NPS and employee NPS (eNPS) are related metrics that track completely different relationships.
| Metric | What it measures | Best Buy’s score |
|---|---|---|
| Customer NPS | Likelihood customers recommend Best Buy to others | 43 |
| Employee NPS (eNPS) | Likelihood employees recommend working at Best Buy | 2 |
A strong customer NPS does not automatically mean a strong employee NPS, and the reverse is also true. Best Buy’s customer-facing score outpaces its retail peers, while its eNPS of 2 sits closer to the middle for large employers. Tracking both numbers separately gives a fuller picture of how a company performs on both sides of the employee-customer relationship.
Common mistakes retailers make when tracking NPS
A retail NPS program can look solid on paper and still miss the point if a few common mistakes creep in. Watch for these before leaning too hard on a single score.
- Asking the recommendation question without a follow-up “why.” Pairing the main NPS question with an open-ended AskWhy question, built into QuestionPro Survey Software, turns a number into something a team can actually act on.
- Surveying only recent purchasers, which ignores long-time customers who never had a specific reason to respond.
- Treating one quarter’s score as a trend, when a single data point can be skewed by a short-term promotion or an outage.
- Comparing scores across different tools or panels without accounting for sample size and methodology, as outlined above.
- Collecting feedback but never closing the loop with unhappy customers, which lets the same complaints repeat quarter after quarter.
How to measure and improve your own NPS
Measuring your own NPS does not require guesswork. The same process that produced Best Buy’s benchmark works for any retail brand, regardless of size.
1. Ask the right question
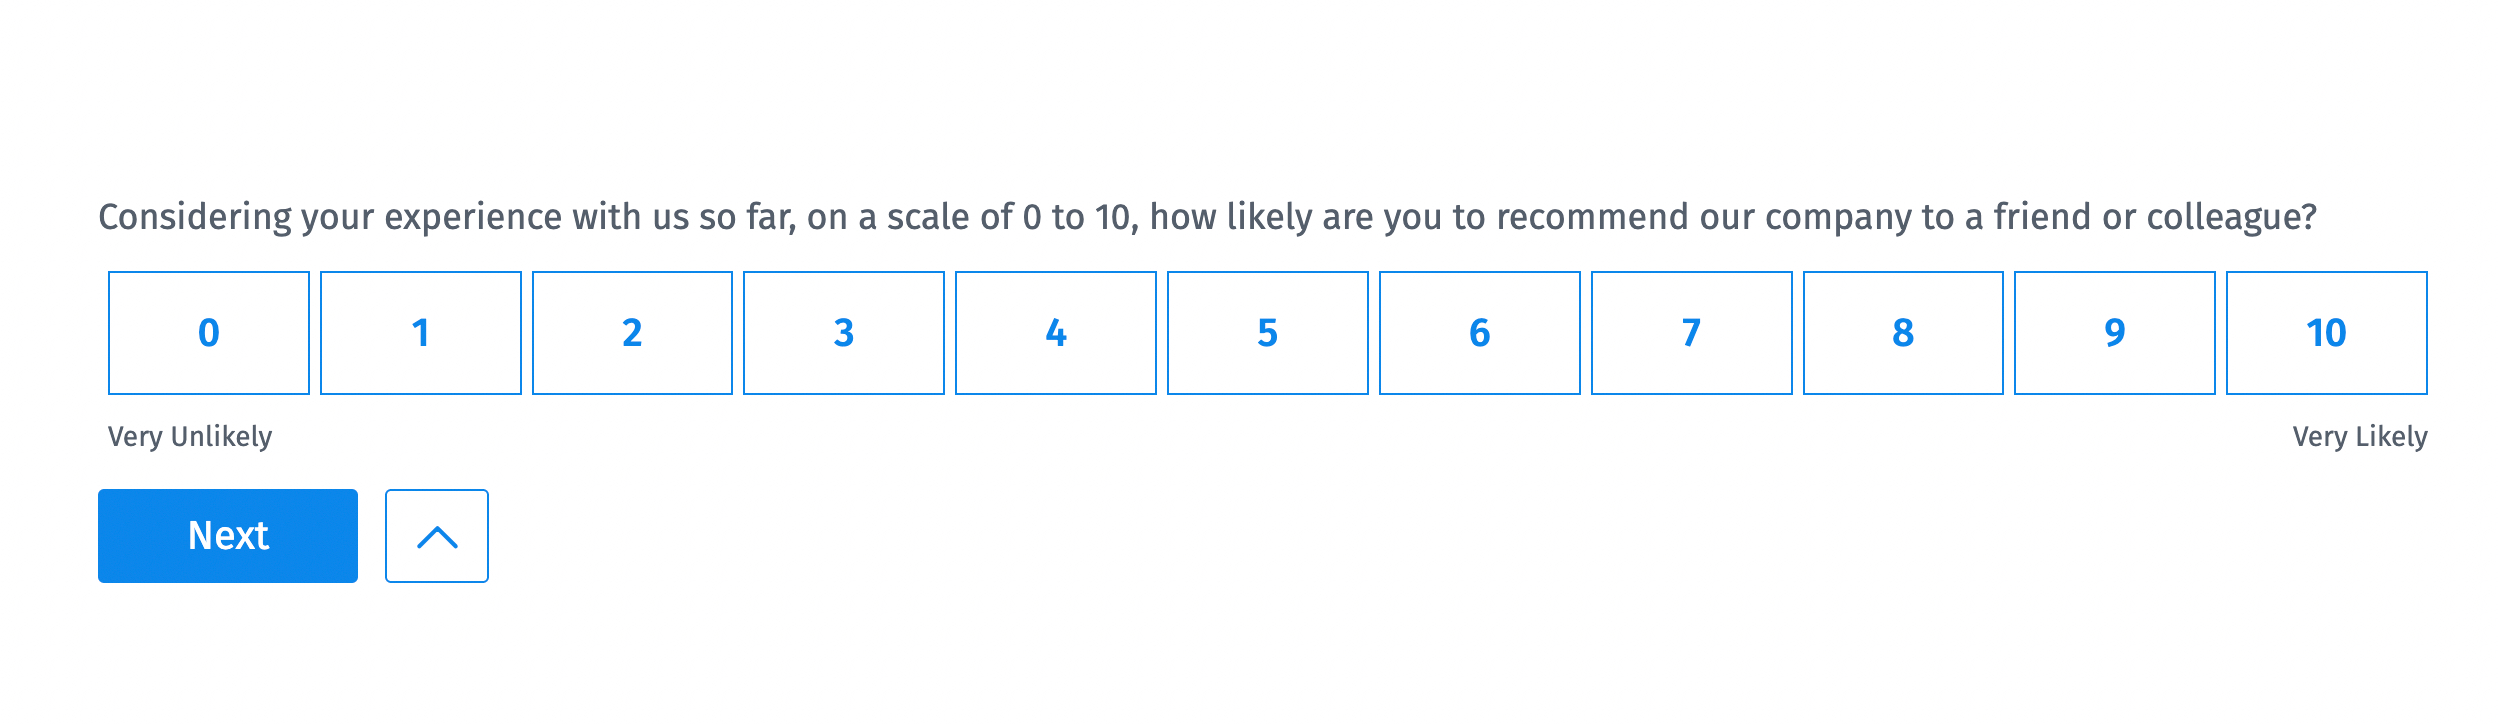
Start with the standard NPS question: “On a scale from 0 to 10, how likely are you to recommend our company to a friend or colleague?” Add a short open-ended follow-up asking why, since the reason behind the number is what actually points to an action.
2. Reach a representative sample
Distribute the survey across the channels your customers already use: email, SMS, QR codes on receipts, or a short prompt inside your app. A sample that only includes one channel will skew the result.
3. Track results as they come in
Your NPS calculates automatically as responses arrive. Watching the live split between Promoters, Passives, and Detractors matters more than waiting for a single end-of-quarter number.
4. Act on what detractors tell you
The real value of NPS comes from what happens after the survey closes. Identify the specific friction point behind low scores and fix it, whether that is a checkout delay, a stockout, or a slow support response.
Platforms like QuestionPro Customer Experience automate this cycle, from sending the survey to flagging detractors for follow-up, so retail teams spend less time compiling spreadsheets and more time acting on what customers actually said.
What Best Buy’s NPS score means for retail brands
Best Buy’s 2025 NPS score is a reminder that customer loyalty in retail is built from specific, repeatable decisions, not luck. Personalization, a loyalty program people actually use, and staff who know the product all show up in the final number.
The score itself is less interesting than what produced it. Any retail brand willing to ask customers directly, and act on what it hears, can move its own NPS in the same direction.
Want to know how your brand measures up in customer loyalty? The Q1 2025 NPS Benchmark Report reveals how top companies are earning trust and turning customers into promoters.
Get insights into industry benchmarks, see where you stand, and learn what the best in the business are doing to stay ahead.
Need help improving your score? QuestionPro’s experts can guide you with personalized strategies to boost satisfaction and retention.
Frequently Asked Questions (FAQs)
Most researchers consider any positive score above 0 acceptable, 30 to 50 strong, and anything above 70 exceptional. Best Buy’s score of 43 falls in the strong range, ahead of the 37 retail average reported in QuestionPro’s Q1 2025 benchmark study.
Best Buy gathers feedback through post-purchase emails, in-store receipt surveys, its 5 Star program, and Geek Squad service follow-ups. Combining in-store and online touchpoints gives the company a fuller view of the omnichannel experience most shoppers expect today.
Best Buy references relationship NPS trends during quarterly earnings calls but does not publish an exact public number. Independent benchmark studies, like QuestionPro’s quarterly retail report, fill that gap by surveying consumers directly and calculating the score externally.
QuestionPro refreshes its NPS and CSAT benchmark report every quarter, resurveying 1,000 U.S. consumers across major retail brands each time. That cadence makes it possible to track whether a brand’s score is improving, declining, or holding steady between releases.
Yes. Two brands with identical NPS can have very different Promoter and Detractor mixes. One might have many passionate fans and a handful of vocal critics, while another earns mostly lukewarm, passive responses with almost no detractors at all.
Best Buy isn’t the only company in the grocery industry with valuable lessons for those looking to improve their customer service and experience. Below, we recommend a few articles where you can learn how other major brands manage to maintain a high NPS and a loyal customer base — you’ll surely find some useful insights along the way.