
Customer journey analytics metrics help businesses understand how customers actually move through experiences over time, not how teams assume they do. Instead of reviewing single touchpoints or isolated KPIs, these metrics focus on sequences of actions, timing, and outcomes across the full analytics journey.
In the USA, where customers switch devices, channels, and brands quickly, journey-level metrics often explain behavior that traditional dashboards miss.
In this blog, we’ll explain what customer journey analytics metrics are, which ones matter most, how they work in practice, and how businesses use them to make better decisions.
What are customer journey analytics metrics?
Customer journey analytics metrics measure how customers progress through a defined journey from start to finish. A journey is a sequence of steps, such as onboarding, purchasing, renewing, or resolving a support issue.
Unlike traditional metrics that look at averages or single events, journey metrics focus on:
- Order of actions
- Time between steps
- Repeated behaviors
- Where customers exit or stall
In simple terms, they explain how customers move, not just what happened at one point in time.
How do journey metrics differ from traditional KPIs?
Traditional KPIs like conversion rate, net promoter score (NPS), or churn tell you what changed. Customer journey analytics metrics explain why those changes occurred.
For example:
- A drop in conversion rate shows that a problem exists
- Journey metrics show which step caused the drop and what happened before it
KPIs summarize outcomes. Journey metrics analyze behavior paths. Strong organizations use both together rather than choosing one over the other.
Which customer journey metrics matter most in an analytics journey?
An analytics journey is the full sequence of measurable customer actions across channels and over time. Not every journey needs dozens of metrics. The most useful analytics journey metrics consistently answer where customers succeed, struggle, or disengage.
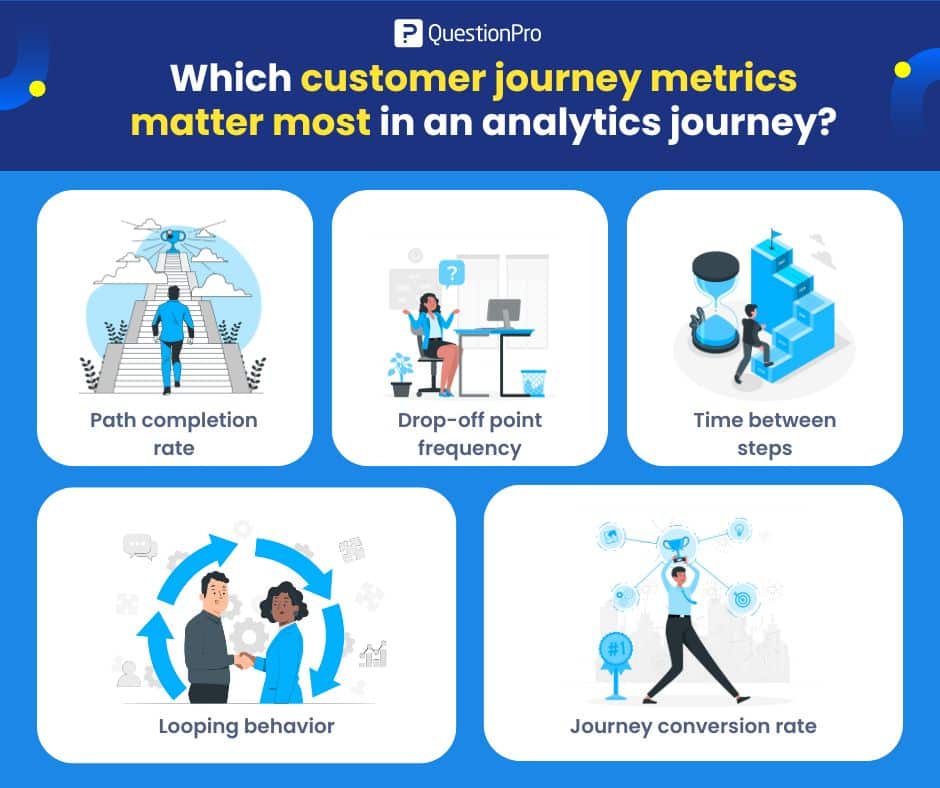
1. Path completion rate
Path completion rate measures how many customers finish a defined journey. For example, how many users who start onboarding reach activation.
It is especially useful for spotting where journeys quietly fail.
Key signals it reveals:
- Steps where customers consistently drop out
- Journeys that look fine at a touchpoint level but fail overall
Low completion usually signals friction, unclear steps, or misaligned timing. It is one of the fastest ways to identify broken journeys.
2. Drop-off point frequency
This metric shows where customers most often leave the journey. High drop-offs at the same step across segments usually point to structural issues, not user error.
Businesses often pair this with session replays or feedback to confirm the cause.
3. Time between steps
Time-based metrics track how long customers take to move from one step to the next. Long gaps often indicate confusion, waiting, or a lack of motivation.
In the USA, where instant fulfillment and fast support are common expectations, long delays can directly impact loyalty and revenue.
4. Looping behavior
Looping occurs when customers repeat the same step multiple times, such as revisiting pricing pages or reopening support tickets.
Loops often signal missing information or unresolved problems. Persistent loops are strong predictors of churn.
5. Journey conversion rate
Journey conversion rate measures how many customers reach the intended outcome of the journey. It can be:
- Purchase
- Renewal
- Successful resolution
This metric is more meaningful than page or event level conversion because it reflects the entire experience, not a single click.
Learn more: Key performance indicators, metrics, & example
How does an analytics journey map make metrics actionable?
An analytics journey map is a visual representation of the steps customers take, enriched with metrics at each stage. It combines flow diagrams with real behavioral data.
When metrics are layered onto an analytics journey map, businesses can:
- See where most customers exit
- Compare fast vs slow paths
- Identify loops and detours
- Segment journeys by customer type
The value comes from context. A number alone is abstract. A number tied to a visible step in a journey is actionable.
Learn more: How to create a customer journey map
What are examples of customer journey analytics?
Customer journey analytics examples help businesses understand how metrics work in real situations rather than theory.
1. Onboarding journeys
SaaS teams often analyze onboarding journeys to reduce early churn. Metrics like time to first value, step completion rate, and looping behavior reveal where new users get stuck.
Many US-based product teams shorten onboarding by removing steps with high drop-off rather than adding more guidance.
2. E-commerce purchase journeys
Retail businesses analyze browsing-to-checkout journeys to understand abandonment. Drop-off frequency and time between steps often highlight shipping cost surprises or payment friction.
According to the Baymard Institute, unexpected costs are a leading cause of cart abandonment in the USA. Journey metrics help quantify exactly where this happens.
3. Support resolution journeys
Support teams track journeys from ticket creation to resolution. Metrics like number of loops, handoffs, and resolution time show where customers experience delays. These insights often drive changes in routing rules or self-service content.
Learn more: What is a post-purchase survey + best practices
How to collect journey metrics accurately?
Journey metrics depend on connected data. If events cannot be reliably tied to the same customer, the analysis breaks down.
Start with one business question.
For example:
Why do US trial users fail to activate?
Then choose metrics that directly explain that outcome. Avoid vanity metrics and resist dashboards that track everything.
Strong setups include:
- Identity resolution across channels
- Event-level tracking rather than session summaries
- Consistent definitions for steps and outcomes
- Clear journey boundaries
This is where platforms designed for Customer journey analytics become essential, because they focus on sequence and identity rather than isolated events.
How to use journey metrics step by step?
Customer journey analytics metrics are only useful when they lead to action. A simple step-by-step approach keeps teams focused.
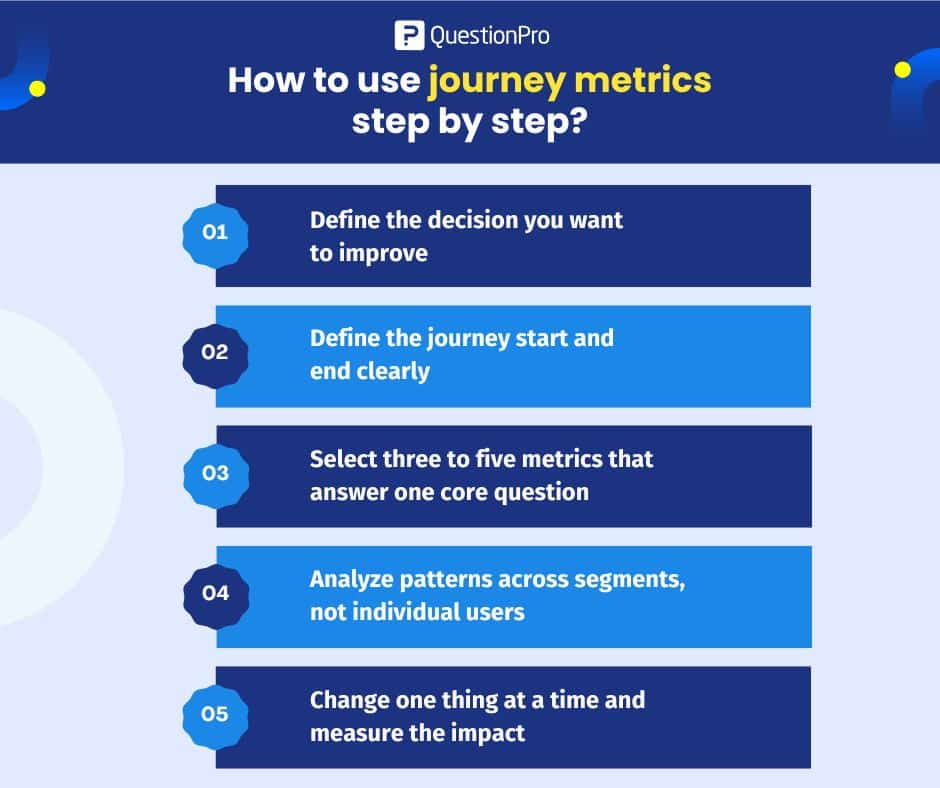
- Define the decision you want to improve, such as reducing churn in the first 90 days.
- Define the journey start and end clearly.
- Select three to five metrics that answer one core question.
- Analyze patterns across segments, not individual users.
- Change one thing at a time and measure the impact.
Teams that try to optimize everything at once usually stall. Focus creates results.
Next read: How to use customer journey analytics effectively
What are the pros and cons of customer journey analytics metrics?
Customer journey analytics metrics offer deeper visibility into how customers actually move through experiences, but they are not without tradeoffs. Understanding both the benefits and the limitations helps companies use these metrics with purpose, not just curiosity.
Pros
- Explain why KPIs move
- Reveal hidden friction
- Support cross-team alignment
- Reflect real customer behavior
Cons
- Require clean, connected data
- Take time to implement correctly
- Can overwhelm teams if overused
Journey metrics are powerful, but only when you resist the urge to track everything.
How QuestionPro measures customer journey analytics metrics?
QuestionPro helps businesses track customer journey analytics metrics by linking feedback to real journey steps rather than isolated moments. Surveys are triggered at key interactions, so metrics reflect what just happened.
QuestionPro supports journey measurement through:
- Event-based survey triggers tied to specific journey steps
- Consistent feedback collection across channels and touchpoints
- Timing controls that reduce recall bias
Journey-level segmentation allows teams to compare how different customer groups move through the same journey and where paths diverge, including differences across US markets or channels.
For analysis, journey metrics are brought into a single view, making it easier to connect step feedback to outcomes. Businesses can then share insights, act on specific friction points, and track whether changes actually improve the journey over time.
Recommended read: 11 Best Customer Journey Analytics Software
How trustworthy are customer journey analytics metrics?
Trust depends on data quality. Events must be consistently defined, identities must be accurate, timestamps must be reliable, and time zones must be handled consistently.
Strong metrics are boring by design. If results look dramatic without explanation, something is usually broken upstream.
Frequently Asked Questions (FAQs)
Answer: Customer journey analytics metrics measure how customers move through a defined sequence of steps over time, focusing on order, timing, and outcomes rather than single events.
Answer: US-based teams often use journey metrics to reduce churn, speed up onboarding, improve ecommerce conversion, and streamline support, especially where customer expectations are high.
Answer: No. They explain why KPIs change. Both are needed to understand performance and behavior together.
Answer: Most teams get the best results by tracking three to five metrics per journey. More than that usually reduces clarity.
Answer: Tools that support identity resolution, event-level tracking, and visual journey mapping are best suited for journey analytics.
Answer: Yes. Even small teams benefit when they focus on one journey and a few clear metrics tied to a decision.