• Skip to main content
  • Skip to primary sidebar
  • Skip to footer
QuestionPro

QuestionPro

questionpro logo
  • Products
    survey software iconSurvey softwareEasy to use and accessible for everyone. Design, send and analyze online surveys.research edition iconResearch SuiteA suite of enterprise-grade research tools for market research professionals.CX iconCustomer ExperienceExperiences change the world. Deliver the best with our CX management software.WF iconEmployee ExperienceCreate the best employee experience and act on real-time data from end to end.
  • Solutions
    IndustriesGamingAutomotiveSports and eventsEducationGovernment
    Travel & HospitalityFinancial ServicesHealthcareCannabisTechnology
    Use CaseAskWhyCommunitiesAudienceContactless surveysMobile
    LivePollsMember ExperienceGDPRPositive People Science360 Feedback Surveys
  • Resources
    BlogeBooksSurvey TemplatesCase StudiesTrainingHelp center
  • Features
  • Pricing
Language
  • English
  • Español (Spanish)
  • Português (Portuguese (Brazil))
  • Nederlands (Dutch)
  • العربية (Arabic)
  • Français (French)
  • Italiano (Italian)
  • 日本語 (Japanese)
  • Türkçe (Turkish)
  • Svenska (Swedish)
  • Hebrew IL (Hebrew)
  • ไทย (Thai)
  • Deutsch (German)
  • Portuguese de Portugal (Portuguese (Portugal))
Call Us
+1 800 531 0228 +1 (647) 956-1242 +52 999 402 4079 +49 301 663 5782 +44 20 3650 3166 +81-3-6869-1954 +61 2 8074 5080 +971 529 852 540
Log In Log In
SIGN UP FREE

Home CX Customer Experience

Data Visualization for CX with Benefits

data visualization for cx

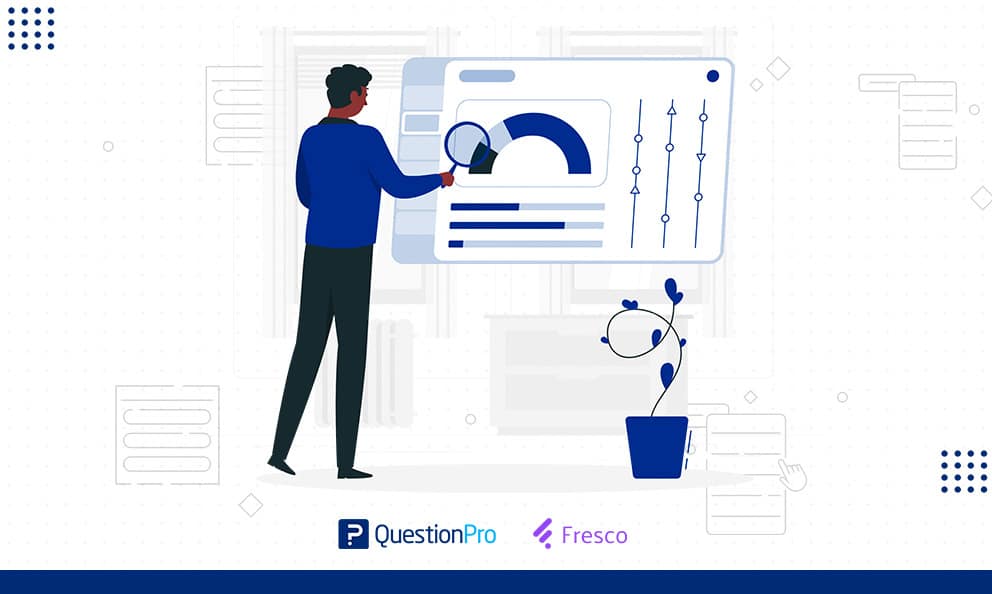
Data visualization has become an increasingly popular way to analyze trends and find patterns that are actionable and grounded in actual data. Doing so would traditionally require a ton of explanation and additional work, but visualizing complex data can make the insights within accessible to anyone. Let’s talk about Data Visualization for CX.

Because of this, data visualization has emerged as an efficient way to inspect and audit customer experience flows. While data visualization can be useful in many different fields, here are some of the reasons it can help improve your customer experience.

Data Visualization for CX can help tell compelling stories

One of the biggest problems with raw data is that it needs to be translated before it can be interpreted. This makes interpreting the story behind the numbers incredibly difficult. If you are a data scientist or have a very keen eye, you’ll be able to spot patterns in a raw data set; otherwise, you’re out of luck.

Data visualization helps alleviate this difficulty by organizing information in a way that creates a narrative around the customer journey and how their experience can be improved.

DV gives customer-related data new importance because it isn’t only about analysis and optimization but the user’s journey through the product. For this reason, it becomes much easier and more applicable to include data when presenting the customer experience.

Whether you’re pitching new changes, highlighting specific issues, or creating the value proposition for your brand, correctly positioning your customer’s experience is key, and data visualization is essential to that process.

Additionally, data can be easily inserted into a customer journey map to help tell their story and find places where their expectations aren’t being met.

Data Visualization for CX helps measure success and progress

It’s easy to look at a successful outcome of customer experience changes when a single person says their experience improved. When you implement changes on a larger scale, however, it becomes harder to understand.

Data visualization helps define specific metrics that, in your team’s eyes, underline what success and progress look like for your customer experience. Pulling these metrics from a large data set can be daunting, but doing so from an organized number of graphs and charts makes the process much easier. Additionally, it becomes less likely that your team will get caught up in useless metrics that don’t move your strategy forward because you will focus on the data and metrics most important to your specific goals.

Experiences change the world. Deliver the best with our CX management software and delight your customers at every touchpoint. Request Demo

It can help connect experiences

Similar to the last point, data visualization can help showcase the underlying truths behind a set of data. In this case, it can help connect feelings and experiences, so you have a better understanding of the root of the customer’s issue.

By comparing different data sets, you can look at how the customer’s experience changes between tasks, over time, or when their goals are different. Very rarely is the experience of a customer siloed to a single place. It usually flows between touchpoints and involves many different channels.

The intersectionality of a customer’s experience is a crucial factor to consider when developing a holistic CX strategy. You must address the connections between related experiences to create a truly all-encompassing CX strategy.

If you’re struggling to find the root of the issue plaguing your customers, try using a Fishbone Diagram to get to the bottom of things.

It can help communicate information between parties

While CX data can be messy and confusing at times, creating visualization pieces can help communicate this data to interested parties and expand the reach of your data.

It’s essential when creating a new CX strategy that everyone is on the same page and is working with the same set of information & assumptions. This won’t be the case unless they all have a nuanced understanding of the data you’re using. Utilizing data visualization techniques can help ensure your entire team understand and applies the data correctly to ensure your results are accurate.

Additionally, when you make data more approachable, you increase the pool of people that can collaborate on your project. Finding new voices and inserting new perspectives into your collaborative process is a great way to discover new ideas; data visualization helps make this possible.

Data Visualization for CX can help reveal unknown patterns or issues

Collecting customer feedback is crucial to improving their experience, but it can sometimes miss out on important underlying issues the user is experiencing. Collecting and visualizing data helps uncover experiential potholes that you might not even realize exist but are harming your overall customer experience.

This is because people are much better at spotting patterns or irregularities when they occur in a picture rather than a set of numbers or words. Allowing people to create visual associations with the presented data makes you more likely to discover new and important issues. 

Data visualization is important to any field but can be especially impactful when used correctly in your customer experience process.


SHARE THIS ARTICLE:

About the author
Paul VanZandt
Paul Van Zandt is the founder and CEO of Fresco, a startup enabling real-time collaboration for people everywhere.
View all posts by Paul VanZandt

Primary Sidebar

Take full control of your customer journey

Make immediate business actions with our CX management platform

Learn more

RELATED ARTICLES

HubSpot - QuestionPro Integration

CX Research Methods: Learn how to choose the right one

Jan 17,2024

HubSpot - QuestionPro Integration

Data Management Strategy: What it is & How to Build It

Aug 26,2022

HubSpot - QuestionPro Integration

Top 11 Team Engagement Software in 2025

Mar 27,2024

BROWSE BY CATEGORY

  • Academic
  • Academic Research
  • Artificial Intelligence
  • Assessments
  • Audience
  • Brand Awareness
  • Business
  • Case Studies
  • Communities
  • Consumer Insights
  • Customer effort score
  • Customer Engagement
  • Customer Experience
  • Customer Loyalty
  • Customer Research
  • Customer Satisfaction
  • CX
  • Employee Benefits
  • Employee Engagement
  • Employee Engagement
  • Employee Retention
  • Enterprise
  • Events
  • Forms
  • Friday Five
  • General Data Protection Regulation
  • Guest Post
  • Insights Hub
  • Life@QuestionPro
  • LivePolls
  • Market Research
  • Marketing
  • Mobile
  • Mobile App
  • Mobile diaries
  • Mobile Surveys
  • New Features
  • non-profit
  • NPS
  • Online Communities
  • Polls
  • Question Types
  • Questionnaire
  • QuestionPro
  • QuestionPro Products
  • Release Notes
  • Research Tools and Apps
  • Revenue at Risk
  • Startups
  • Survey Templates
  • Surveys
  • Tech News
  • Tips
  • Training
  • Training Tips
  • Trending
  • Tuesday CX Thoughts (TCXT)
  • Uncategorized
  • VOC
  • Webinar
  • Webinars
  • What’s Coming Up
  • Workforce
  • Workforce Intelligence

Footer

MORE LIKE THIS

wells-fargo-nps-2025

Wells Fargo NPS 2025: What Businesses Can Learn

May 19, 2025

word-cloud

Word Cloud: What it is & How to Use QuestionPro Word Cloud?

May 16, 2025

synthetic data and ai - market research

Redefining Research Strategy with AI and Synthetic Data

May 15, 2025

Kohl's-NPS-2025

Kohl’s NPS & Satisfaction in 2025

May 15, 2025

Other categories

  • Academic
  • Academic Research
  • Artificial Intelligence
  • Assessments
  • Audience
  • Brand Awareness
  • Business
  • Case Studies
  • Communities
  • Consumer Insights
  • Customer effort score
  • Customer Engagement
  • Customer Experience
  • Customer Loyalty
  • Customer Research
  • Customer Satisfaction
  • CX
  • Employee Benefits
  • Employee Engagement
  • Employee Engagement
  • Employee Retention
  • Enterprise
  • Events
  • Forms
  • Friday Five
  • General Data Protection Regulation
  • Guest Post
  • Insights Hub
  • Life@QuestionPro
  • LivePolls
  • Market Research
  • Marketing
  • Mobile
  • Mobile App
  • Mobile diaries
  • Mobile Surveys
  • New Features
  • non-profit
  • NPS
  • Online Communities
  • Polls
  • Question Types
  • Questionnaire
  • QuestionPro
  • QuestionPro Products
  • Release Notes
  • Research Tools and Apps
  • Revenue at Risk
  • Startups
  • Survey Templates
  • Surveys
  • Tech News
  • Tips
  • Training
  • Training Tips
  • Trending
  • Tuesday CX Thoughts (TCXT)
  • Uncategorized
  • VOC
  • Webinar
  • Webinars
  • What’s Coming Up
  • Workforce
  • Workforce Intelligence

questionpro-logo-nw
Help center Live Chat SIGN UP FREE
  • Sample questions
  • Sample reports
  • Survey logic
  • Branding
  • Integrations
  • Professional services
  • Security
  • Survey Software
  • Customer Experience
  • Workforce
  • Communities
  • Audience
  • Polls Explore the QuestionPro Poll Software - The World's leading Online Poll Maker & Creator. Create online polls, distribute them using email and multiple other options and start analyzing poll results.
  • Research Edition
  • LivePolls
  • InsightsHub
  • Blog
  • Articles
  • eBooks
  • Survey Templates
  • Case Studies
  • Training
  • Webinars
  • All Plans
  • Nonprofit
  • Academic
  • Qualtrics Alternative Explore the list of features that QuestionPro has compared to Qualtrics and learn how you can get more, for less.
  • SurveyMonkey Alternative
  • VisionCritical Alternative
  • Medallia Alternative
  • Likert Scale Complete Likert Scale Questions, Examples and Surveys for 5, 7 and 9 point scales. Learn everything about Likert Scale with corresponding example for each question and survey demonstrations.
  • Conjoint Analysis
  • Net Promoter Score (NPS) Learn everything about Net Promoter Score (NPS) and the Net Promoter Question. Get a clear view on the universal Net Promoter Score Formula, how to undertake Net Promoter Score Calculation followed by a simple Net Promoter Score Example.
  • Offline Surveys
  • Customer Satisfaction Surveys
  • Employee Survey Software Employee survey software & tool to create, send and analyze employee surveys. Get real-time analysis for employee satisfaction, engagement, work culture and map your employee experience from onboarding to exit!
  • Market Research Survey Software Real-time, automated and advanced market research survey software & tool to create surveys, collect data and analyze results for actionable market insights.
  • GDPR & EU Compliance
  • Employee Experience
  • Customer Journey
  • Synthetic Data
  • About us
  • Executive Team
  • In the news
  • Testimonials
  • Advisory Board
  • Careers
  • Brand
  • Media Kit
  • Contact Us

QuestionPro in your language

  • English
  • Español (Spanish)
  • Português (Portuguese (Brazil))
  • Nederlands (Dutch)
  • العربية (Arabic)
  • Français (French)
  • Italiano (Italian)
  • 日本語 (Japanese)
  • Türkçe (Turkish)
  • Svenska (Swedish)
  • Hebrew IL (Hebrew)
  • ไทย (Thai)
  • Deutsch (German)
  • Portuguese de Portugal (Portuguese (Portugal))

Awards & certificates

  • survey-leader-asia-leader-2023
  • survey-leader-asiapacific-leader-2023
  • survey-leader-enterprise-leader-2023
  • survey-leader-europe-leader-2023
  • survey-leader-latinamerica-leader-2023
  • survey-leader-leader-2023
  • survey-leader-middleeast-leader-2023
  • survey-leader-mid-market-leader-2023
  • survey-leader-small-business-leader-2023
  • survey-leader-unitedkingdom-leader-2023
  • survey-momentumleader-leader-2023
  • bbb-acredited
The Experience Journal

Find innovative ideas about Experience Management from the experts

  • © 2022 QuestionPro Survey Software | +1 (800) 531 0228
  • Sitemap
  • Privacy Statement
  • Terms of Use