Progressive NPS 2025 data points to a familiar problem in auto insurance. Fast quotes and competitive rates do not automatically build lasting loyalty. Progressive posts a Net Promoter Score of 15, a number that lags well behind the insurance industry average.
The insurer built its reputation on speed, price transparency, and digital convenience. Yet many policyholders describe a service experience that feels transactional rather than personal, especially right after a claim.
In this article, we’ll break down Progressive’s 2025 NPS score, compare it with rivals like USAA and State Farm, and unpack what is holding back customer advocacy. We’ll also cover practical ways any insurer can measure and improve its own score.
What is a net promoter score (NPS)?
Net Promoter Score (NPS) is a one-question metric that measures customer loyalty and the likelihood of a recommendation. It asks a single, direct question: on a scale of 0 to 10, how likely are you to recommend a company to a friend or colleague?
Responses sort customers into three groups.
- Promoters (9 to 10): Loyal customers who actively recommend the brand.
- Passives (7 to 8): Satisfied but unenthusiastic customers who rarely refer others.
- Detractors (0 to 6): Unhappy customers who may discourage others from buying.
The Net Promoter Score formula subtracts the detractor percentage from the promoter percentage. Scores range from -100 to +100, with higher numbers signaling stronger loyalty and lower churn risk.
How is NPS different from CSAT?
NPS and CSAT (Customer Satisfaction Score) measure related but different things. Mixing them up leads insurers to fix the wrong problem.
| Metric | What it measures | Question asked | Typical scale |
| NPS | Long-term loyalty and referral likelihood | Would you recommend us? | -100 to +100 |
| CSAT | Satisfaction with one interaction | How satisfied were you? | 1 to 5, or a percentage |
NPS predicts whether a customer will stay and refer others over time. CSAT captures how a single touchpoint felt, such as one claims call or one policy renewal. Progressive’s Q1 2025 benchmark tracks NPS specifically, the metric this article focuses on.
What is Progressive’s NPS score in 2025?
Progressive’s NPS score is 15 in 2025, according to QuestionPro’s Q1 2025 Benchmarking NPS and CSAT Report. That places the insurer 8 points below the insurance industry average of 23.
The report surveyed 1,000 U.S. customers and split Progressive’s respondents into three groups.
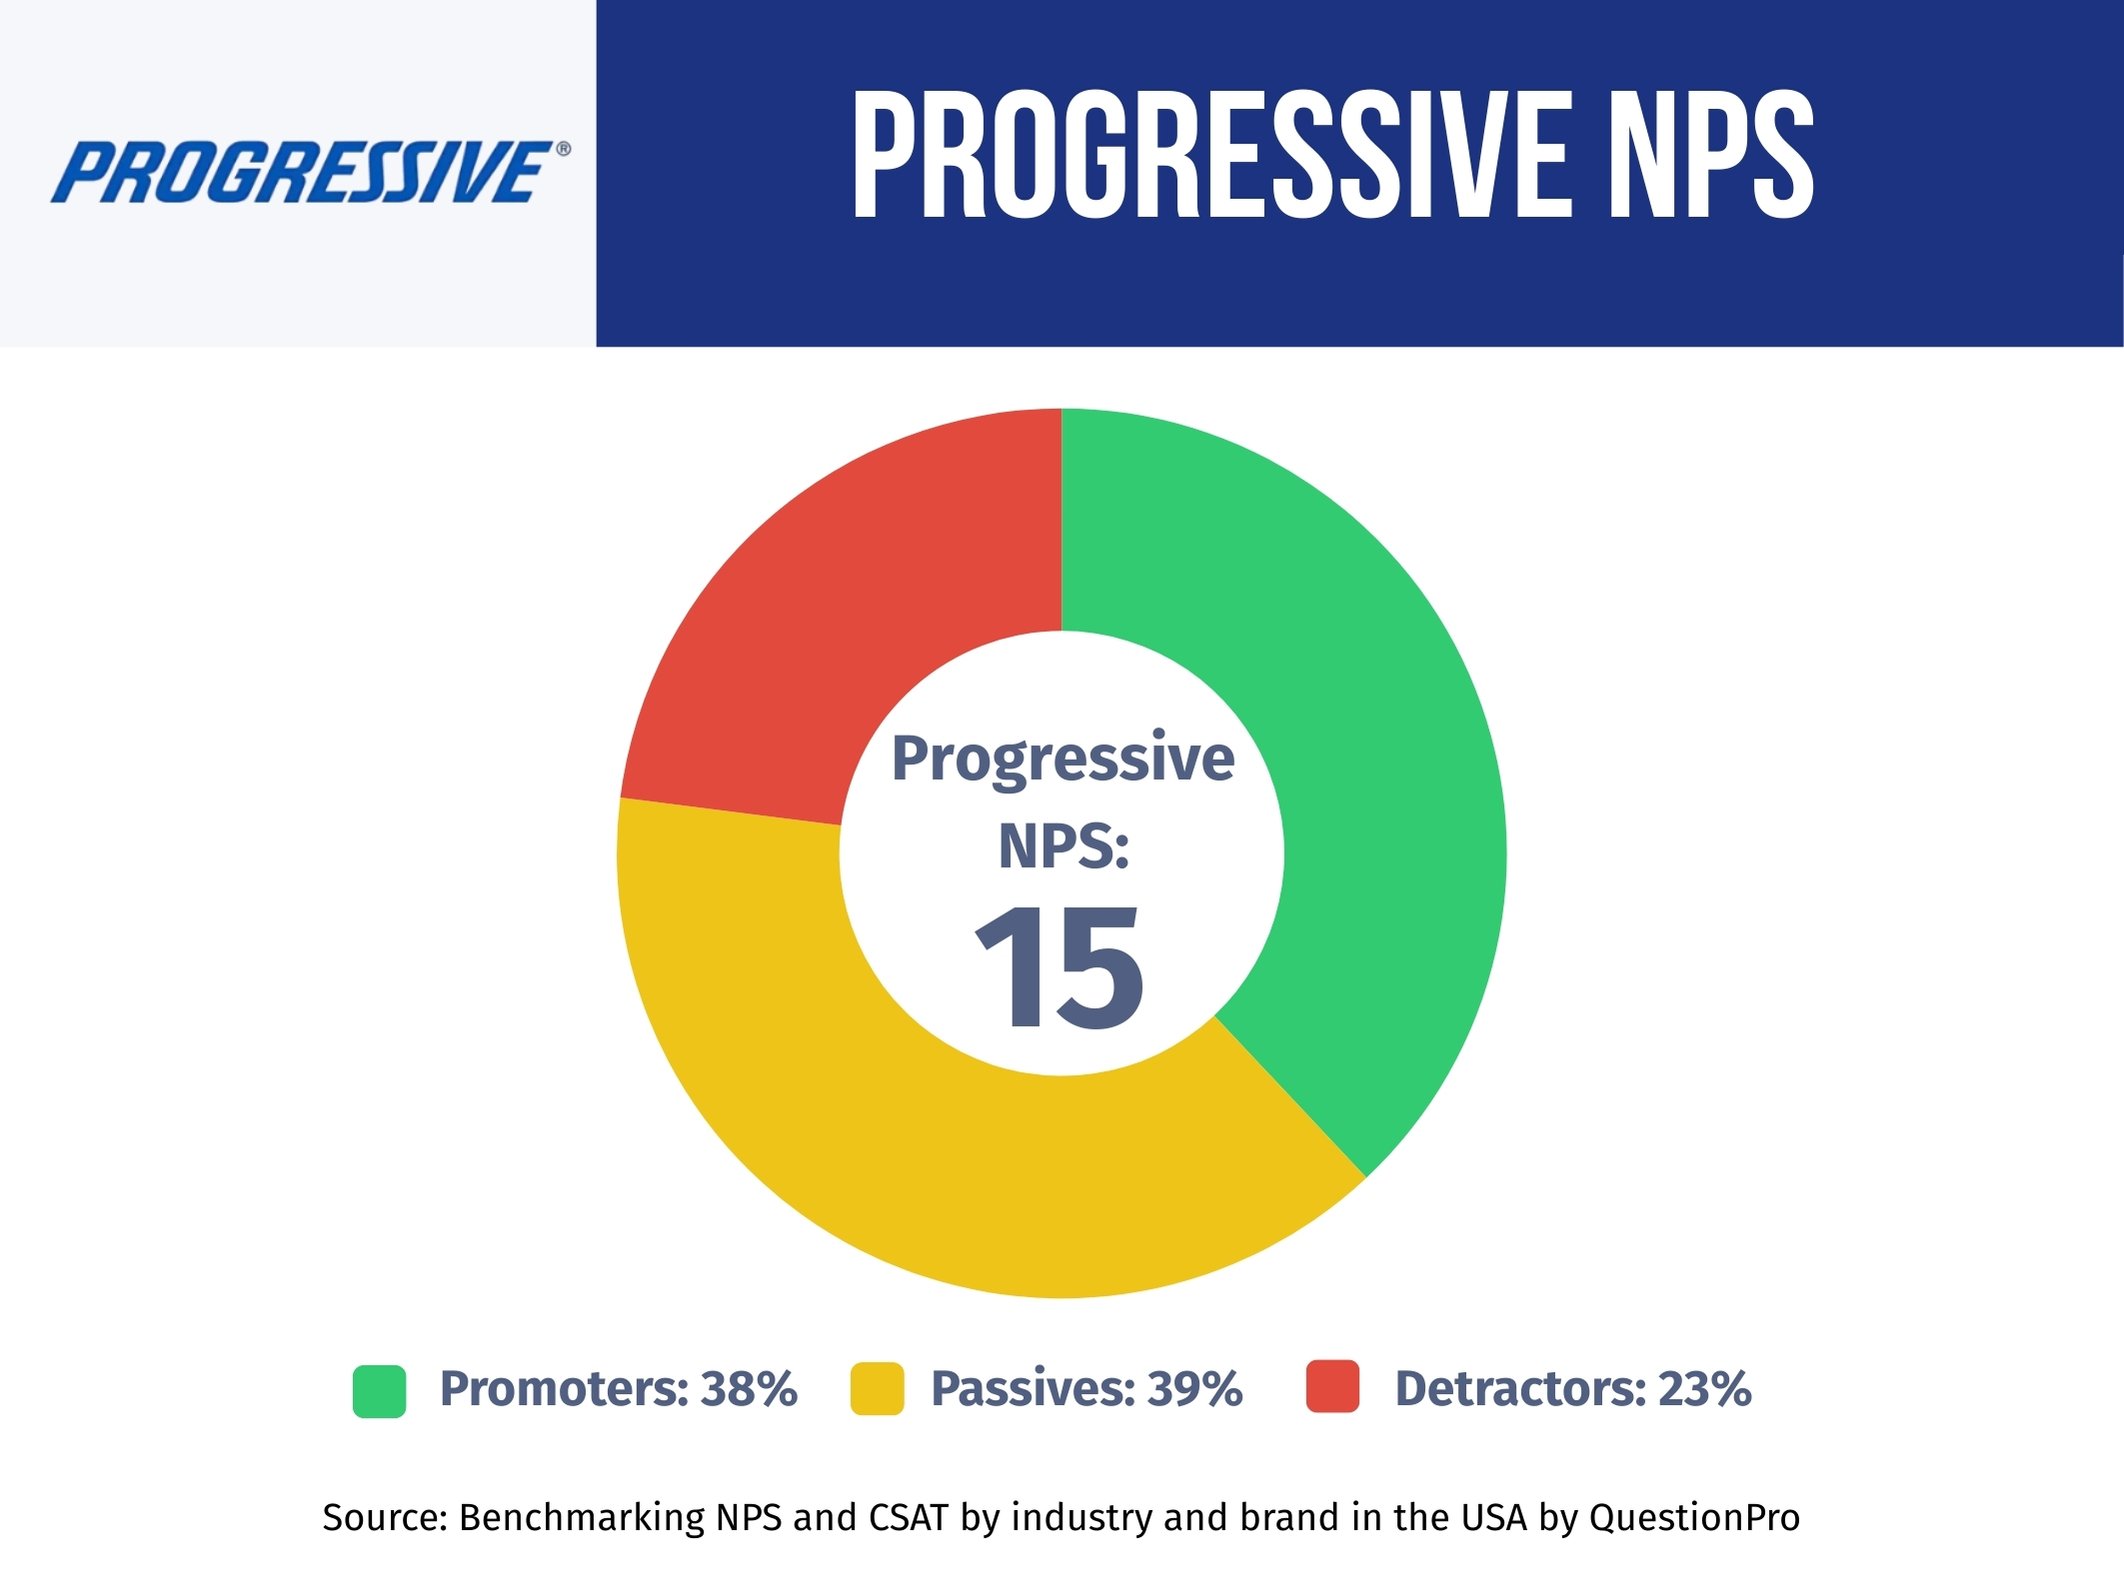
- Promoters: 38%
- Passives: 39%
- Detractors: 23%
Subtracting 23% detractors from 38% promoters produces the score of 15. Only about a third of Progressive customers act as active advocates, while a large passive middle of 39% represents customers who stay but rarely recommend the brand.
How does Progressive’s NPS compare to competitors and the industry average?
Progressive’s score of 15 trails most of its national rivals. The gap is widest against membership-driven insurers built around a single, loyal customer base.
| Insurer | NPS score | Standing vs. industry average (23) |
| USAA | 54 | 31 points above |
| State Farm | 28 | 5 points above |
| Insurance average | 23 | Benchmark |
| GEICO | 20 | 3 points below |
| Progressive | 15 | 8 points below |
| Allstate | 13 | 10 points below |
USAA’s lead comes from a service model built around military families, where roughly seven in ten customers actively recommend the brand. Progressive sits closer to GEICO and Allstate in a lagging tier shaped by shared industry pressures, not one company’s failure alone.
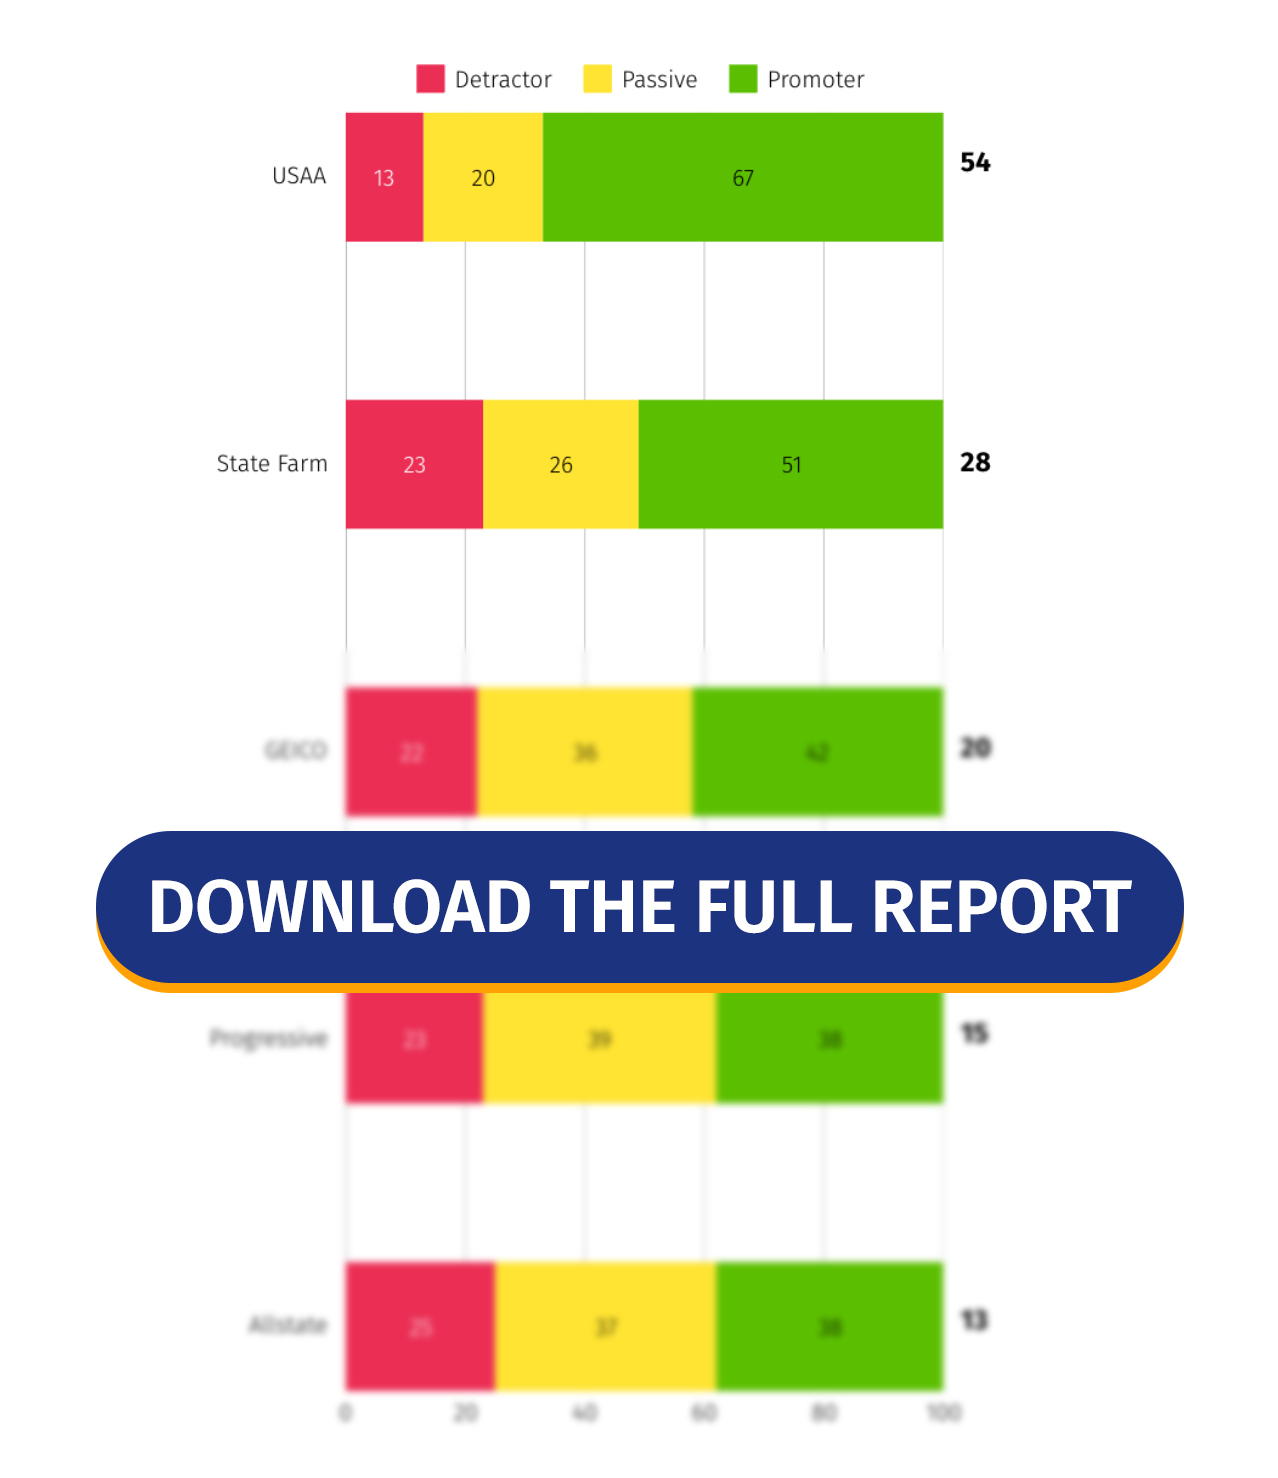
These insights come from QuestionPro’s latest study, which surveyed 1,000 participants to measure NPS across leading companies and industries. The report is based on real customer feedback from Q1 2025 and is updated quarterly.
We invite you to download the full report. It’s a valuable resource for evaluating your company’s performance and determining your customers’ perceptions of you.
Why is Progressive’s NPS lower than top insurers?
Three recurring patterns explain the gap between Progressive and higher-scoring rivals.
- Transactional focus. Progressive competes mainly on price and speed, which attracts price-sensitive shoppers but builds little emotional connection once a policy is active.
- Mixed claims experiences. Some customers report fast, clear claims handling, while others describe delays and vague updates after an accident.
- A large passive middle. At 39% passives, many customers are satisfied enough to renew but not moved enough to recommend the brand to others.
These pressures are not unique to Progressive. State Farm’s agent-driven service model shows one way rivals close this exact gap, by pairing digital convenience with a human relationship during claims.
Consider a typical scenario. A customer files a claim after a minor accident, gets an instant digital confirmation, then waits days for an adjuster update with no clear timeline. The digital front end felt modern, but the actual resolution felt slow and impersonal. That mismatch between a polished app and an uneven claims process is exactly where passives form instead of promoters.
What is Progressive doing right despite the low score?
Progressive’s NPS score tells only part of the story. The insurer tied for third place in the J.D. Power 2025 U.S. Insurance Digital Experience Study, with a service score of 715, just behind Nationwide and Amica.
The company also posted a combined ratio of 87.5 in 2025, a sign of strong underwriting discipline in a softening market. Progressive led the industry in new auto policy growth during the year, outpacing State Farm and GEICO in new business.
That growth comes with a catch. Progressive also recorded the highest customer churn among major auto insurers in 2025, and shopping activity among its own policyholders rose in the final quarter of the year. Strong acquisition numbers do not fix a loyalty problem on their own. They can mask one, at least until renewal season arrives.
This is a pattern worth watching for any insurer, not just Progressive. A brand can win on price and digital convenience at the point of sale while still losing the relationship over the life of the policy. The two numbers that matter together are new business growth and retention, not either one in isolation.
What common mistakes hold back insurance NPS scores?
Insurers trying to close a loyalty gap often repeat the same missteps.
- Treating growth as proof of loyalty.
High new-policy volume can hide rising churn and a shrinking base of true advocates. - Ignoring the passive middle.
Passives rarely complain, so teams focus on detractors and miss the larger group at risk of quietly leaving. - Running NPS as a one-time survey.
A single measurement cannot show whether service changes are actually working over time. - Fixing price instead of experience.
Discount-driven retention slows churn temporarily but rarely converts detractors into promoters. - Skipping the follow-up question.
A score without an open-ended reason leaves teams guessing at what actually drove a detractor’s rating.
How can insurers measure and improve NPS?
Measuring NPS well takes more than sending one survey and hoping for a high score. A repeatable process turns raw numbers into fixes customers actually notice.
- Launch a focused NPS survey. Use a ready-made NPS survey template with the core recommendation question, plus one open-ended follow-up asking why.
- Distribute it everywhere customers are. Share the survey by email, SMS, QR code, or direct link so response rates stay strong across channels.
- Read results as they arrive. A live dashboard should sort responses into promoters, passives, and detractors automatically, without manual tallying.
- Act on detractor feedback fast. Route negative responses to the team that can fix the issue while the experience is still fresh.
- Track the score every quarter. A single NPS reading is a snapshot. Quarterly tracking shows whether changes are actually working.
- Segment by moment, not just by customer. A score taken right after a claim tells a different story than one taken at renewal. Insurers that track NPS by touchpoint can pinpoint exactly where loyalty breaks down instead of guessing at a single company-wide number.
QuestionPro Customer Experience supports this cycle from survey design through detractor recovery workflows that route unhappy responses to the right team automatically.
Where Progressive’s NPS goes from here
Progressive’s NPS of 15 is not a crisis, but it is a signal. The insurer still has more promoters than detractors, and its digital tools and pricing keep new customers coming in the door.
The real opportunity sits with the 39% of customers stuck in the passive middle. Converting even a portion of that group into promoters would move the score faster than any pricing change, and it costs far less than acquiring a new customer from scratch.
Loyalty in insurance gets built one resolved claim and one clear conversation at a time. A faster adjuster update, a transparent renewal notice, or a proactive check-in after a policy change can each nudge a passive customer closer to becoming an advocate. The next quarterly benchmark will show whether that shift is underway.
Want to know how leading Insurance companies earn loyalty and high NPS? Get the Q1 2025 NPS Benchmark Report to see how leading companies drive customer satisfaction and find strategies to keep their customers returning.
Want to increase your NPS? Contact the experts at QuestionPro for proper advice on measuring and improving customer satisfaction.
Frequently Asked Questions (FAQs)
A good NPS score in insurance typically sits above the industry average of 23, based on QuestionPro’s Q1 2025 benchmark. Scores above 50, like USAA’s 54, are considered excellent and reflect strong, consistent customer advocacy across most touchpoints.
Research firms survey different customer samples, ask slightly different questions, and calculate scores over different time periods. A report showing a lower or negative score for Progressive likely reflects a different sample than the 1,000-customer QuestionPro benchmark cited here.
Not necessarily. A low NPS points to a loyalty and advocacy gap, not overall quality. Progressive ranks competitively on price and digital tools, according to J.D. Power, even while its promoter base stays smaller than top-scoring rivals like USAA.
Most insurers benefit from measuring NPS quarterly, aligned with claims cycles and renewal periods. Frequent measurement catches service issues early and shows whether changes to claims handling or communication are actually improving loyalty.
Yes. Passives are typically satisfied but not emotionally engaged. Proactive check-ins, transparent pricing communication, and faster claims resolution are the most common ways insurers move passive customers into promoters over a few renewal cycles.