• Skip to main content
  • Skip to primary sidebar
  • Skip to footer
QuestionPro

QuestionPro

questionpro logo
  • Products
    survey software iconSurvey softwareEasy to use and accessible for everyone. Design, send and analyze online surveys.research edition iconResearch SuiteA suite of enterprise-grade research tools for market research professionals.CX iconCustomer ExperienceExperiences change the world. Deliver the best with our CX management software.WF iconEmployee ExperienceCreate the best employee experience and act on real-time data from end to end.
  • Solutions
    IndustriesGamingAutomotiveSports and eventsEducationGovernment
    Travel & HospitalityFinancial ServicesHealthcareCannabisTechnology
    Use CaseAskWhyCommunitiesAudienceContactless surveysMobile
    LivePollsMember ExperienceGDPRPositive People Science360 Feedback Surveys
  • Resources
    BlogeBooksSurvey TemplatesCase StudiesTrainingHelp center
  • Features
  • Pricing
Language
  • English
  • Español (Spanish)
  • Português (Portuguese (Brazil))
  • Nederlands (Dutch)
  • العربية (Arabic)
  • Français (French)
  • Italiano (Italian)
  • 日本語 (Japanese)
  • Türkçe (Turkish)
  • Svenska (Swedish)
  • Hebrew IL (Hebrew)
  • ไทย (Thai)
  • Deutsch (German)
  • Portuguese de Portugal (Portuguese (Portugal))
Call Us
+1 800 531 0228 +1 (647) 956-1242 +52 999 402 4079 +49 301 663 5782 +44 20 3650 3166 +81-3-6869-1954 +61 2 8074 5080 +971 529 852 540
Log In Log In
SIGN UP FREE

Home QuestionPro New Features

Turn Up Your Spider Senses with Spider Charts

QuestionPro Spider Charts

The only kind of spiders I like are spider charts. Also known as a radar chart, spider charts offer the opportunity to display multivariate data in the form of a two-dimensional diagram of three or more quantitative variables. These are represented on an axis starting from the middle of the chart. This makes them useful for seeing which variables have similar values or if there are any outliers amongst them.

Making your Web: How To Set Up Spider Charts for Analysis

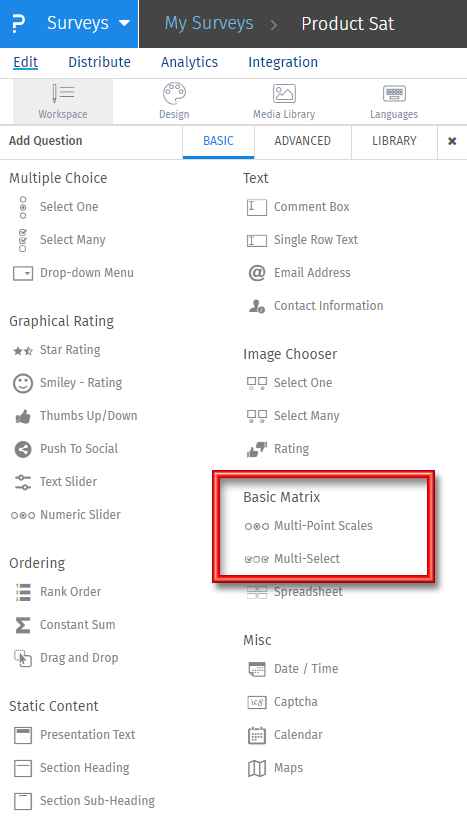
Spider charts can be found in QuestionPro under the Analysis menu on the Dashboard report when you include a multi-point scale or multi-select matrix table question type.

Spider Chart QuestionPro Survey

As a best practice, we recommend considering how many variables you would plan to use in your matrix table for the best view of the spider chart. Having too many variables creates too many axes and can make the spider chart hard to read. If possible, keep it simple and limit the number of variables to 10 or less.

However, market researchers usually have extensive matrix table questions to ask; therefore, we’ve created a solution to report spider charts on long matrix tables by using an artificial intelligence based algorithm. By default, the spider chart will display a combination of the top 5 and bottom 5 variables based on the mean scores. If you don’t like top and bottom 5, no problem! You can customize the spider chart under the dashboard report settings. This algorithm will be used only if the number of variables exceeds 10. If the variables are equal to or less than 10, then all the variables with mean will be shown in the spider chart.

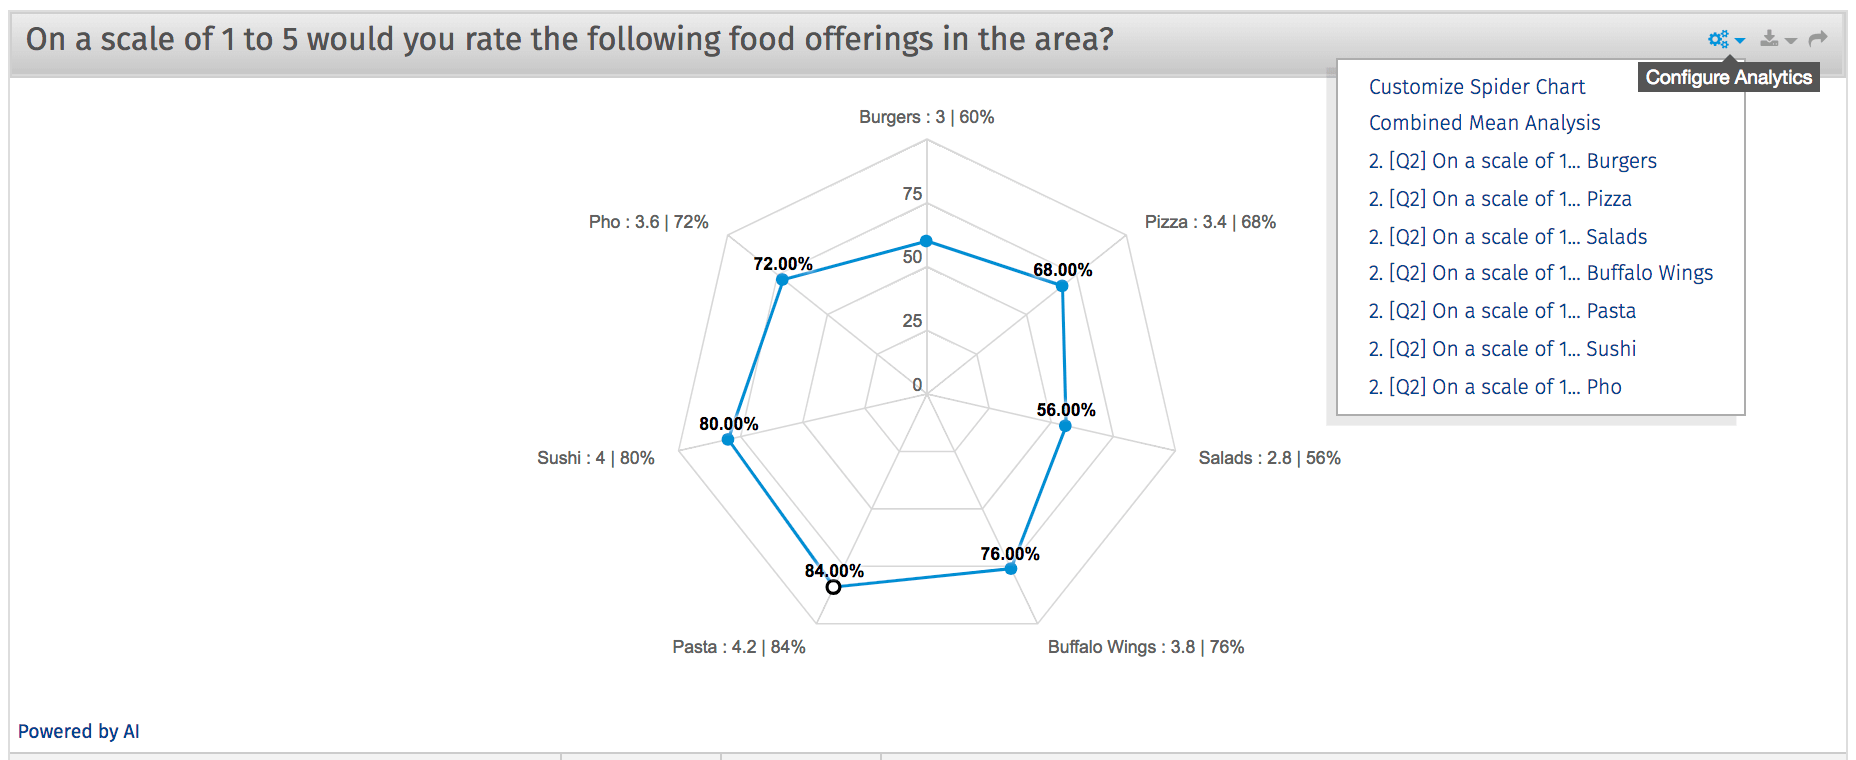
To customize a spider chart go to:

Reports » Configure Analytics » Customize Spider Chart

Customize Spider Chart

After selecting ‘Customize Spider Chart,’ the top 5 and bottom 5 options displayed will be checked and color coded. Green represents top 5 variables and red represents bottom 5 variables based on the mean scores.

Spider Chart Review Test

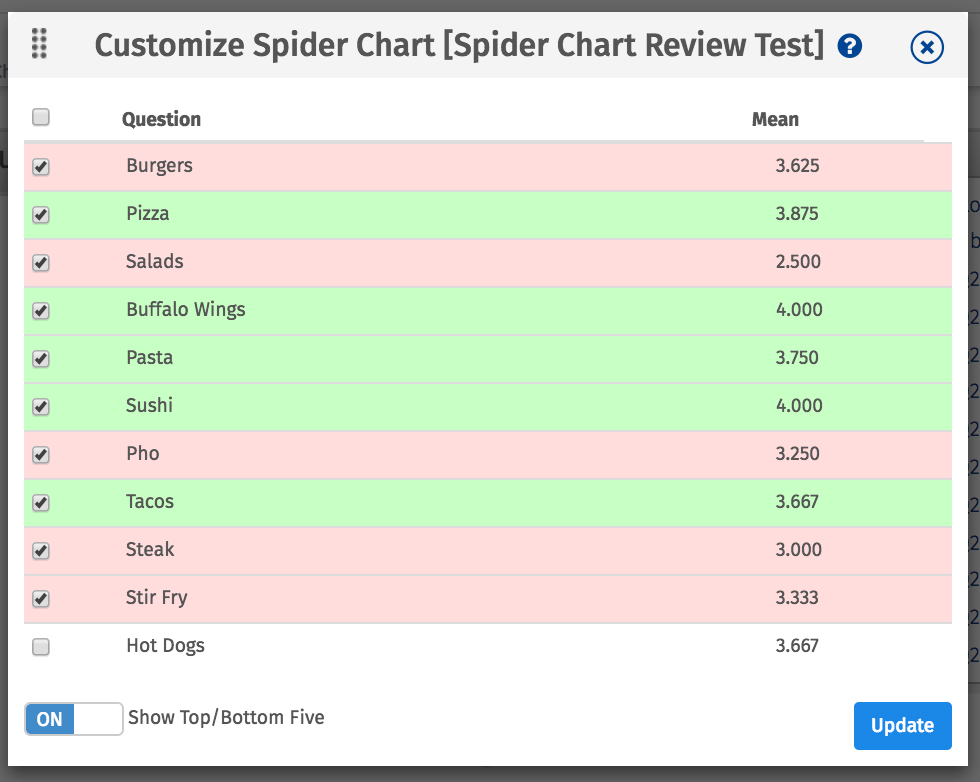
You have the option here to select or deselect the variables you may want to analyze apart from the chosen default variables.

Options can reset to the default of top 5 and bottom 5 by selecting show top/bottom five at any time. Select the ‘Update’ button to save the information selected.

Analyzing Spider Chart Results

Spider charts are a great way to compare multiple quantitative variables from matrix questions. It will allow you to note similarities, differences, and outliers amongst each variable of the matrix.

Starting from the middle, the spider chart consists of a sequence of equi-angular spokes, called radii, and each spoke represents one of the variables. Grid lines that connect from axis-to-axis are often used as a guide that marks where each variable falls within the range.  

Row names from the matrix table mark each end of the spoke.

Column names from the matrix table are the radii, or spokes representing the rating scale or variables selected.

Each variable value is plotted along its single axis and all the variables in a dataset and connected to form a polygon-type shape.

Spider Chart Analysis

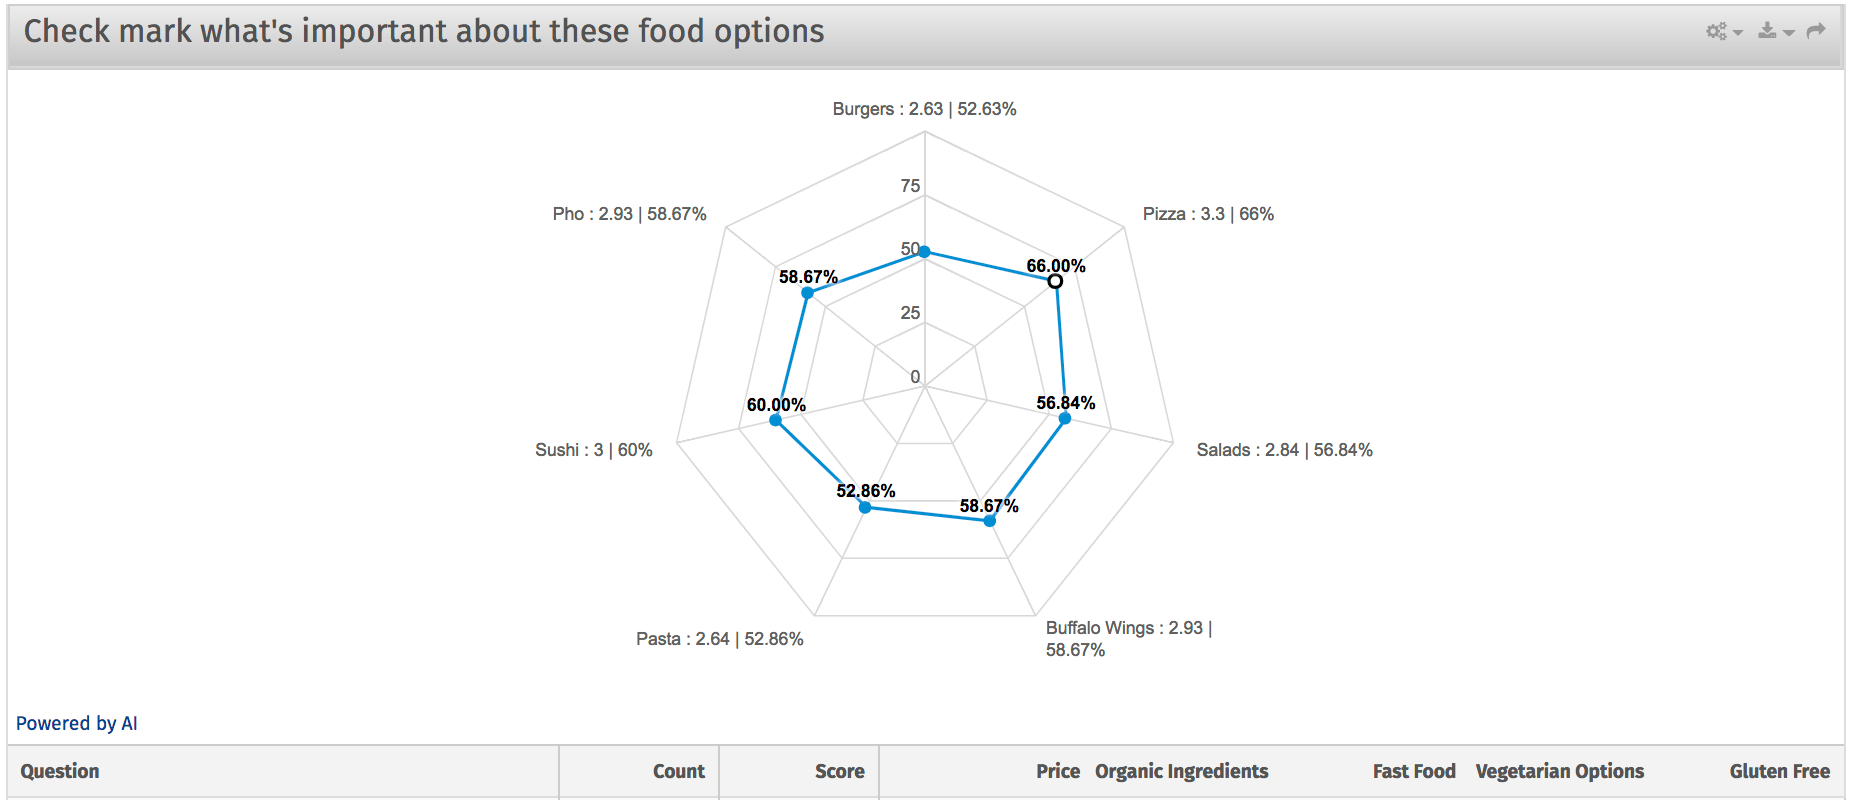
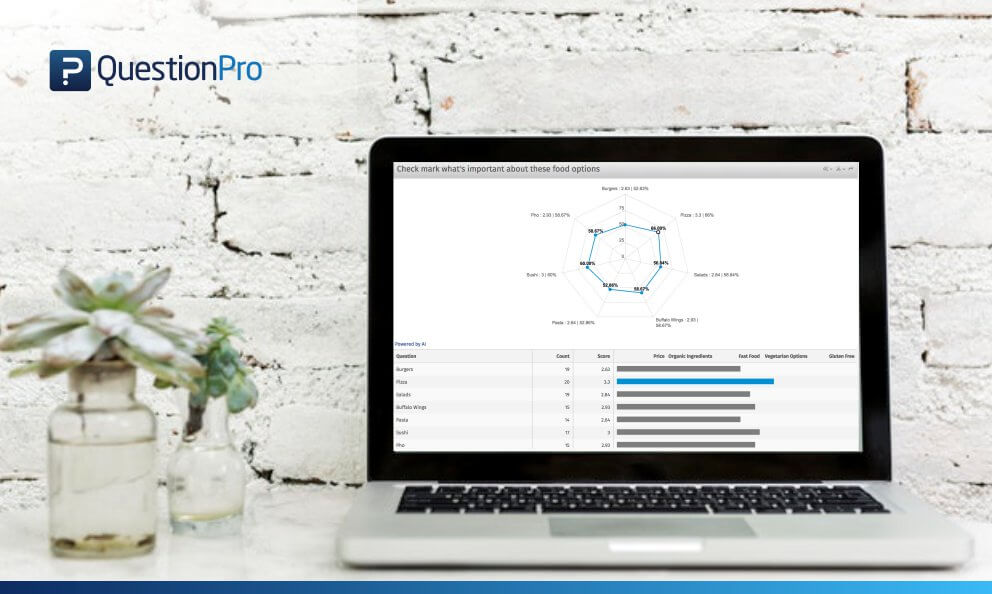
Using a multi-select matrix for a spider chart, you can see how respondents view the importance of the following variables for different food offerings in the area. Variables of price, organic ingredients, fast food, vegetarian, and gluten-free options were the most important for pizza, followed by sushi, with a tie between buffalo wings and pho. The overall differences between variables are relatively small, but can visually note subtle changes among them.

Get started with spider charts today.

Create a free account!

SHARE THIS ARTICLE:

About the author
Esther LaVielle

View all posts by Esther LaVielle

Primary Sidebar

Gain insights with 80+ features for free

Create, Send and Analyze Your Online Survey in under 5 mins!

Create a Free Account

RELATED ARTICLES

HubSpot - QuestionPro Integration

What is Diagnostic Analytics, & How It Works?

Mar 19,2025

HubSpot - QuestionPro Integration

Types of Customers: Guide to Recognize and Manage Them

Jun 05,2022

HubSpot - QuestionPro Integration

MetLife Customer Experience: The Insurance Journey Map

Aug 22,2023

BROWSE BY CATEGORY

  • Academic
  • Academic Research
  • Artificial Intelligence
  • Assessments
  • Audience
  • Brand Awareness
  • Business
  • Case Studies
  • Communities
  • Consumer Insights
  • Customer effort score
  • Customer Engagement
  • Customer Experience
  • Customer Loyalty
  • Customer Research
  • Customer Satisfaction
  • CX
  • Employee Benefits
  • Employee Engagement
  • Employee Engagement
  • Employee Retention
  • Enterprise
  • Events
  • Forms
  • Friday Five
  • General Data Protection Regulation
  • Guest Post
  • Insights Hub
  • Life@QuestionPro
  • LivePolls
  • Market Research
  • Marketing
  • Mobile
  • Mobile App
  • Mobile diaries
  • Mobile Surveys
  • New Features
  • non-profit
  • NPS
  • Online Communities
  • Polls
  • Question Types
  • Questionnaire
  • QuestionPro
  • QuestionPro Products
  • Release Notes
  • Research Tools and Apps
  • Revenue at Risk
  • Startups
  • Survey Templates
  • Surveys
  • Tech News
  • Tips
  • Training
  • Training Tips
  • Trending
  • Tuesday CX Thoughts (TCXT)
  • Uncategorized
  • VOC
  • Webinar
  • Webinars
  • What’s Coming Up
  • Workforce
  • Workforce Intelligence

Footer

MORE LIKE THIS

albertsons-companies-nps-2025

Albertsons Companies NPS and Insights in 2025

May 23, 2025

data-augmentation

What is Data Augmentation? Methods & Uses in Research

May 22, 2025

livecast a new way to do research

Here’s how LiveCast can help you survive the great Stanley Cup debate of 2025

May 22, 2025

Credit-Unions-NPS-2025

Credit Unions NPS Leading in Loyalty in 2025

May 21, 2025

Other categories

  • Academic
  • Academic Research
  • Artificial Intelligence
  • Assessments
  • Audience
  • Brand Awareness
  • Business
  • Case Studies
  • Communities
  • Consumer Insights
  • Customer effort score
  • Customer Engagement
  • Customer Experience
  • Customer Loyalty
  • Customer Research
  • Customer Satisfaction
  • CX
  • Employee Benefits
  • Employee Engagement
  • Employee Engagement
  • Employee Retention
  • Enterprise
  • Events
  • Forms
  • Friday Five
  • General Data Protection Regulation
  • Guest Post
  • Insights Hub
  • Life@QuestionPro
  • LivePolls
  • Market Research
  • Marketing
  • Mobile
  • Mobile App
  • Mobile diaries
  • Mobile Surveys
  • New Features
  • non-profit
  • NPS
  • Online Communities
  • Polls
  • Question Types
  • Questionnaire
  • QuestionPro
  • QuestionPro Products
  • Release Notes
  • Research Tools and Apps
  • Revenue at Risk
  • Startups
  • Survey Templates
  • Surveys
  • Tech News
  • Tips
  • Training
  • Training Tips
  • Trending
  • Tuesday CX Thoughts (TCXT)
  • Uncategorized
  • VOC
  • Webinar
  • Webinars
  • What’s Coming Up
  • Workforce
  • Workforce Intelligence

questionpro-logo-nw
Help center Live Chat SIGN UP FREE
  • Sample questions
  • Sample reports
  • Survey logic
  • Branding
  • Integrations
  • Professional services
  • Security
  • Survey Software
  • Customer Experience
  • Workforce
  • Communities
  • Audience
  • Polls Explore the QuestionPro Poll Software - The World's leading Online Poll Maker & Creator. Create online polls, distribute them using email and multiple other options and start analyzing poll results.
  • Research Edition
  • LivePolls
  • InsightsHub
  • Blog
  • Articles
  • eBooks
  • Survey Templates
  • Case Studies
  • Training
  • Webinars
  • All Plans
  • Nonprofit
  • Academic
  • Qualtrics Alternative Explore the list of features that QuestionPro has compared to Qualtrics and learn how you can get more, for less.
  • SurveyMonkey Alternative
  • VisionCritical Alternative
  • Medallia Alternative
  • Likert Scale Complete Likert Scale Questions, Examples and Surveys for 5, 7 and 9 point scales. Learn everything about Likert Scale with corresponding example for each question and survey demonstrations.
  • Conjoint Analysis
  • Net Promoter Score (NPS) Learn everything about Net Promoter Score (NPS) and the Net Promoter Question. Get a clear view on the universal Net Promoter Score Formula, how to undertake Net Promoter Score Calculation followed by a simple Net Promoter Score Example.
  • Offline Surveys
  • Customer Satisfaction Surveys
  • Employee Survey Software Employee survey software & tool to create, send and analyze employee surveys. Get real-time analysis for employee satisfaction, engagement, work culture and map your employee experience from onboarding to exit!
  • Market Research Survey Software Real-time, automated and advanced market research survey software & tool to create surveys, collect data and analyze results for actionable market insights.
  • GDPR & EU Compliance
  • Employee Experience
  • Customer Journey
  • Synthetic Data
  • About us
  • Executive Team
  • In the news
  • Testimonials
  • Advisory Board
  • Careers
  • Brand
  • Media Kit
  • Contact Us

QuestionPro in your language

  • English
  • Español (Spanish)
  • Português (Portuguese (Brazil))
  • Nederlands (Dutch)
  • العربية (Arabic)
  • Français (French)
  • Italiano (Italian)
  • 日本語 (Japanese)
  • Türkçe (Turkish)
  • Svenska (Swedish)
  • Hebrew IL (Hebrew)
  • ไทย (Thai)
  • Deutsch (German)
  • Portuguese de Portugal (Portuguese (Portugal))

Awards & certificates

  • survey-leader-asia-leader-2023
  • survey-leader-asiapacific-leader-2023
  • survey-leader-enterprise-leader-2023
  • survey-leader-europe-leader-2023
  • survey-leader-latinamerica-leader-2023
  • survey-leader-leader-2023
  • survey-leader-middleeast-leader-2023
  • survey-leader-mid-market-leader-2023
  • survey-leader-small-business-leader-2023
  • survey-leader-unitedkingdom-leader-2023
  • survey-momentumleader-leader-2023
  • bbb-acredited
The Experience Journal

Find innovative ideas about Experience Management from the experts

  • © 2022 QuestionPro Survey Software | +1 (800) 531 0228
  • Sitemap
  • Privacy Statement
  • Terms of Use