
Your NPS score tells you one thing with unusual clarity: whether customers would stake their own reputation to recommend you. That makes it one of the most watched numbers in customer experience, and one of the most misread.
In this blog, we’ll explore what a net promoter score measures and walk through the NPS calculation with a worked example. We also cover good-score benchmarks and the limitations to know before tying bonuses to it.
What is an NPS score?
An NPS score is a customer loyalty metric that ranges from -100 to +100. You calculate it by subtracting the percentage of detractors from the percentage of promoters. The score comes from one question: “How likely are you to recommend us to a friend or colleague?”
The essentials at a glance:
- Respondents answer on a standard 0-10 scale.
- Scores of 9-10 are promoters, 7-8 are passives, and 0-6 are detractors.
- Fred Reichheld introduced the metric in a 2003 Harvard Business Review article, developed with Bain & Company.
The net promoter score works because recommending a brand carries personal risk. A customer who tells a friend to buy from you is staking their own credibility on your product. That makes stated willingness to recommend a stronger loyalty signal than satisfaction alone. It is also why the standard Net Promoter Score survey question appears across nearly every industry.
How do you calculate an NPS score?
NPS equals the percentage of promoters minus the percentage of detractors. The result is always reported as a whole number, never as a percentage.
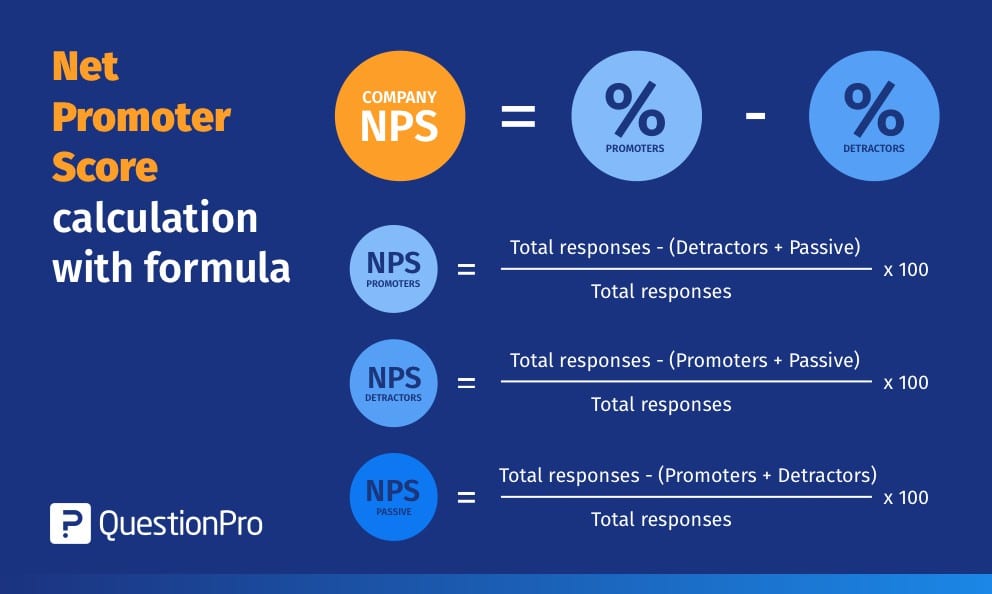
Follow these steps.
- Ask the standard 0-10 recommendation question.
- Group responses: 9-10 are promoters, 7-8 are passives, 0-6 are detractors.
- Divide the promoter count by total responses, then multiply by 100 to get the promoter percentage.
- Do the same for detractors.
- Subtract the detractor percentage from the promoter percentage.
Passives sit in the denominator but drop out of the subtraction, so they still dilute your score. A free NPS calculator handles the math instantly if you prefer not to build a spreadsheet.
NPS calculation example
Imagine a US coffee chain surveys 1,000 customers. It receives 700 promoter ratings, 100 passive ratings, and 200 detractor ratings. Promoters make up 70% of responses and detractors make up 20%. The NPS score is 70 minus 20, which equals 50.
Now suppose those 100 passives had scored 9 instead of 7. The same customer base would produce a score of 60. That gap shows why converting passives matters as much as recovering detractors.
The same math scales down to segments. Suppose the chain calculates a separate score for each store. One location posts a 25 while the rest sit near 60, so the chain knows exactly where to focus. Segment-level NPS calculation turns one company-wide number into a prioritized to-do list.
Promoters, passives, and detractors explained
Each response bucket predicts a different customer behavior, and each one calls for a different follow-up play. Understanding the three groups matters more than memorizing the formula.
| Score | Group | What it signals | Best next action |
|---|---|---|---|
| 9-10 | Promoters | Loyal enthusiasts likely to repurchase and refer others | Invite referrals, reviews, and case studies |
| 7-8 | Passives | Satisfied but unenthusiastic, open to competitor offers | Ask what would make the experience a 9 or 10 |
| 0-6 | Detractors | Unhappy customers at risk of churning and warning others | Reach out fast, resolve the issue, close the loop |
One nuance the buckets hide: a 0 and a 6 count identically as detractors. Yet those two ratings describe very different levels of frustration. Reading the open-ended comments behind the numbers protects you from that blind spot.
What is a good NPS score?
Any NPS score above 0 means you have more promoters than detractors. In most US industries, above 30 is good, above 50 is excellent, and above 70 is world class. Industry context changes everything, though.
Retently’s 2026 benchmark study found industry averages ranging from 26 to 68 (Retently, 2026). Financial services and consulting lead the ranking at 68. Meanwhile, major US cable and internet providers routinely post negative scores. A telecom company at +15 may outperform its market while a consulting firm at +40 lags its peers. Customers in monopolistic markets also stay despite low scores. A “bad” number predicts churn differently depending on how easily buyers can switch.
Three rules keep benchmarking honest:
- Compare against your own industry, not a universal target. Check current NPS benchmarks by industry before setting goals.
- Compare like with like, since transactional surveys typically score higher than relational ones.
- Treat your own trend over time as the benchmark that matters most.
For a deeper breakdown of thresholds, see what is considered a good Net Promoter Score.
NPS vs. CSAT vs. CES: What’s the difference?
These three customer satisfaction metrics get confused constantly because all three use short rating questions. They measure different things over different time horizons. Mature customer experience programs run all three rather than picking a favorite.
| Metric | Question it answers | Scale | Best used for |
|---|---|---|---|
| NPS | Would you recommend us overall? | 0-10 | Long-term loyalty and relationship health |
| CSAT (customer satisfaction score) | Were you satisfied with this interaction? | Usually 1-5 | Grading a specific purchase, ticket, or feature |
| CES (customer effort score) | How easy was it to get this done? | Usually 1-7 | Finding friction in support and self-service |
A customer can rate a support call 5/5 on CSAT and still give you a 4 on NPS. Pricing might frustrate them even when support delights. Reviewing these customer satisfaction metrics side by side reveals gaps that a single score hides.
Relational vs. Transactional NPS: Which should you use?
Use relational NPS to track overall brand health on a fixed schedule. Use transactional NPS to grade specific touchpoints right after they happen. Most programs need both, on different clocks:
- Pick relational when leadership needs one trended loyalty number for the whole customer base.
- Pick transactional when you need to know which touchpoint caused a score to rise or fall.
Relational NPS
Relational NPS measures how customers feel about your brand as a whole, independent of any single interaction. Companies typically run it quarterly or twice a year across the full customer base. Because it captures the entire relationship, it is the number executives track. It is also the version used for industry benchmarking. If you can only run one type, start relational, since it creates the baseline every transactional score gets compared against.
Transactional NPS
Transactional NPS fires automatically after a defined event, so it pinpoints exactly which touchpoint helped or hurt. Common triggers include the following.
- Closing a support ticket
- Completing onboarding or a first purchase
- A renewal, delivery, or installation
Expect transactional scores to run higher than relational ones, since they capture sentiment at a moment of engagement. Never mix the two in one trend line.
For a deeper understanding, see the difference between transactional and relational NPS and learn how to choose between them.
What is employee NPS (eNPS)?
Employee net promoter score (eNPS) applies the same methodology internally. It asks employees how likely they are to recommend your company as a place to work. The calculation is identical: percentage of employee promoters minus percentage of employee detractors. This eNPS calculator can quickly and freely help you calculate your Employee Net Promoter Score.
Benchmarks sit lower than customer NPS because employees judge their workplace more critically than customers judge a brand. An eNPS between 10 and 30 is generally considered good, while anything above 50 is excellent (AIHR, 2026).
Staff who feel valued tend to deliver better service. That connection makes eNPS an early warning system for future customer experience problems. Keep responses anonymous, or scores will inflate and the signal disappears. Most companies run eNPS quarterly and pair it with a fuller engagement survey once a year.
How do you run an NPS survey?
A well-run NPS survey pairs the 0-10 question with one open-ended follow-up asking why, and nothing more. Short surveys protect response rates, and the “why” comment is where the actionable insight lives. Resist bolting on demographic questions unless you will genuinely segment results by them.
Practical guidelines separate reliable programs from noisy ones.
- Channel: Email with the question embedded in the message body drives the highest completion. In-app prompts, SMS, and kiosk tablets work well for in-the-moment feedback. These NPS email practices cover subject lines and timing.
- Timing: Send transactional surveys within 24 hours of the interaction, while the experience is still fresh enough to rate accurately.
- Scale: Keep the standard 0-10 scale. Changing it breaks every benchmark comparison you might want later.
- Sample size: Aim for at least 100 responses per segment you plan to compare, since small samples swing wildly.
- Cadence: Quarterly or twice yearly for relational surveys, automatic event triggers for transactional ones.
- Starting point: A prebuilt NPS survey template gets a compliant survey live in minutes.
How can you improve your NPS score?
The fastest way to improve an NPS score is to close the loop with detractors within 24 to 48 hours. Closing the loop simply means following up personally and resolving the issue behind the low score. Rescued detractors move the formula from both directions at once. Beyond speed, four practices consistently lift scores:
- Act on the why, not the number.
Tag open-ended comments by theme, such as pricing, support wait times, or product bugs. Fix the highest-volume theme first.
- Build a closed-loop workflow.
Route every detractor response to a named owner with a service ticket and a deadline, so no negative score dies in a dashboard.
- Convert passives deliberately.
Passives are your cheapest wins, since they already like you. A single targeted improvement often nudges a 7 or 8 up to a 9.
- Mobilize promoters.
Ask for reviews, referrals, and testimonials while enthusiasm is fresh, which compounds the growth your score predicts.
Then re-survey on schedule and confirm the changes actually moved the trend. Improvement compounds slowly. A steady five-point annual gain beats a one-time spike that fades by the next wave. Set targets in points gained per year, not an absolute number copied from another industry.
For a deeper playbook on each of these tactics, including follow-up scripts for detractors and how to make promoter advocacy easy, see strategies to improve your Net Promoter Score.
Advantages of NPS
NPS earned its place in nearly every boardroom dashboard because it solves a real problem: most customer feedback tools are too complicated to act on quickly. These are the advantages that keep it there.
- Simplicity: One question, one number. Customers answer in seconds, and any stakeholder, from a support rep to a CFO, can understand what it means without a training session.
- Standardization: Because nearly every company running NPS asks a version of the same question, you can benchmark yourself against competitors and industry peers using a shared scale.
- Predictive power: Bain & Company’s research found that the Net Promoter leader in a market grows, on average, more than twice as fast as its competitors. That correlation is why finance and product teams take the score seriously, not just CX.
- Speed: Short surveys mean faster response cycles. Issues surface while they’re still fixable instead of after a customer has already churned.
- Cross-team clarity: A single number is easy to track on a shared dashboard, which makes NPS one of the few metrics support, product, and marketing all rally around at once.
What are the limitations of NPS?
NPS is a useful signal, not a complete measurement system. Knowing its weaknesses makes the metric more valuable, not less. The most common failure patterns include the following.
- Wide detractor band: Scores of 0 and 6 count the same, so real shifts in sentiment can hide inside one bucket.
- Cultural rating differences: Respondents in some countries rarely give 9s or 10s, which skews international comparisons (Nielsen Norman Group).
- Gaming risk: When bonuses depend on the score, staff learn to beg for 10s, and the data stops reflecting reality.
- Stated intent vs. behavior: People who say they would recommend you do not always do it, so validate NPS against retention and referral data.
- Small-sample noise: A handful of responses can swing a segment score by double digits, which is why the 100-response floor matters.
Treat any of these patterns as a prompt to fix your measurement design rather than a reason to abandon the metric. When a score suddenly moves, check response volume and channel mix first. Measurement changes often masquerade as sentiment changes.
How QuestionPro handles NPS measurement
QuestionPro Customer Experience pairs the standard NPS question with AskWhy. This question type captures three things in one step.
- The 0-10 score itself
- A root-cause category the respondent selects
- An open comment explaining the rating
That structure solves the most common gap in NPS programs, which is collecting a number without the reason behind it. Detractor responses can also trigger automated follow-up tickets. The closed-loop workflow described above then runs without manual triage.
The real value of tracking your NPS score
An NPS score will never explain your business by itself, and it was never meant to. Its value is discipline. One comparable number, tracked the same way every quarter, keeps a team honest. It forces you to hear from promoters and detractors before their sentiment shows up in revenue.
Companies that get results from net promoter score share a habit. They spend less time admiring the number and more time answering the comments underneath it. Measure consistently, close the loop quickly, and let the trend line tell you whether the customer experience is genuinely improving. No single score ever will.
Frequently Asked Questions (FAQs)
Yes. The scale runs from -100 to +100, and a negative score means detractors outnumber promoters. Several major US cable and internet providers post negative scores yet remain profitable because customers lack alternatives in their region.
Aim for at least 100 responses per segment you want to analyze, and more for executive reporting. Below that threshold, a few extreme responses can swing the score by ten points or more between survey waves.
Yes, indirectly. Passives are excluded from the subtraction but included in the total response count, so they shrink both percentages. A customer base full of 7s and 8s produces a score near zero.
No. Although the calculation uses percentages, the final result is always a whole number, such as 42 rather than 42%. Reporting the score as a percentage is a common error that confuses stakeholders.
Only with caution. Rating cultures differ, and respondents in parts of Europe and Asia rarely award 9s or 10s. Compare each region against its own historical trend instead of pooling global responses into one score.