The retail industry has seen rapid changes in recent years, and NPS in Retail has become an essential way to measure how well brands are meeting customer expectations. As competition grows and customer choices expand, delivering a positive and seamless shopping experience is more important than ever.
The Net Promoter Score (NPS) is a reliable indicator of customer satisfaction and loyalty. It helps retailers understand how their customers feel about the brand and where improvements are needed.
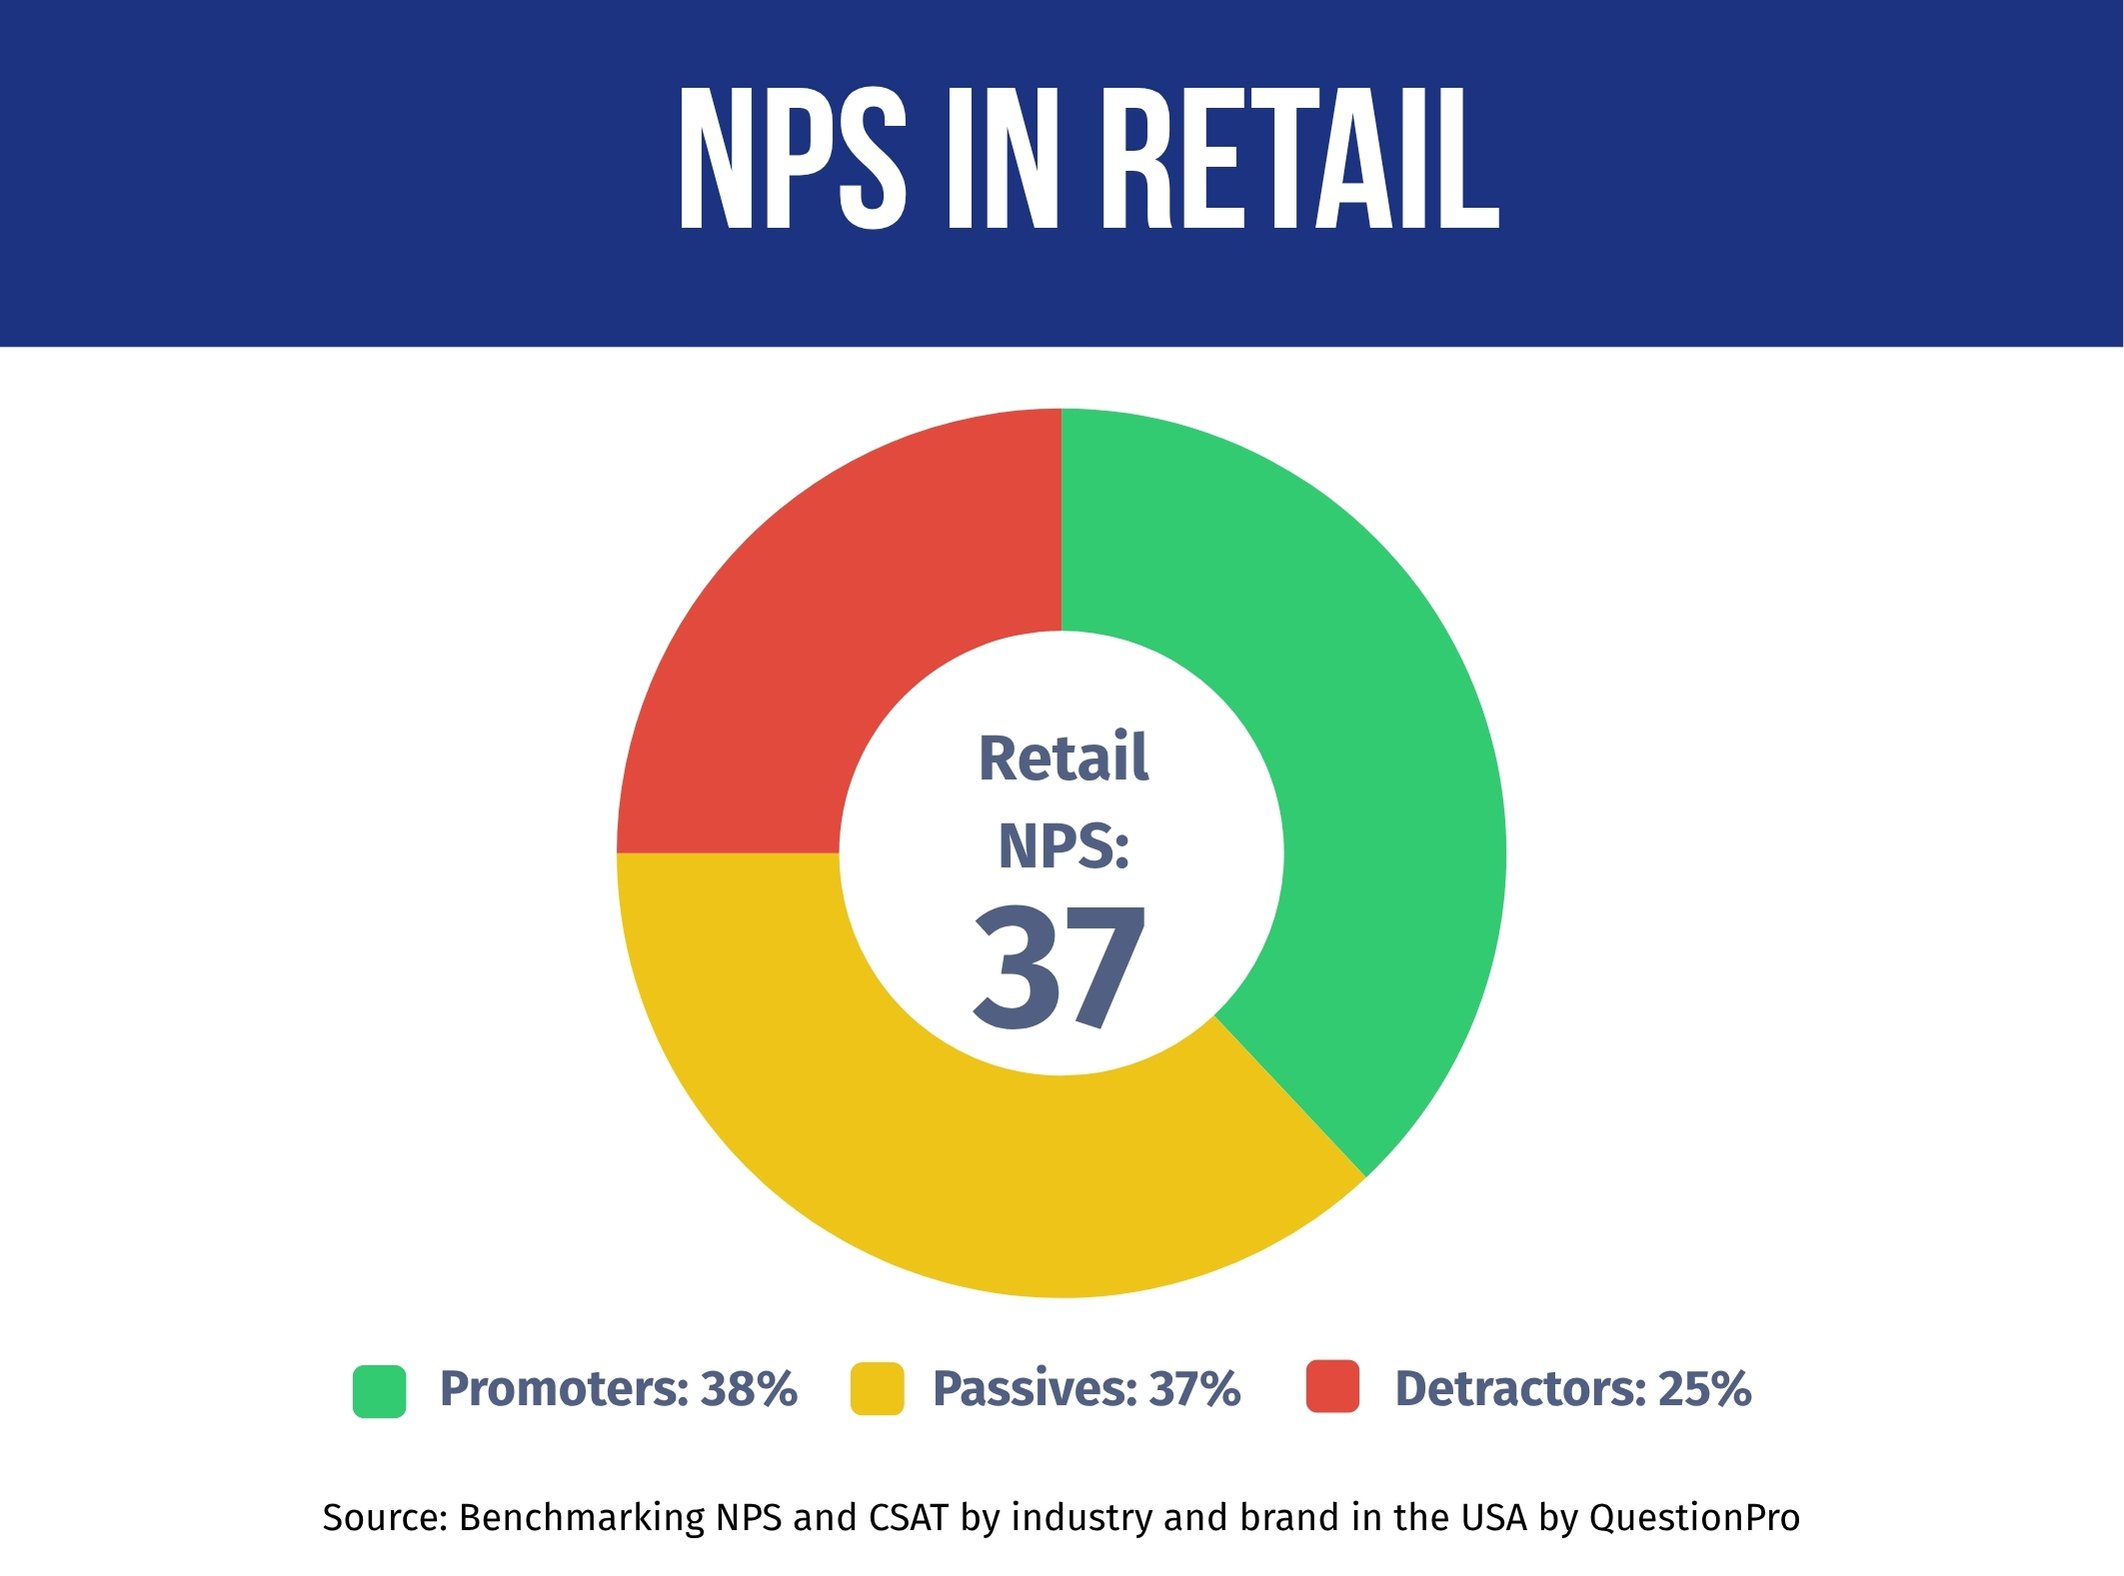
In the QuestionPro’s Q1 2025 Benchmarking NPS and CSAT Report, which surveyed 1,000 U.S. consumers involved in household purchasing decisions, the retail industry holds an average NPS of 37. While this reflects solid customer satisfaction, it also highlights opportunities for retailers to strengthen loyalty and stand out even more in a highly competitive market.
What is Net Promoter Score, and How Is It Calculated?
Net Promoter Score is a popular metric used to measure customer loyalty. It shows how likely customers are to recommend a brand, product, or service to others, making it a strong indicator of customer satisfaction and potential for future growth.
NPS is based on one simple question:
“How likely are you to recommend [Company X] to a friend or colleague?”
Respondents answer on a scale from 0 to 10, and based on their score, they’re grouped into three categories:
- Promoters (9–10): Loyal fans who love your brand and are likely to spread the word.
- Passives (7–8): Generally satisfied but not enthusiastic and may be swayed by competitors..
- Detractors (0–6): Unhappy customers who could harm your reputation through negative feedback.
To calculate your NPS:
NPS = % of Promoters – % of Detractors
Your final score can range from -100 to +100. The higher the score, the more loyal and satisfied your customers are likely to be
Track and Improve Your NPS with the QuestionPro Calculator
The QuestionPro Net Promoter Score (NPS) Calculator is a simple, effective tool that helps you quickly determine your brand’s NPS based on the number of promoters, passives, and detractors you’ve collected.
Whether you enter scores manually or use the built-in NPS goal-setting feature, this calculator gives you instant insights into customer loyalty. With QuestionPro, you can go beyond just calculating NPS — collect real-time feedback through surveys across multiple touchpoints, track trends, and act on negative feedback.
From email surveys to kiosk-based responses, QuestionPro makes it easy to gather, calculate, and improve your NPS — all in one platform.
What’s a Good NPS Score for the Retail Industry?
According to QuestionPro’s Q1 2025 Benchmarking NPS and CSAT Report, the retail industry achieved an NPS of 37, positioning it as the third-highest performing sector among the seven industries analyzed.
To understand what constitutes a good NPS score in retail, consider these industry comparisons from our study:
- Hotel & Hospitality: 44 NPS
- Banking & Credit Unions: 41 NPS
- Automotive: 41 NPS
- Big Box Retail: 37 NPS
- Grocery Retail: 37 NPS
- Airlines: 33 NPS
- Insurance: 23 NPS
The retail industry’s NPS of 37 significantly outperforms many other sectors, indicating that the retail industry is generally succeeding in building customer loyalty and advocacy, but it needs improvement.
NPS Score Interpretation for Retail
- Above 50: Excellent performance (world-class customer loyalty)
- 30–50: Good performance (strong customer advocacy)
- 0–30: Acceptable performance (room for improvement)
- Below 0: Poor performance (urgent attention needed)
With an industry average NPS of 37, most retail brands fall into the “good performance” category. This reflects a solid level of customer loyalty and advocacy, but also highlights a clear opportunity for improvement to reach the level of excellence and stand out in a competitive market.
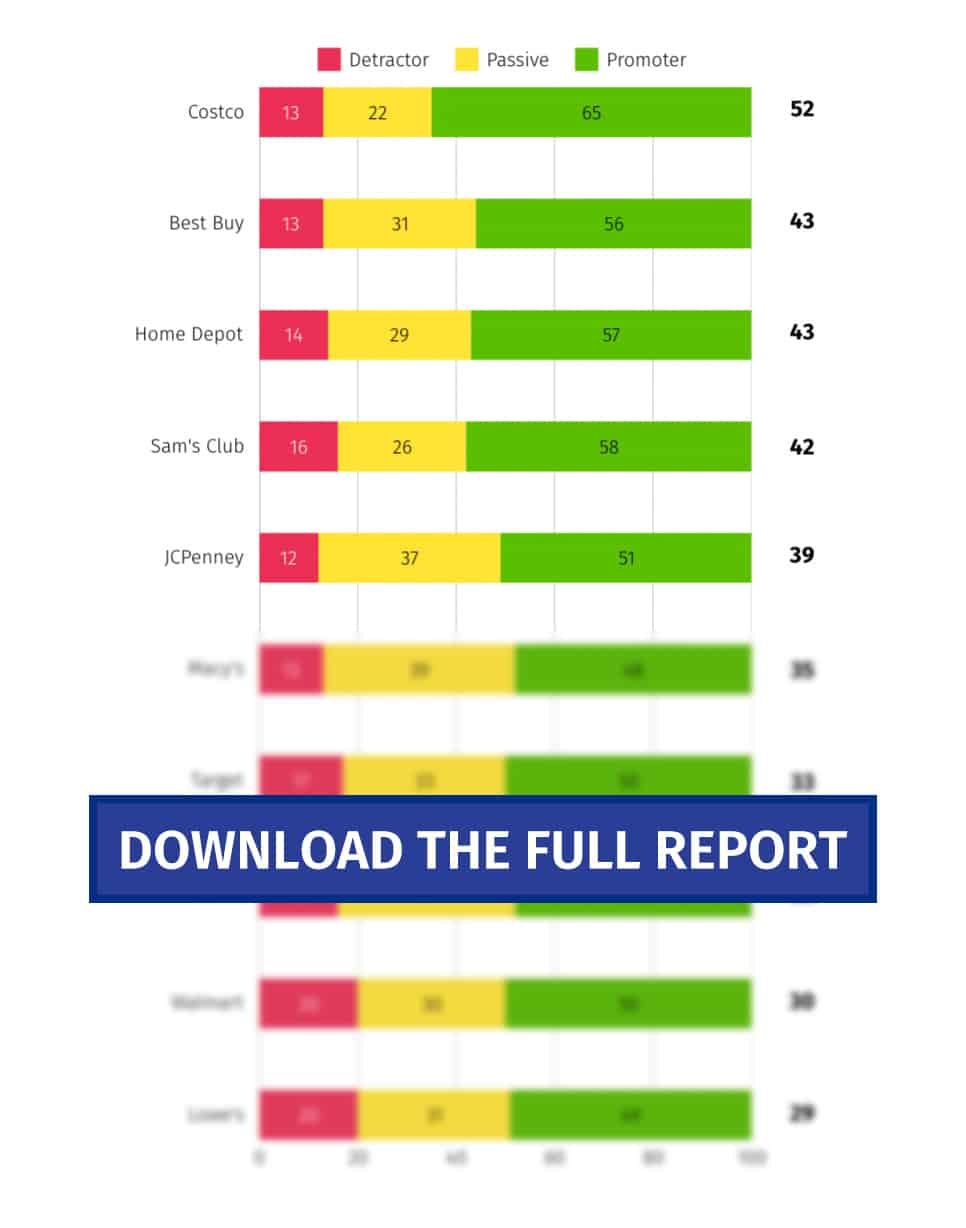
Retail Industry NPS Benchmarks: Leading Brands vs. Underperformers
Our study reveals noticeable differences in NPS performance among leading retail brands, emphasizing how effective customer experience strategies directly impact brand loyalty and consumer trust.
For this analysis, we focused on the most relevant and recognizable retailers. If you believe we missed an important brand, feel free to let us know.
These insights come from QuestionPro’s latest study, which surveyed 1,000 participants to measure NPS across leading companies and industries. The report is based on real customer feedback from Q1 2025 and is updated quarterly.
We invite you to download the full report. It’s a valuable resource for evaluating your company’s performance and determining your customers’ perceptions of you.
Discover What Major Brands are Doing to Achieve an Excellent NPS
Click here to access a detailed analysis of how the major retail industries included in our study maintain customer satisfaction and how this has impacted their Net Promoter Score.
Costco NPS
Costco leads the retail sector with an impressive NPS of 52, thanks to its exceptional value proposition, member-focused model, and consistent customer service. Its loyal customer base appreciates the combination of quality, price, and experience, which drives strong advocacy and repeat business.
Best Buy NPS
Best Buy’s NPS of 43 highlights the brand’s effective customer support and seamless omnichannel experience. Their knowledgeable staff, competitive pricing, and efficient tech support contribute to solid customer satisfaction, placing them among the higher-performing retailers in the industry.
Home Depot NPS
Home Depot matches Best Buy with an NPS of 43, reflecting its strong customer satisfaction in the home improvement category. Customers value the wide product selection, competitive prices, and reliable in-store assistance. The brand’s DIY-focused resources and service-oriented staff help maintain loyalty across a broad customer base.
Sam’s Club NPS
With an NPS of 42, Sam’s Club ranks closely behind its primary competitor, Costco. Members appreciate the bulk savings, private-label offerings, and efficient store layout. While its digital experience still has room for growth, its value-driven model continues to resonate with cost-conscious shoppers.
JCPenney NPS
JCPenney’s score of 39 shows moderate customer satisfaction. The brand is in a state of transition, aiming to rebuild trust through improved merchandise quality and in-store experience. While there’s progress, challenges around relevance and consistency remain key areas for improvement.
Macy’s NPS
Macy’s NPS of 35 places it in the mid-range. Customers enjoy the premium selection and seasonal deals, but shifting consumer habits and inconsistent service across locations limit its performance. Investments in online channels and loyalty programs may help push this score higher in the future.
Target NPS
Target’s NPS of 33 reflects a mix of strong brand affinity and operational inconsistencies. Customers like the curated product lines, in-store experience, and design aesthetic. However, issues like stock availability and delivery reliability affect overall loyalty.
Kohl’s NPS
Kohl’s sits slightly below average with an NPS of 32. Known for its frequent promotions and Kohl’s Cash rewards, it still struggles with in-store navigation and product assortment. Enhancing the customer journey—both online and offline—could improve its standing.
Walmart NPS
Walmart, despite being a retail giant, scores 30 in NPS, indicating a need to address customer experience more proactively. While it excels in pricing and accessibility, service quality, store cleanliness, and product availability remain pain points for many shoppers.
Lowe’s Home Improvement NPS
With an NPS of 29, Lowe’s trails behind Home Depot. While it offers a wide range of products and competitive pricing, customer feedback often points to inconsistent support and difficulties navigating stores. Enhancing employee training and store usability could help improve its score.
Key Performance Insights for the Retail Industry
The 23-point gap between the highest-performing retailer (Costco at 52) and the lowest (Lowe’s at 29) highlights the strong influence of customer experience strategies on brand loyalty and customer satisfaction in retail.
Customer Sentiment Distribution:
- Detractors: Range from 8% (Costco) to 26% (Lowe’s)
- Passives: Range from 20% (Costco) to 35% (Lowe’s)
- Promoters: Range from 39% (Lowe’s) to 69% (Costco)
This variation shows that retailers with better service quality, streamlined experiences, and strong value propositions tend to enjoy higher customer advocacy and loyalty.
What Retail Industry Leaders Teach Us About NPS Success and ChallengesAirline NPS Score Benchmarks
The varied Net Promoter Scores across retail brands aren’t random—they reflect key strategies and challenges unique to this sector. Here are some important factors driving success and areas to watch:
Keys to Success Among Retail NPS Leaders
- Personalized Customer Experiences
Top retailers with high NPS scores prove that customizing shopping experiences and building genuine connections with customers matter. Personalized recommendations, attentive service, and an understanding of customer preferences create loyal promoters.
- Seamless Omnichannel Integration
Retailers excelling in NPS often combine physical stores with strong online platforms. A smooth, convenient shopping journey—whether in-store, on mobile, or online—helps boost customer satisfaction and advocacy.
- Comprehensive Product and Service Offering
Brands that offer a broad range of products and services while maintaining consistent quality tend to perform better. Meeting diverse customer needs with reliable service enhances overall loyalty and strengthens brand reputation.
Challenges and Lessons for Retailers
- Balancing Scale with Personal Touch
Large retail chains often struggle to maintain personalized service across many locations. Smaller, local retailers often have an advantage here, highlighting the ongoing challenge of scaling while staying customer-focused.
- Rebuilding Trust After Setbacks
Retailers facing past controversies or service failures may find their NPS suffers as a result. Regaining customer trust requires sustained effort and transparency to rebuild loyalty.
- Effective Digital Experience Implementation
Simply adopting new technologies isn’t enough. Retailers need to ensure that digital innovations genuinely improve the customer experience, emphasizing ease of use, speed, and support to stand out.
Start Measuring and Improving Your Retail NPS
As the saying goes, “what gets measured gets improved.” To help you boost customer loyalty and satisfaction in retail, here are some practical steps to begin measuring your Net Promoter Score (NPS) and uncover opportunities for ongoing improvement.
- Set Your Baseline: Start by running regular NPS surveys to understand your current standing compared to industry benchmarks. Be consistent with your timing and survey methods to track meaningful progress over time.
- Segment Your Insights: Break down your NPS data by customer groups, product categories, and shopping touchpoints to pinpoint where you’re excelling and where improvements are needed. Different shoppers may have unique preferences and pain points.
- Track Progress Regularly: Conduct quarterly NPS tracking to spot trends and evaluate the success of your customer experience efforts. This helps you stay responsive to changing customer expectations.
While this process might sound complex, powerful tools like QuestionPro Customer Experience can make it simple and efficient. With QuestionPro, you can:
- Close the Feedback Loop: Follow up with promoters to amplify what you’re doing right and with detractors to address concerns before they escalate.
- Leverage Predictive Analytics: Use NPS data to anticipate customer behavior and identify those at risk of leaving, so you can act proactively.
- Ensure Consistency Across Channels: Maintain a seamless and positive shopping experience—whether online, in-store, or via mobile—with clear visual insights that help you optimize every step of the customer journey.
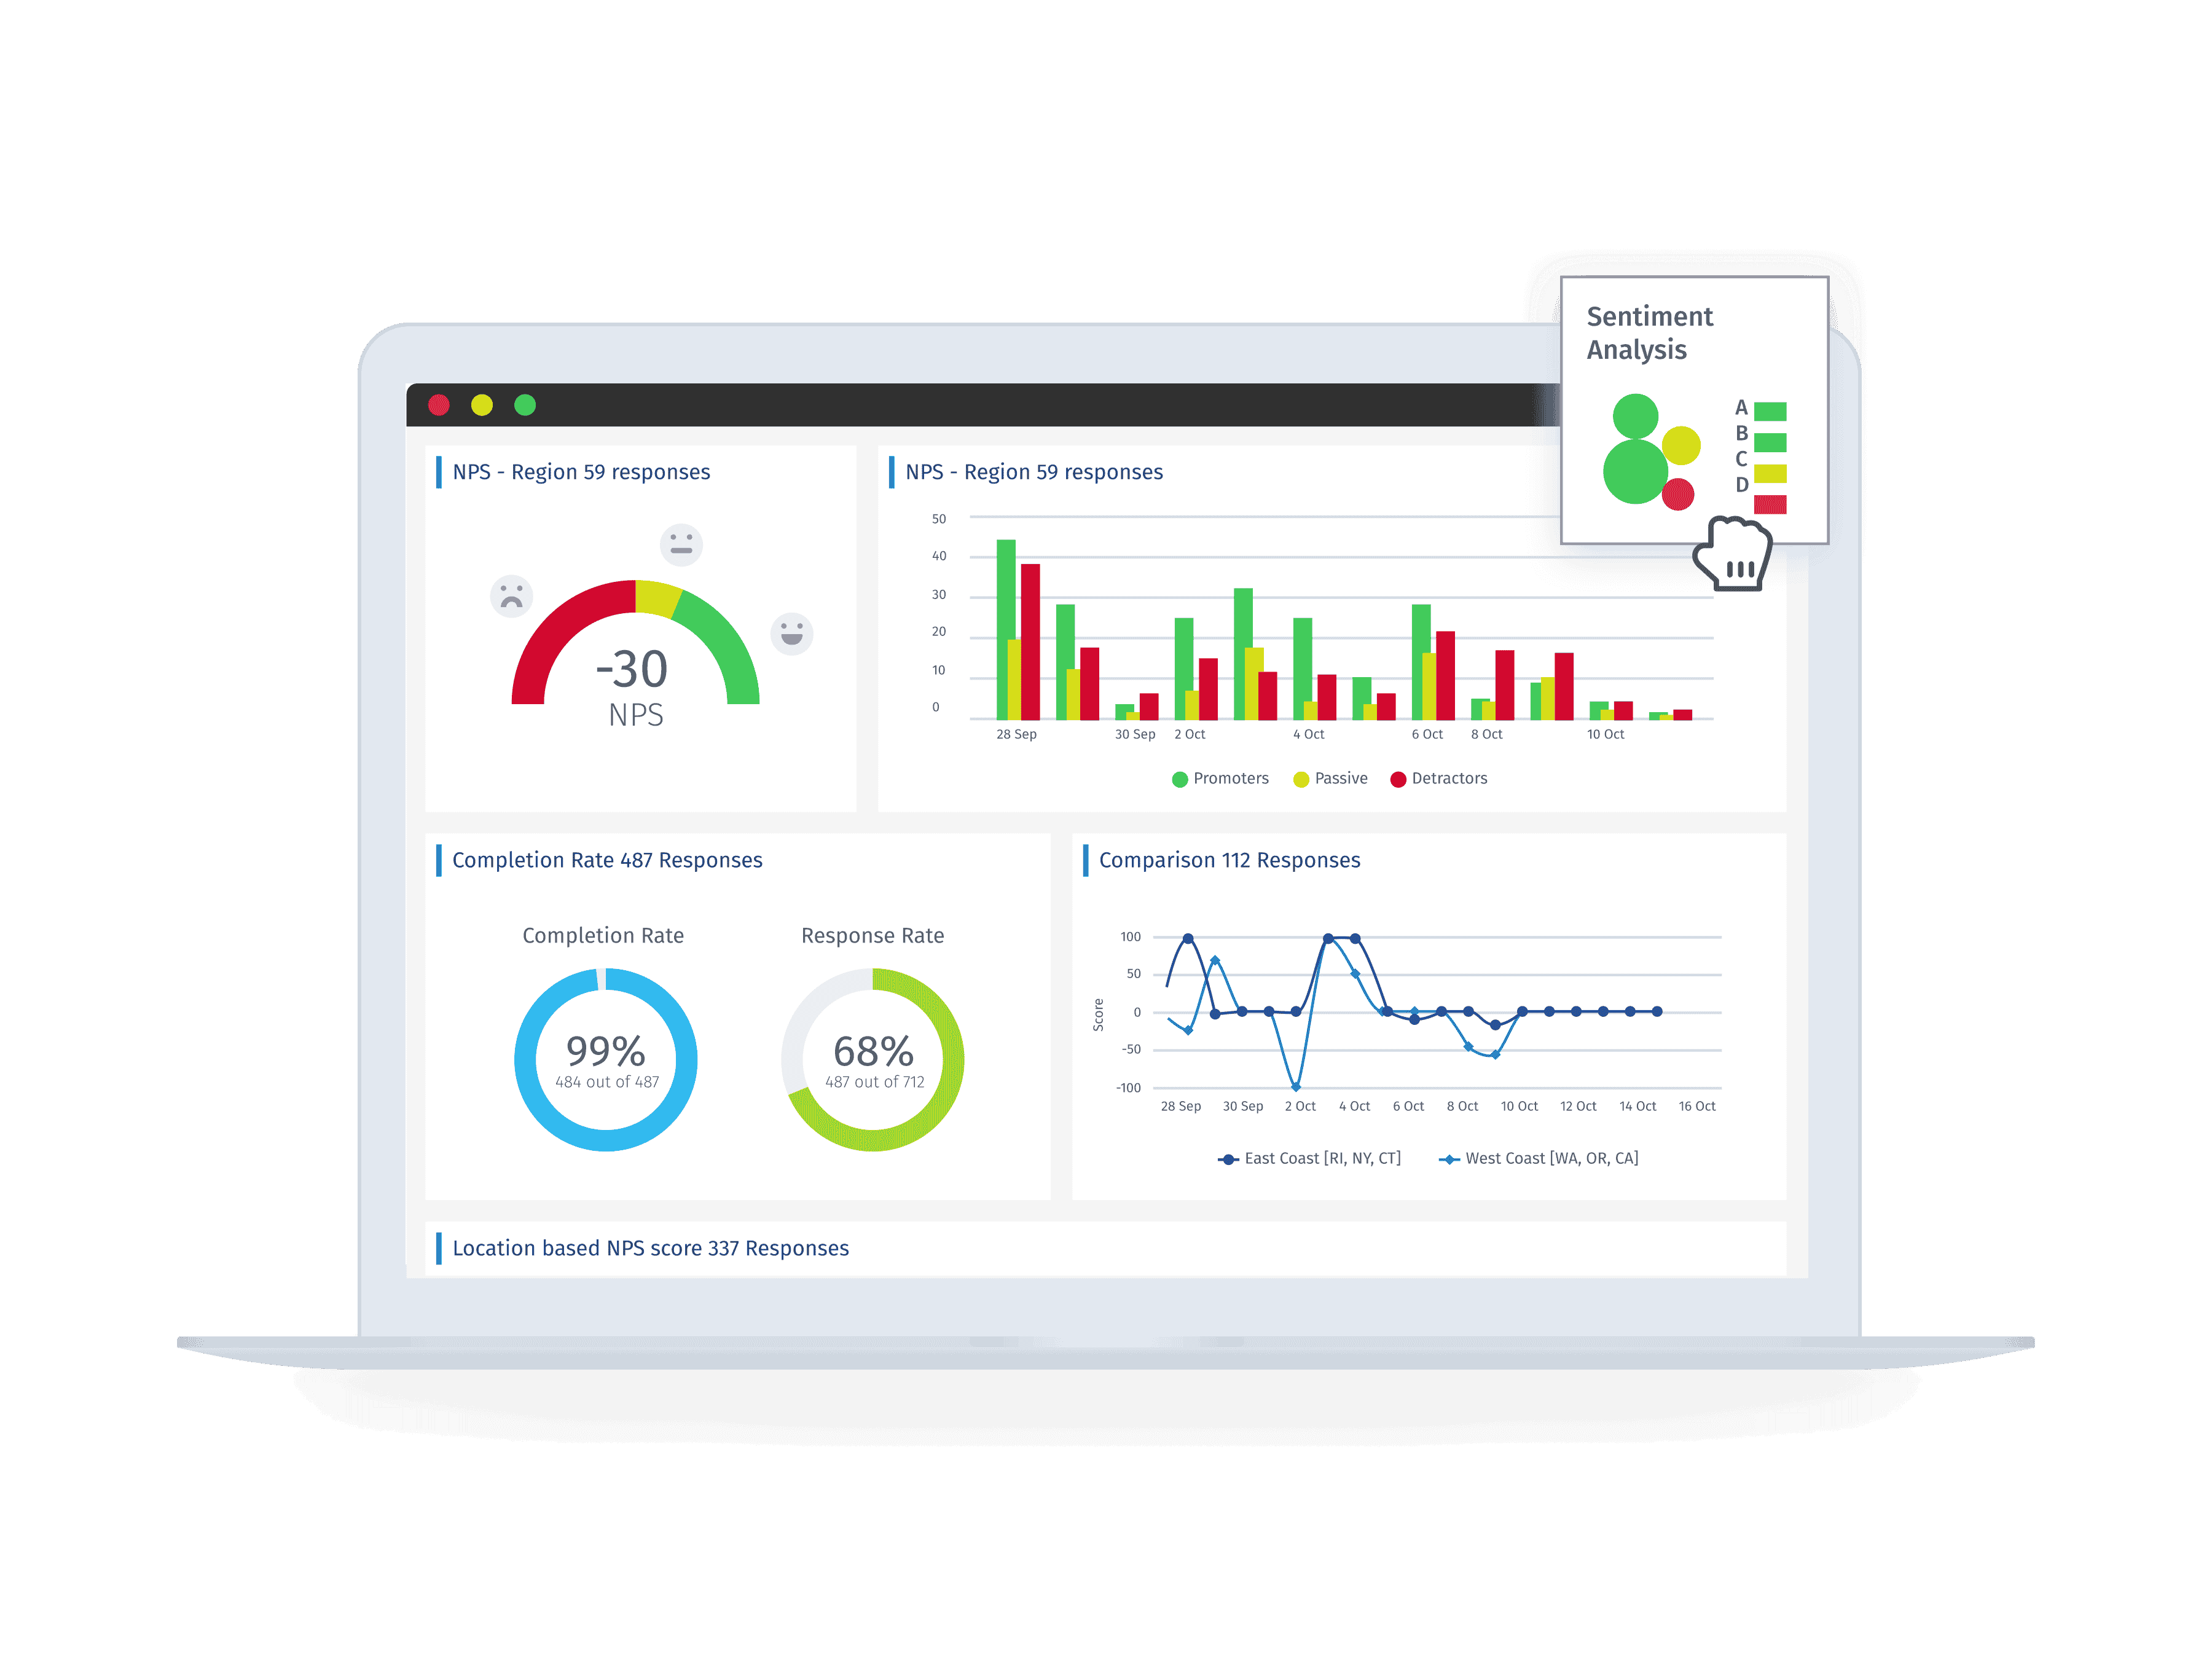
With QuestionPro Customer Experience, you can quickly measure your Net Promoter Score and set up ongoing monitoring systems to keep your customers satisfied, helping you stay competitive and aligned with top performers in the retail industry.
Conclusion
With an average NPS of 37, the retail industry shows a solid commitment to delivering better customer experiences. Still, the performance gap between leading and lagging brands reveals there’s an opportunity to grow.
Retailers that focus on personalized service, streamline their omnichannel experiences, and ensure consistent quality across every customer touchpoint will be best positioned to build stronger loyalty and stand out in an increasingly competitive landscape.