When comparing NPS vs CSAT vs CES, you are choosing between three different customer satisfaction metrics that measure loyalty, satisfaction, and effort.
In the USA, companies across SaaS, retail, healthcare, and financial services rely on these scores to guide retention strategy and service improvement. The mistake is not choosing one over the other. The mistake is using the wrong metric at the wrong moment.
In this blog, we’ll explain what each score means, how it works, and when to use it.
What is NPS?
Net Promoter Score (NPS) measures customer loyalty by asking how likely someone is to recommend your company.
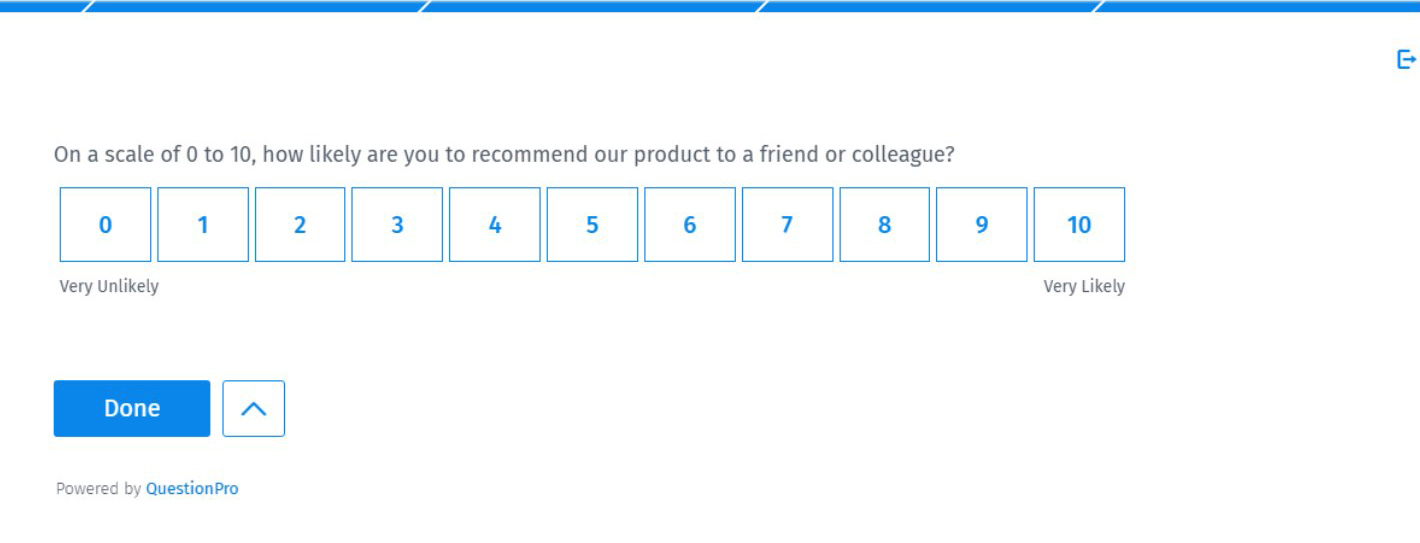
Standard question:
“On a scale from 0 to 10, how likely are you to recommend us to a friend or colleague?”
NPS is widely used in the United States because it is simple and comparable across industries. It was introduced by Fred Reichheld in Harvard Business Review as a way to link recommendation intent to growth.
How does NPS work?
Responses are grouped into three categories:
- Promoters (9 to 10)
- Passives (7 to 8)
- Detractors (0 to 6)
The formula is:
Percentage of Promoters minus Percentage of Detractors = NPS
Scores range from -100 to +100.
NPS is considered a relationship metric, meaning it measures overall brand perception rather than a single interaction.
What does CSAT mean?
Customer Satisfaction Score (CSAT) measures how satisfied a customer is with a specific experience.
Typical question:
“How satisfied were you with your experience?”

CSAT is often called a transactional metric because it focuses on a single touchpoint, such as a support call or purchase.
How is CSAT calculated?
Most US companies measure CSAT using a 1 to 5 or 1 to 7 satisfaction scale. The most common calculation method is the Top 2 Box score, which represents the percentage of respondents who selected the highest satisfaction options, such as “Satisfied” or “Extremely satisfied.”
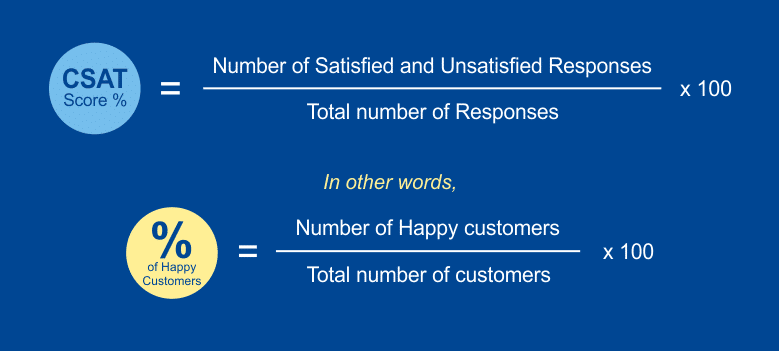
To calculate CSAT:
(Number of satisfied customers ÷ Total number of respondents) × 100 = CSAT %
For example, if you run an e-commerce store and 500 customers complete your survey after checkout, and 250 of them select “Satisfied” or “Extremely satisfied,” the calculation would be:
- 250 ÷ 500 = 0.5
- 0.5 × 100 = 50%
Your CSAT score would be 50%.
This percentage-based method keeps reporting simple and makes it easy for operational teams to track service performance tied to specific interactions.
CSAT Benchmarks for Top Industries in 2025
What does CES mean?
Customer Effort Score (CES) measures how easy it was for a customer to complete a task or resolve an issue.
Typical question:
“How easy was it to resolve your issue today?”

CES focuses on friction. Research from CEB, now part of Gartner, found that reducing effort is a strong predictor of customer retention in service environments.
How does CES work?
Customers rate effort on a scale, typically 1 to 5 or 1 to 7.
Lower effort correlates with:
- Higher repeat purchase likelihood
- Lower churn
- Fewer repeat contacts
In industries like telecom and banking in the USA, where switching costs are low, CES often highlights process problems that CSAT may miss.
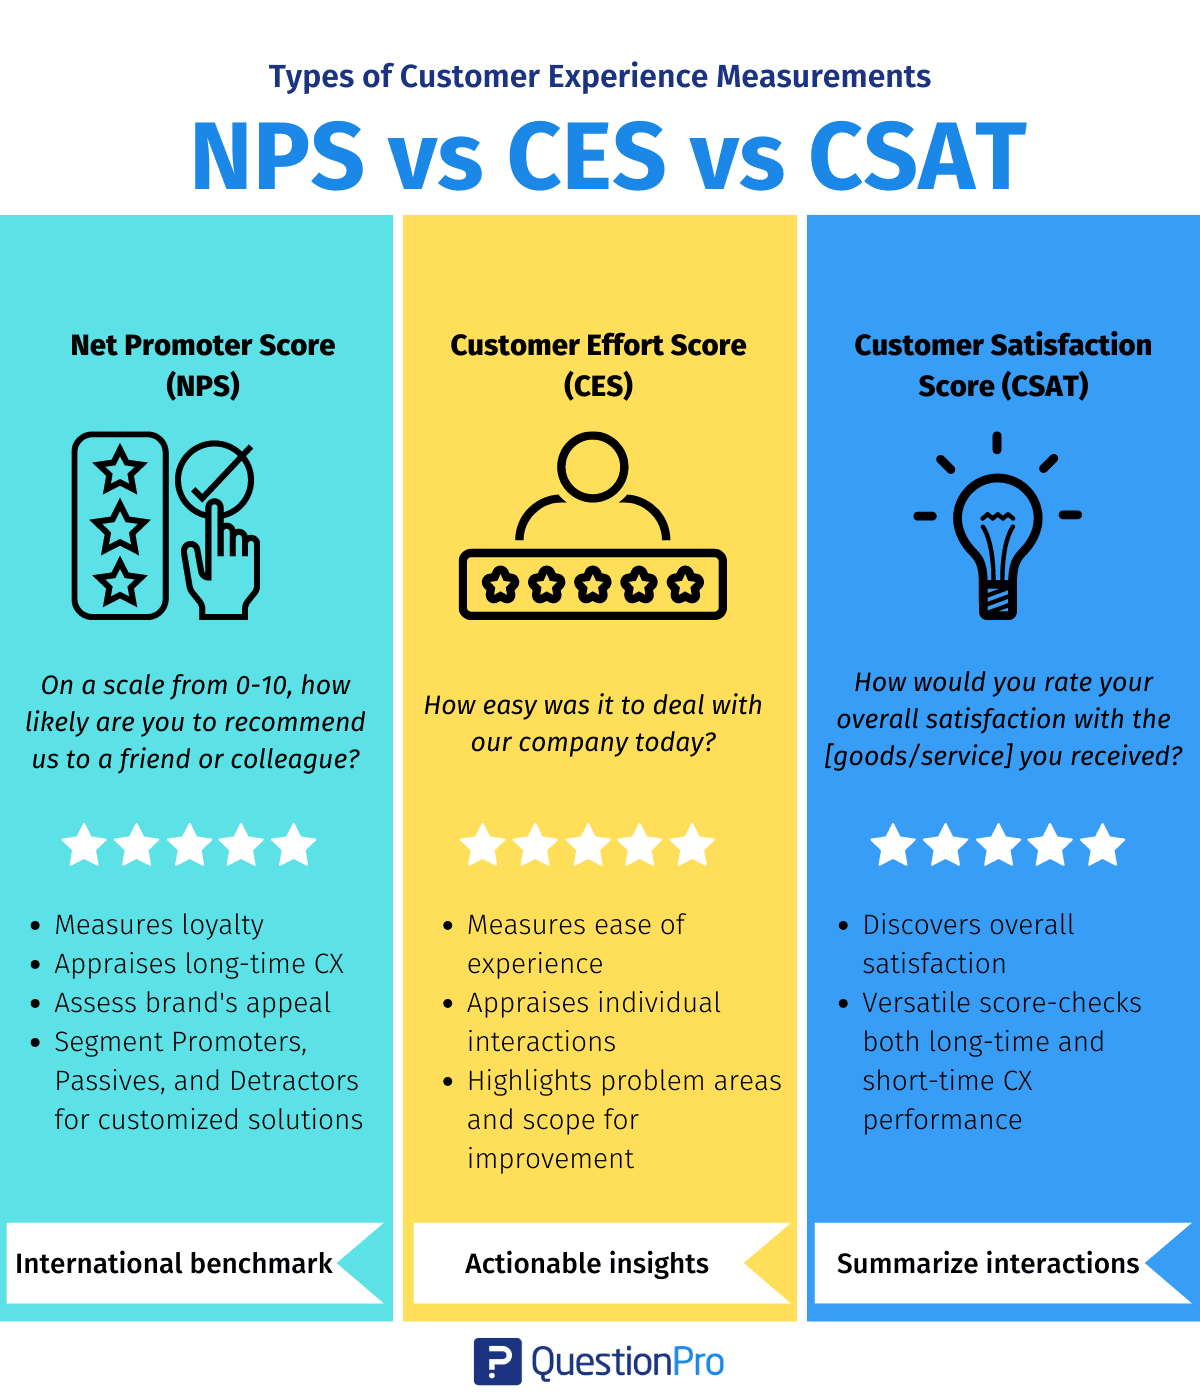
NPS vs CSAT vs CES: What is the core difference?
The core difference between NPS vs CSAT vs CES comes down to what each metric is designed to predict and influence. Although they are often grouped together as customer experience KPIs, they operate at different levels of the relationship.
| Metric | Measures | Focus | Time Horizon |
| NPS | Loyalty | Recommendation intent | Long-term |
| CSAT | Satisfaction | Specific interaction | Short-term |
| CES | Effort | Ease and friction | Operational |
- NPS predicts advocacy and growth.
- CSAT measures immediate satisfaction.
- CES identifies friction in the customer journey.
These metrics work best when treated as distinct lenses on the same customer relationship. They answer different questions, influence different teams, and drive different types of decisions.
Used together with clear intent, they provide a structured view of loyalty, performance, and friction. Used interchangeably, they blur priorities and reduce clarity.
Pros and cons of NPS, CSAT, & CES
Each of these customer experience metrics has strengths and blind spots. The key is understanding what problem you are trying to solve before selecting one.
Pros and cons of NPS
Net Promoter Score is widely used across the USA because it provides a simple, comparable loyalty indicator. It works especially well at the executive level, where teams need a high-level signal of brand health.
Pros:
- Simple benchmark across US industries
- Clear executive reporting metric
- Strong loyalty indicator linked to retention and referral behavior
Cons:
- Does not explain root causes without an open-ended follow-up
- Not tied to a specific touchpoint or transaction
- Can mask operational problems if used alone
NPS is most effective when paired with qualitative feedback and trend analysis over time.
Pros and cons of CSAT
Customer Satisfaction Score is straightforward and practical. It is commonly used in US call centers, e-commerce, and healthcare settings because it captures immediate reaction after an interaction.
Pros:
- Easy to implement across digital and offline channels
- Clear operational signal for frontline teams
- Strong for service quality tracking and performance evaluation
Cons:
- Sensitive to short-term emotions or isolated incidents
- Satisfaction does not necessarily predict loyalty
- Scores can fluctuate based on context, such as wait time or expectations
CSAT is valuable for service monitoring but should not be treated as a long-term loyalty metric.
Pros and cons of CES
Customer Effort Score focuses on how easy it was for customers to complete an action. In industries like telecom, utilities, and banking in the USA, reducing effort often has a direct impact on churn.
Pros:
- Identifies friction points in processes and systems
- Predicts churn in service-heavy sectors
- Encourages process improvement and workflow simplification
Cons:
- Limited to specific interactions rather than overall brand perception
- Does not measure emotional connection or advocacy
- Requires clear wording to avoid confusion about scale direction
CES is particularly effective when the goal is operational efficiency and reducing repeat contacts.
Together, NPS, CSAT, and CES offer three distinct lenses on the customer relationship. The value comes from aligning each metric with the business decision it is meant to inform.
Step-by-step guide to choosing the right metric
If you are deciding between customer experience metrics, use this approach to make the choice based on the decision you need to make, not on what is most popular.
Step 1: Define your objective
Start with the outcome you actually want to predict.
- If your goal is loyalty and brand health, choose NPS.
- If your goal is service quality after an interaction, choose CSAT.
- If your goal is friction reduction and process improvement, choose CES.
This step matters because each metric is designed to answer a different question. Picking the wrong one creates “good” scores that do not match what the business needs to fix.
Step 2: Identify the touchpoint
Decide whether you are measuring the overall relationship or a single moment.
- A relationship survey is an overall view of the brand or account, best fit for NPS
- Transactional survey is a specific interaction, like a support case, delivery, or onboarding, best fit for CSAT or CES
If you cannot point to the exact interaction, avoid transactional metrics and use a relationship metric.
Step 3: Decide who owns the outcome
Metrics only work when the right team can act on them quickly.
- Executive leadership: Typically owns NPS trends and long-term retention signals
- CX team: Often owns cross-touchpoint improvements and segmentation
- Support operations or service teams: Usually own CSAT and CES actions tied to specific workflows
If nobody clearly owns the outcome, the metric becomes a reporting exercise instead of a tool for change.
Step 4: Add a qualitative follow-up
Scores alone are not diagnostic. Always include an open-ended question that captures the “why.”
Examples:
- “What is the main reason for your score?”
- “What could we do to make this easier?”
- “What did we do well, and what should we improve?”
This is where the most actionable insight usually lives, especially when the score moves unexpectedly.
To connect these signals across channels and touchpoints, companies increasingly use customer journey analytics to analyze loyalty, satisfaction, and effort together instead of in isolation.
Can you use all three metrics together?
Yes, but only if each metric has a clearly defined role in your measurement strategy. Using NPS, CSAT, and CES together works when they are mapped to different stages of the customer journey and different decision owners. It fails when they are treated as interchangeable or squeezed into the same survey.
A common structure in US SaaS companies looks like this:
- Quarterly NPS survey to measure overall relationship health and loyalty trends
- Post-support CSAT survey to track service performance after tickets or chats
- CES during onboarding to identify friction in setup, activation, or implementation
Stacking all three metrics in a single survey confuses respondents and weakens the signal. A customer should not be asked about loyalty, satisfaction, and effort for the same interaction unless there is a clear analytical reason. Separating them by journey stage produces cleaner insights, clearer accountability, and more reliable trend data over time.
Also Check: The key stages of the E-commerce customer journey and techniques and insights to improve each stage.
How can QuestionPro help you measure NPS, CSAT, and CES effectively?
Measuring NPS, CSAT, and CES is straightforward. Measuring the scores is easy. Operationalizing them across teams and touchpoints is where most organizations struggle. This is where a structured survey and analytics platform becomes essential.
QuestionPro allows organizations to design relationship and transactional surveys with built-in templates for Net Promoter Score, Customer Satisfaction Score, and Customer Effort Score.
You can:
- Automate survey triggers after support tickets, purchases, or onboarding milestones
- Segment responses by customer type, region, or lifecycle stage
- Track trends over time with real-time dashboards
- Combine quantitative scores with open-ended feedback analysis
For US-based companies operating across multiple channels, centralized reporting makes it easier to align executive KPIs with frontline performance metrics.
Beyond simple score tracking, QuestionPro supports workflow alerts and case management, ensuring that detractors, dissatisfied customers, or high-effort experiences are flagged for follow-up. This closes the loop instead of leaving metrics as passive reports.
When integrated into a broader experience management strategy, the platform helps connect loyalty, satisfaction, and effort data into a single, consistent measurement framework rather than relying on isolated surveys.
Final thoughts on NPS vs CSAT vs CES
The debate around NPS vs CSAT vs CES is not about which metric is better. It is about which question you need answered right now. Loyalty, satisfaction, and effort are related, but they are not the same signal. Treating them as interchangeable creates noise instead of clarity.
- If you want to understand whether customers will stay and advocate for your brand, measure NPS.
- If you need to know whether a recent interaction met expectations, measure CSAT.
- If your priority is reducing friction and preventing repeat contacts or churn, measure CES.
In practice, most mature US organizations use all three across different stages of the journey. The discipline lies in assigning each metric a specific purpose, owner, and action plan. Scores alone do not improve customer experience. Clear intent, structured follow-up, and consistent tracking do.
Frequently Asked Questions (FAQs)
Answer: NPS measures long-term loyalty by asking about recommendation intent. CSAT measures short-term satisfaction with a specific interaction or transaction.
Answer: Not necessarily. In service-heavy industries in the USA, CES can be a stronger predictor of churn because reducing effort often has a direct impact on retention. CSAT, however, remains useful for tracking service quality.
Answer: No. NPS does not capture interaction-level performance. It reflects overall brand perception rather than the quality of a specific experience.
Answer: Benchmarks vary by industry, but generally:
1. Above 0 is acceptable
2. Above 30 is strong
3. Above 50 is excellent
Always compare your score to industry-specific benchmarks rather than using a universal standard.
Answer: Most early-stage startups begin with CSAT to monitor operational performance. As they grow and retention becomes a priority, they typically introduce NPS and, in some cases, CES for friction analysis.