



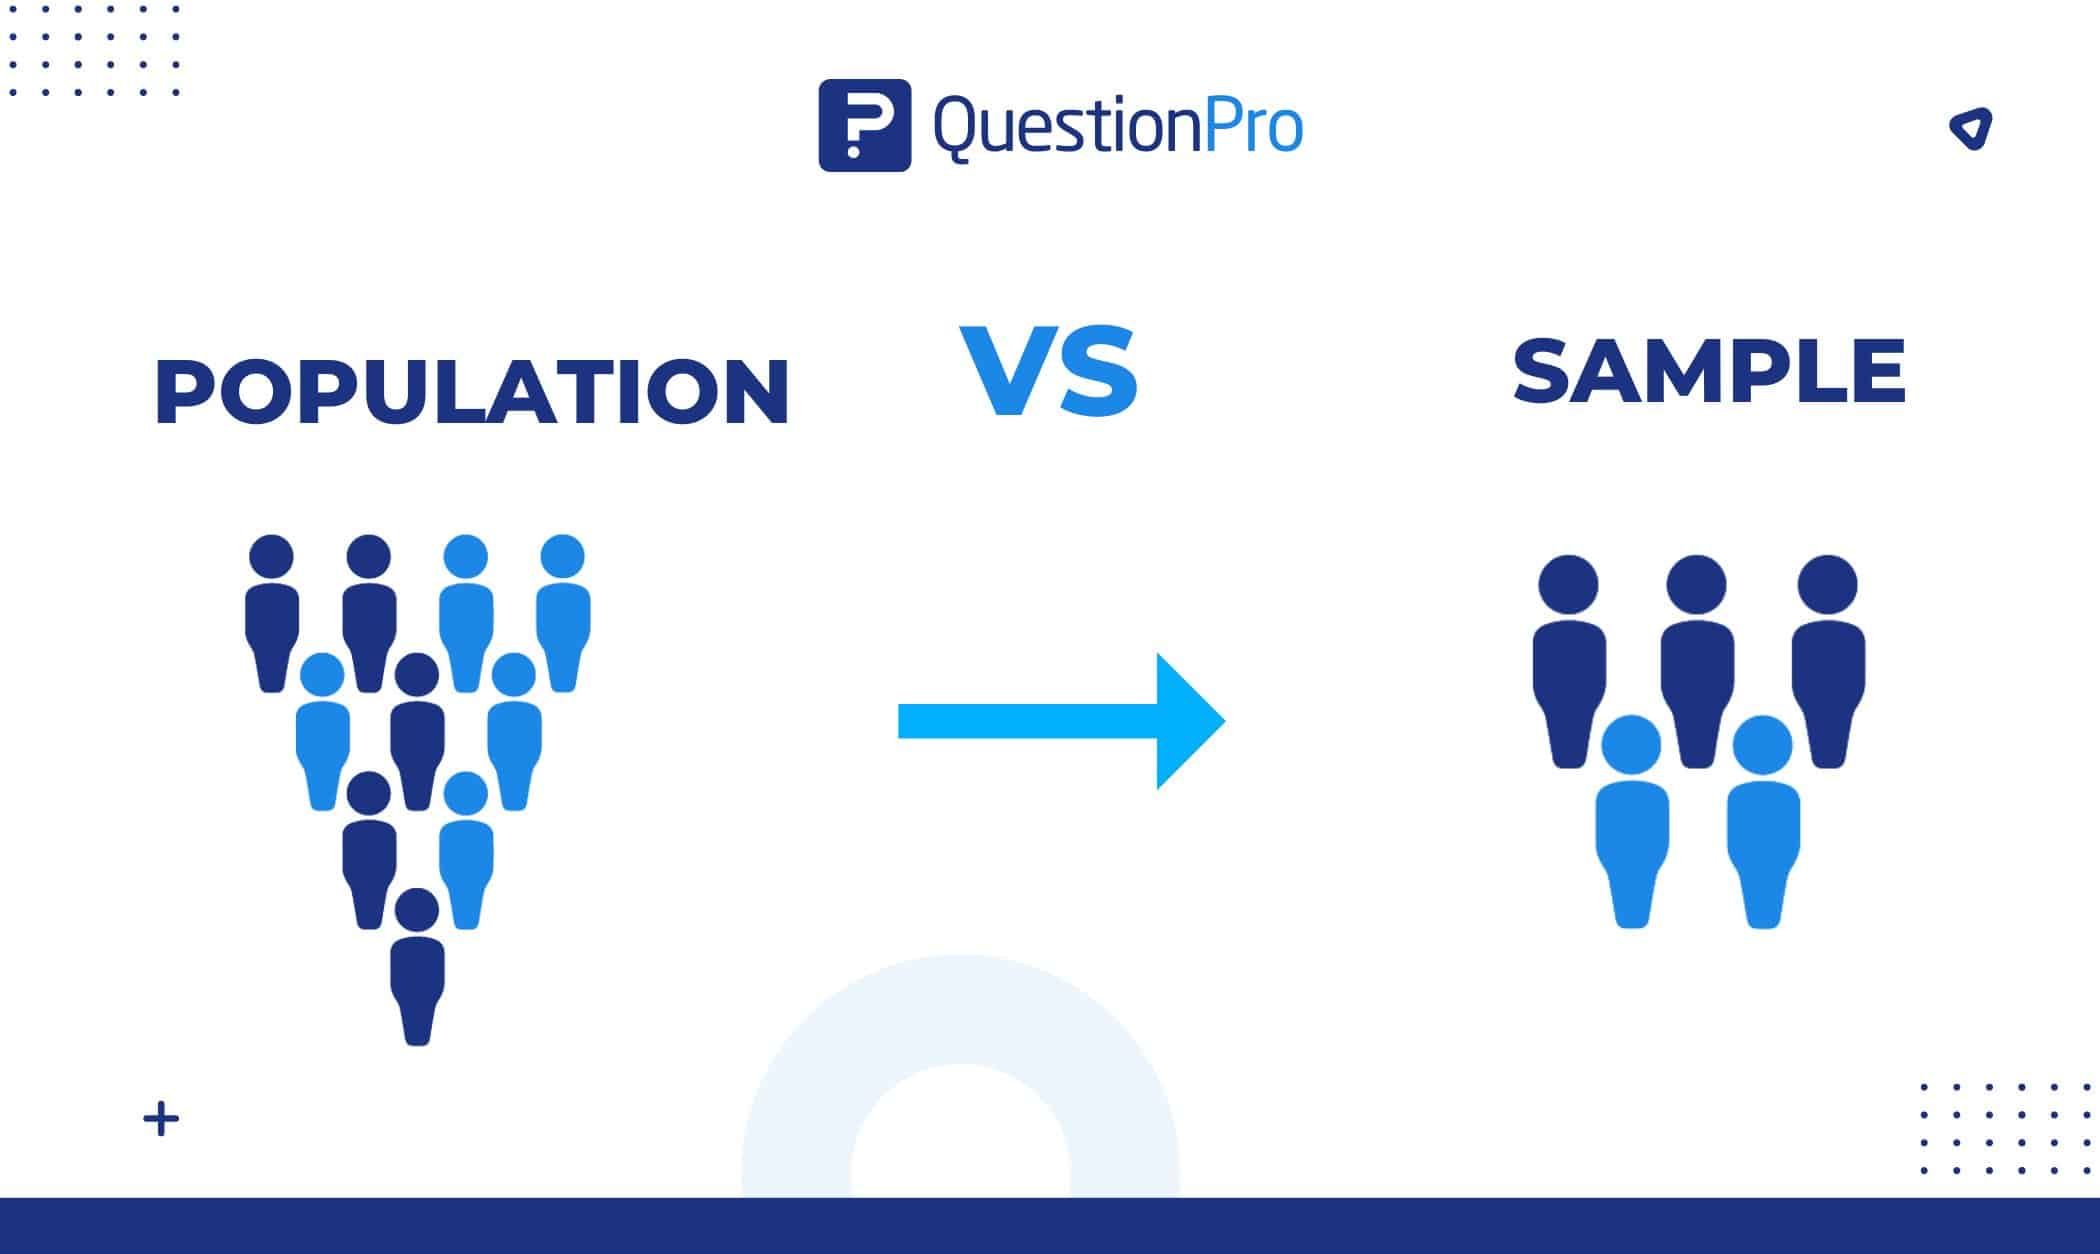
Understanding population vs sample starts with one core distinction: a population is the complete set of people, items, or data points relevant to a study, while a sample is a smaller subset drawn from that population to represent the whole without studying every single member.
For example, a company studying customer preferences for a new product might define its population as every potential buyer in the target market, then survey a sample of 1,000 qualified respondents drawn from that market to gather usable data.
Researchers rely on samples because studying an entire population is often too expensive, slow, or simply unrealistic. In this blog, we break down how population and sample actually differ, the most common sampling techniques, and how to choose a sample that genuinely represents the group you’re studying.
What does population mean in research?
A population, in research, is the complete set of elements that share a common trait relevant to the study.
Despite the everyday meaning of the word, a research population doesn’t have to be human. A few examples of what counts as a population:
- Every pet store on a specific street
- Every customer who purchased a product in the last year
- Every transaction processed by a system in a given month
- Every registered voter in a specific district
Collecting data from an entire population requires a census, a complete count of every member of that population.
A census works well when the population is small enough to make full collection realistic, like evaluating every customer service representative at a single bank branch. For larger populations, a census becomes expensive and slow, which is exactly why researchers turn to sampling instead.
What is a sample in research?
A sample is a smaller subset of a population, selected to represent the characteristics of the whole group without studying every member.
Researchers build samples using either probability or non-probability sampling methods, depending on the research question and how much precision the study needs. Once collected, a sample can be studied through subgroup analysis to understand how specific segments within it behave differently from the group as a whole.
Consider a cat food company that wants to know which pet stores on a busy street might carry its product. The full population is every pet store on that street. The company doesn’t need to survey every store, instead, it samples the subset of stores that already sell cat food, studies their characteristics, and uses those findings to guide expansion into the broader population of stores.
This same logic applies far beyond retail. A hospital studying patient satisfaction doesn’t survey every patient who has ever visited, it samples a representative group from a defined time period. A software company measuring feature adoption doesn’t analyze every single user session, it samples a statistically sound portion of them. The underlying goal is always the same: draw conclusions about the whole from a smaller, well-chosen piece of it.
Population vs sample: what’s the actual difference?
The core difference is scope: a population includes every relevant member of a group, while a sample is a smaller, manageable subset drawn from it to make research practical.
| Factor | Population | Sample |
|---|---|---|
| Definition | The entire group being studied | A subset drawn from the population |
| Size | Complete, often very large | Smaller, defined by the researcher |
| Data collection method | Census | Sampling |
| Cost | Higher, more resources needed | Lower, fewer resources needed |
| Time required | Longer | Shorter |
| Accuracy | Complete, but harder to execute well at scale | Depends on sample size and method, but often more practical to execute accurately |
A quick set of real-world examples makes this concrete:
| Population | Sample |
|---|---|
| All books in a library | 50 randomly selected books to assess genre distribution |
| All smartphones available in the market | 100 smartphones from various brands tested for battery performance |
| All movie theaters in a city | 10 theaters selected to survey customer satisfaction |
| All flights departing from a major airport | 30 random flights tracked for on-time performance in one day |
Notice that in every example, the sample shares the same defining characteristic as its population, books, smartphones, theaters, flights, just at a scale that’s actually manageable to study directly. That shared characteristic is what makes a sample valid: it has to represent the same underlying group, not a related but different one.
When should you collect data from a whole population instead of a sample?
Full population data collection makes sense when the population is small, when precision requirements are high, or when legal standards require it.
- Small population size: When the group is small enough, surveying everyone is realistic and avoids sampling entirely.
- High precision requirements: Decisions with major consequences, like healthcare studies or policy-making, often justify the extra cost of a full census.
- Minimizing sampling bias: Including every member removes the risk of a sample skewing results.
- Homogeneous populations: Highly uniform groups produce less variation, making full collection more manageable.
- Legal or regulatory requirements: National census surveys and certain environmental studies mandate full population data by law.
- Rare populations: When every member’s input is essential, sampling risks missing critical variation entirely.
None of these scenarios are common in everyday market research, which is exactly why sampling remains the default. But recognizing when a full population census makes more sense than a sample prevents researchers from defaulting to sampling out of habit when a small, well-defined group would be better served by studying everyone.
What are the most common sampling techniques?
Sampling techniques fall into two categories: probability sampling, where selection follows a random process, and non-probability sampling, where the researcher applies judgment to select participants.
Probability sampling methods:
- Simple random sampling: Every population member has an equal chance of selection
- Cluster sampling: The population is divided into groups, then entire groups are randomly selected
- Systematic sampling: After a random starting point, every fixed interval, like every 10th person on a list, is selected
- Stratified random sampling: The population is split into subgroups first, then sampled from each to ensure representation
Non-probability sampling methods:
- Convenience sampling: Participants are selected based on how easy they are to reach
- Judgmental or purposive sampling: The researcher selects participants based on specific criteria or expertise needed
- Snowball sampling: Existing participants refer other qualified participants, useful for hard-to-reach groups
- Quota sampling: The researcher sets targets for specific subgroups to keep the sample balanced
Probability sampling tends to produce more statistically reliable results since every population member has a known chance of selection. Non-probability sampling is faster and cheaper, but carries a higher risk of bias since selection depends on the researcher’s judgment rather than chance.
Choosing between the two categories usually comes down to what the research actually needs. A political poll aiming to represent an entire electorate needs probability sampling to support valid statistical inference. A startup gathering quick, informal feedback from whoever happens to be available might reasonably use convenience sampling instead, accepting the tradeoff in representativeness for speed.
How do you choose a high-quality sample?
A high-quality sample gives every population member a fair chance of inclusion and includes enough respondents to reflect the population’s actual variation.
Even with proper randomization, no two samples from the same population will look identical, some traits vary more than others. A set of samples measuring body temperature will show little variation between groups, while the same samples measured for blood pressure might show substantial differences.
Sample size is the other major factor. Determining the right sample size matters because smaller samples are less precise. Pew Research Center’s own methodology work shows this concretely: a random sample of about 1,067 people carries a margin of error of roughly plus or minus 3 percentage points, but that margin grows substantially for smaller subgroups within the same sample. The larger and better-constructed the sample, the more consistently it resembles the population it’s drawn from.
This is why two samples drawn from the same population, even using identical methods, will rarely produce identical results, but larger, well-constructed samples converge toward each other far more reliably than small ones. A market researcher deciding between a 200-person and a 2,000-person sample isn’t just buying more data, they’re buying a tighter, more trustworthy range around the true population value.
What common sampling errors should you watch for?
Sampling errors happen when a sample fails to accurately reflect the population it’s meant to represent, usually through a specific, identifiable pattern rather than random chance.
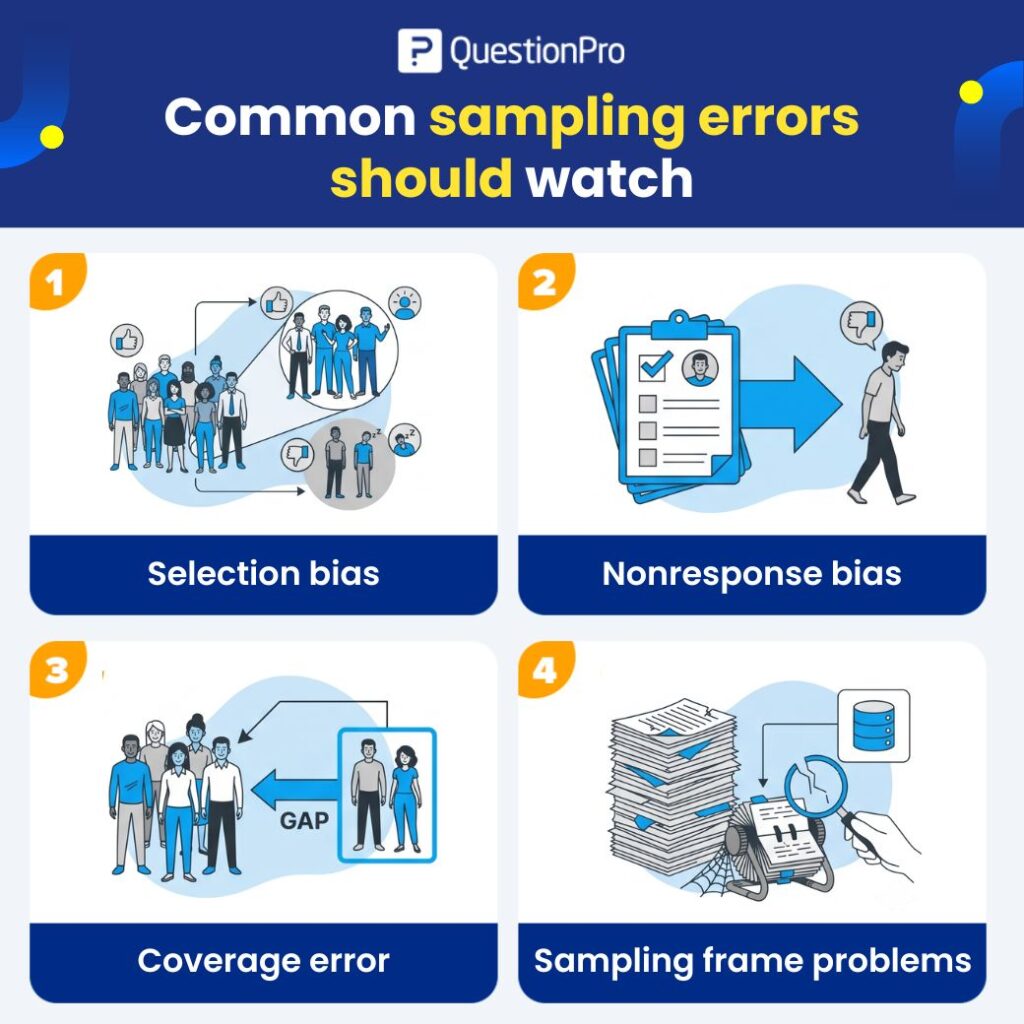
- Selection bias: Certain groups get included more often than others, like a customer survey sent only to highly active users, missing dissatisfied or inactive ones entirely.
- Nonresponse bias: People who choose not to respond often differ systematically from those who do, which can make satisfaction look better or worse than reality.
- Coverage error: The sampling frame excludes part of the population it’s meant to cover, like surveying only email subscribers when the target population includes offline customers too.
- Sampling frame problems: An outdated or incomplete list used to draw the sample introduces the same bias regardless of how careful the selection method is afterward.
None of these errors are visible in the resulting data itself, they show up as misleading conclusions that look statistically sound. Catching them requires scrutinizing how the sample was built, not just how large it was.
Why do researchers use samples instead of a full population?
Researchers default to sampling because it’s faster, cheaper, and often more accurate than attempting a full census.
- Practicality: Most populations are too large to study in full, making sampling the only realistic option.
- Speed: A smaller data set can be collected and analyzed far faster than a full population, which matters when timing affects the value of the findings.
- Cost-effectiveness: Fewer interviewers, less infrastructure, and a smaller data collection footprint all reduce research costs.
- Reduced bias with the right method: A carefully selected sample can produce less sampling bias than a rushed or incomplete census.
- Foundation for inferential statistics: Inferential statistics rely entirely on sample data to draw conclusions about a broader population.
The tradeoff is manageable as long as the sample is built with a sound method. A representative sample, chosen well, tells you nearly everything a full census would, at a fraction of the time and cost.
This is why sampling has become the default approach across nearly every field that relies on data, from political polling to product testing to public health research. The rare exceptions, national censuses, legally mandated environmental surveys, tend to be the cases where full population data is either required by law or the population is small enough that sampling wouldn’t save meaningful time or money anyway.
What are the best practices for using population and sample in research?
Good sampling practice starts before a single question gets written, with a precise definition of exactly who or what the study is about.
- Define the population before writing the survey. Vague definitions like “customers” should become specific ones, like “customers in the United States who purchased in the last six months.”
- Match the sample to the research goal. A study about enterprise software buyers needs qualified B2B respondents, not general consumers who happen to be available.
- Use screening questions. Confirming a respondent actually qualifies matters most for niche audiences, B2B research, and category-specific studies.
- Apply quotas when group balance matters. Setting targets for age, region, or customer segment keeps a sample from skewing toward whichever group is easiest to reach.
- Be transparent about limitations. Every method has them. Stating how a sample was selected and what population it represents lets readers judge the findings appropriately.
- Avoid overgeneralizing results. A convenience sample or other non-probability method wasn’t designed to represent a larger population, and presenting it that way overstates what the data actually supports.
How can QuestionPro support population and sample research?
Selecting the right target population and drawing a representative sample from it is the step most likely to determine whether research findings actually hold up.
QuestionPro Audience provides access to pre-vetted respondent panels that can be filtered to match a specific target population’s characteristics, which removes much of the manual work involved in finding qualified sample participants. Getting the sampling frame and method right at the start matters more than any analysis done afterward, since no amount of statistical technique can fix data collected from the wrong population.
Filtering by demographic, geographic, or behavioral criteria before data collection even begins helps ensure the resulting sample actually reflects the population a study is meant to represent, rather than discovering a mismatch after the data is already in.
Frequently Asked Questions (FAQs)
Yes. By definition, a sample is a subset of a population, so it can never be larger. A sample can, in rare cases, equal the population’s size only if every member is included, which effectively makes it a census.
Yes, if it’s built with a sound sampling method and adequate size. A well-constructed sample often produces more reliable results than a rushed census, since census efforts can suffer from inconsistent responses and non-response bias.
Probability sampling selects participants randomly, giving every population member a known chance of inclusion. Non-probability sampling relies on the researcher’s judgment, which is faster but carries a higher risk of bias.
There’s no single answer. It depends on the population size, the level of precision needed, and how much variation exists within the population. Larger samples generally produce smaller margins of error.
A census works best for small populations, situations requiring high precision like healthcare or policy decisions, or when law requires full population data, such as a national census survey.


