• Skip to main content
  • Skip to primary sidebar
  • Skip to footer
QuestionPro

QuestionPro

questionpro logo
  • Products
    survey software iconSurvey softwareEasy to use and accessible for everyone. Design, send and analyze online surveys.research edition iconResearch SuiteA suite of enterprise-grade research tools for market research professionals.CX iconCustomer ExperienceExperiences change the world. Deliver the best with our CX management software.WF iconEmployee ExperienceCreate the best employee experience and act on real-time data from end to end.
  • Solutions
    IndustriesGamingAutomotiveSports and eventsEducationGovernment
    Travel & HospitalityFinancial ServicesHealthcareCannabisTechnology
    Use CaseAskWhyCommunitiesAudienceContactless surveysMobile
    LivePollsMember ExperienceGDPRPositive People Science360 Feedback Surveys
  • Resources
    BlogeBooksSurvey TemplatesCase StudiesTrainingHelp center
  • Features
  • Pricing
Language
  • English
  • Español (Spanish)
  • Português (Portuguese (Brazil))
  • Nederlands (Dutch)
  • العربية (Arabic)
  • Français (French)
  • Italiano (Italian)
  • 日本語 (Japanese)
  • Türkçe (Turkish)
  • Svenska (Swedish)
  • Hebrew IL (Hebrew)
  • ไทย (Thai)
  • Deutsch (German)
  • Portuguese de Portugal (Portuguese (Portugal))
Call Us
+1 800 531 0228 +1 (647) 956-1242 +52 999 402 4079 +49 301 663 5782 +44 20 3650 3166 +81-3-6869-1954 +61 2 8074 5080 +971 529 852 540
Log In Log In
SIGN UP FREE

Home Uncategorized

Customizing Spider Graphs – Mean vs. % Agreement Top Box Scoring

You have collected the survey data, now it’s time to analyze it! Want to understand the metrics behind our dashboard? What the difference between mean and % differ? Want to know how to customize your dashboard? Let’s have a look at how this works.

Customizable Spider Graphs – Mean Vs. % Agreement Top Box Scoring

Lately we’ve found ourselves tinkering with our Workforce Data Visualization platform in an effort for businesses to seamlessly make sense of a large quantity of data. With spider graphs, Human Resource managers can visualize employee performance data on a single chart. This helps to quickly identify and act on emerging trends within their workplace.
To get an idea of how we measure and report findings – let’s take a step back and understand the underlying reporting values of a standard six-scale agreement, called Bipolar Likert Scale. The scoring logic is set by default 1-5 with a score of 0 for not applicable responses.

bipolar likert scale

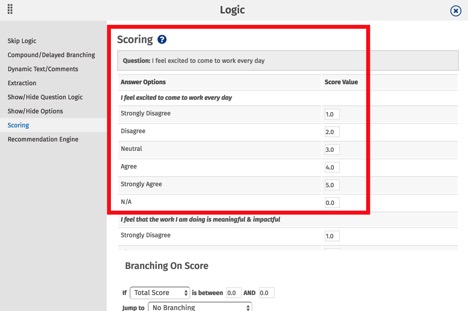
For organizational leaders to make highly informed decisions, there are two powerful ways to interpret and manipulate data in real-time. This is by Mean (Spider Graph) and % Agreement Top Box Scoring. After survey responses are collected, results are displayed on QuestionPro’s Analytics Dashboard using an intuitive spider graph.
This has become extremely popular with an annual cultural survey which team members evaluate the company by mapping cultural value sets against each other. Using QuestionPro’s dashboard, HR Managers can gain insights to morale and identify any gaps which may be inhibiting growth.

Mean (Spider Graph)

The mean uses every value in the data in a sample population. For that reason, the mean is a good representative of underlying data. Ironically, since a mean is an average of a set of numbers we typically do not find in this value in the raw data.
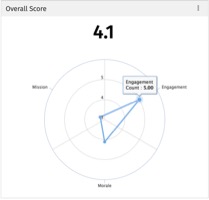
To interpret a spider graph, a user needs to first identify the scale. In the example below, the axis represents the common six-point Likert agreement scale. By hovering over data points, we reveal the overall sentiment of the team is high engagement which is indicated by the highlighted data point is touching the outermost rim. Since the data points are plotted on the same two-dimensional chart, management can derive that more attention is needed around mission and morale initiatives. The overall mean score is incredibly powerful when data is compared and contrasted over time.

spider graph


% Agreement Top Box Scoring

Top-box scoring systems main benefit is simplicity and quickly assessing results. In the absence of benchmarks or historical data, managers look at so-called top-box scoring. You might be asking yourself how QuestionPro groups value into “top box”. It’s actually quite simple – we tally the number of respondents which mark Agree & Strongly Agree.

likert

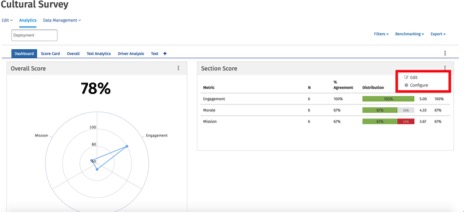
To understand the sample population’s level of agreement – we’ve coupled top box scoring with the percentage of agreement. The idea behind this practice is that scores strong attitude with a statement are highlighted. For example, in our example of a cultural study the manager will infer that team members(100%) feel a strong sense of employee engagement and which draws attention to areas of improvement, such as, mission and morale.
Keep in mind spider graph mapping is extremely versatile and can also be applied to a variety of employee surveys.

Got an idea on how we can we make this feature even better? Post it on QuestionPro Ideas!
http://ideas.questionpro.com/a/shIdea/20654-388

Workforce Dashboard Customization

You requested more dashboard customization options and we listened! In order to deliver the best employee survey resource platform, we added a variety of options to make reports represent the metrics which drives YOUR business. We’ve added customized functionality such as toggle functionality for number of respondents, % Agreement, Distribution, mean, overall and sorting functions. Our workforce dashboard insanely easy and intuitive to customize – Let’s take a look at how this works.
To get started, click on the configuration icon at the top right corner of the section score tile.

custom-dashboard

Here you will find a variety of tile customization tools nested in Edit & Configure.

section configuration

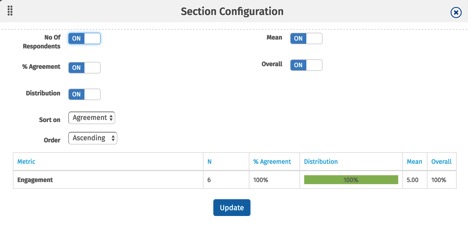
We’ve designed our dashboard to be flexible in order to tailor for your specific needs. and fired on all data toggles – the preferred configuration used most commonly by our customers.
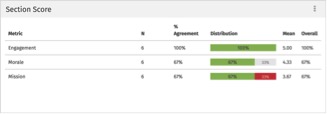
Let’s break down dashboard metrics:

  • Number of Respondents – Highlights the number of completed surveys
  • % Agreement – Top box score divided by number of respondents
  • Distribution – Color-coded representation of positive/neutral/negative responses
  • Mean – Averages respondent scores
  • Overall – Representation responses of the organization as a whole


We are committed to providing a robust dashboard so people managers can draw meaningful and actionable insights. Stay tuned for more updates – as we continually add new features to our to provide the best information for our users.

section-scoring
Got an idea on how we can we make this feature even better? Post it on QuestionPro Ideas!
http://ideas.questionpro.com/a/shIdea/20654-389

SHARE THIS ARTICLE:

About the author
James Solada

View all posts by James Solada

Primary Sidebar

Gain insights with 80+ features for free

Create, Send and Analyze Your Online Survey in under 5 mins!

Create a Free Account

RELATED ARTICLES

HubSpot - QuestionPro Integration

Top 8 Panel Research Companies for Quality Research in 2025

May 06,2025

HubSpot - QuestionPro Integration

Free Online Suggestion Box: What It Is + How to Implement It

Aug 09,2022

HubSpot - QuestionPro Integration

5-point vs 7-point Likert scale: Choosing the Best

Feb 19,2024

BROWSE BY CATEGORY

  • Academic
  • Academic Research
  • Artificial Intelligence
  • Assessments
  • Audience
  • Brand Awareness
  • Business
  • Case Studies
  • Communities
  • Consumer Insights
  • Customer effort score
  • Customer Engagement
  • Customer Experience
  • Customer Loyalty
  • Customer Research
  • Customer Satisfaction
  • CX
  • Employee Benefits
  • Employee Engagement
  • Employee Engagement
  • Employee Retention
  • Enterprise
  • Events
  • Forms
  • Friday Five
  • General Data Protection Regulation
  • Guest Post
  • Insights Hub
  • Life@QuestionPro
  • LivePolls
  • Market Research
  • Marketing
  • Mobile
  • Mobile App
  • Mobile diaries
  • Mobile Surveys
  • New Features
  • non-profit
  • NPS
  • Online Communities
  • Polls
  • Question Types
  • Questionnaire
  • QuestionPro
  • QuestionPro Products
  • Release Notes
  • Research Tools and Apps
  • Revenue at Risk
  • Startups
  • Survey Templates
  • Surveys
  • Tech News
  • Tips
  • Training
  • Training Tips
  • Trending
  • Tuesday CX Thoughts (TCXT)
  • Uncategorized
  • VOC
  • Webinar
  • Webinars
  • What’s Coming Up
  • Workforce
  • Workforce Intelligence

Footer

MORE LIKE THIS

Credit-Unions-NPS-2025

Credit Unions NPS Leading in Loyalty in 2025

May 21, 2025

ken tcxt

Experience – What’s Included? | Tuesday CX Toughts

May 20, 2025

artificial-data

What is Artificial Data & How It’s Shaping Research

May 20, 2025

wells-fargo-nps-2025

Wells Fargo NPS 2025: What Businesses Can Learn

May 19, 2025

Other categories

  • Academic
  • Academic Research
  • Artificial Intelligence
  • Assessments
  • Audience
  • Brand Awareness
  • Business
  • Case Studies
  • Communities
  • Consumer Insights
  • Customer effort score
  • Customer Engagement
  • Customer Experience
  • Customer Loyalty
  • Customer Research
  • Customer Satisfaction
  • CX
  • Employee Benefits
  • Employee Engagement
  • Employee Engagement
  • Employee Retention
  • Enterprise
  • Events
  • Forms
  • Friday Five
  • General Data Protection Regulation
  • Guest Post
  • Insights Hub
  • Life@QuestionPro
  • LivePolls
  • Market Research
  • Marketing
  • Mobile
  • Mobile App
  • Mobile diaries
  • Mobile Surveys
  • New Features
  • non-profit
  • NPS
  • Online Communities
  • Polls
  • Question Types
  • Questionnaire
  • QuestionPro
  • QuestionPro Products
  • Release Notes
  • Research Tools and Apps
  • Revenue at Risk
  • Startups
  • Survey Templates
  • Surveys
  • Tech News
  • Tips
  • Training
  • Training Tips
  • Trending
  • Tuesday CX Thoughts (TCXT)
  • Uncategorized
  • VOC
  • Webinar
  • Webinars
  • What’s Coming Up
  • Workforce
  • Workforce Intelligence

questionpro-logo-nw
Help center Live Chat SIGN UP FREE
  • Sample questions
  • Sample reports
  • Survey logic
  • Branding
  • Integrations
  • Professional services
  • Security
  • Survey Software
  • Customer Experience
  • Workforce
  • Communities
  • Audience
  • Polls Explore the QuestionPro Poll Software - The World's leading Online Poll Maker & Creator. Create online polls, distribute them using email and multiple other options and start analyzing poll results.
  • Research Edition
  • LivePolls
  • InsightsHub
  • Blog
  • Articles
  • eBooks
  • Survey Templates
  • Case Studies
  • Training
  • Webinars
  • All Plans
  • Nonprofit
  • Academic
  • Qualtrics Alternative Explore the list of features that QuestionPro has compared to Qualtrics and learn how you can get more, for less.
  • SurveyMonkey Alternative
  • VisionCritical Alternative
  • Medallia Alternative
  • Likert Scale Complete Likert Scale Questions, Examples and Surveys for 5, 7 and 9 point scales. Learn everything about Likert Scale with corresponding example for each question and survey demonstrations.
  • Conjoint Analysis
  • Net Promoter Score (NPS) Learn everything about Net Promoter Score (NPS) and the Net Promoter Question. Get a clear view on the universal Net Promoter Score Formula, how to undertake Net Promoter Score Calculation followed by a simple Net Promoter Score Example.
  • Offline Surveys
  • Customer Satisfaction Surveys
  • Employee Survey Software Employee survey software & tool to create, send and analyze employee surveys. Get real-time analysis for employee satisfaction, engagement, work culture and map your employee experience from onboarding to exit!
  • Market Research Survey Software Real-time, automated and advanced market research survey software & tool to create surveys, collect data and analyze results for actionable market insights.
  • GDPR & EU Compliance
  • Employee Experience
  • Customer Journey
  • Synthetic Data
  • About us
  • Executive Team
  • In the news
  • Testimonials
  • Advisory Board
  • Careers
  • Brand
  • Media Kit
  • Contact Us

QuestionPro in your language

  • English
  • Español (Spanish)
  • Português (Portuguese (Brazil))
  • Nederlands (Dutch)
  • العربية (Arabic)
  • Français (French)
  • Italiano (Italian)
  • 日本語 (Japanese)
  • Türkçe (Turkish)
  • Svenska (Swedish)
  • Hebrew IL (Hebrew)
  • ไทย (Thai)
  • Deutsch (German)
  • Portuguese de Portugal (Portuguese (Portugal))

Awards & certificates

  • survey-leader-asia-leader-2023
  • survey-leader-asiapacific-leader-2023
  • survey-leader-enterprise-leader-2023
  • survey-leader-europe-leader-2023
  • survey-leader-latinamerica-leader-2023
  • survey-leader-leader-2023
  • survey-leader-middleeast-leader-2023
  • survey-leader-mid-market-leader-2023
  • survey-leader-small-business-leader-2023
  • survey-leader-unitedkingdom-leader-2023
  • survey-momentumleader-leader-2023
  • bbb-acredited
The Experience Journal

Find innovative ideas about Experience Management from the experts

  • © 2022 QuestionPro Survey Software | +1 (800) 531 0228
  • Sitemap
  • Privacy Statement
  • Terms of Use