JP Morgan Chase and Co’s NPS score for 2025 moved more than almost any other major bank tracked this year, closing the year far from where it started.
Net Promoter Score (NPS) measures how likely customers are to recommend a company to someone else, and it is one of the most closely watched loyalty metrics in banking. For a bank the size of Chase, even a small shift in that number reflects millions of real interactions with tellers, apps, fees, and support calls.
This piece breaks down Chase’s quarter by quarter NPS performance for 2025, compares it against competitors like Capital One and Bank of America, and explains why different sources report different scores for the same company.
What is Net Promoter Score (NPS) and how is it calculated?
Net Promoter Score (NPS) is a customer loyalty metric that measures how likely a customer is to recommend a company to someone else. It comes from a single question on a 0 to 10 scale: “How likely are you to recommend [Company] to a friend or colleague?” QuestionPro’s Net Promoter Score tool explains the full methodology in more depth.
Based on their answer, each customer falls into one of three groups.
- Promoters (score 9 to 10): Customers who actively recommend the brand.
- Passives (score 7 to 8): Satisfied customers who are not enthusiastic advocates.
- Detractors (score 0 to 6): Unhappy customers who may discourage others from using the brand.
NPS is calculated by subtracting the percentage of detractors from the percentage of promoters. Scores range from -100 to 100, and there is no single passing grade. Industry, sample, and time period all matter, which is exactly why Chase’s own score needs context rather than a single headline number.
What is JPMorgan Chase’s NPS score in 2025?
Chase’s NPS moved from 43 in the first quarter of 2025 to 38 by the fourth quarter, according to QuestionPro’s quarterly Experience Benchmarks research on U.S. banking and credit unions.
The score was not stable in between. It dropped to 30 in the second quarter, spiked to 60 in the third quarter, then fell back to 38 in the fourth quarter as the broader banking sector cooled.
| Quarter | Chase NPS | Banking and credit union average |
| Q1 2025 | 43 | 41 |
| Q2 2025 | 30 | 33 |
| Q3 2025 | 60 | 51 |
| Q4 2025 | 38 | 26 |
By year end, Chase’s NPS of 38 sat 12 points above the industry average of 26, even though its own score had fallen sharply from its third quarter high.
Why did Chase’s NPS swing so much across 2025?
The third quarter spike to 60 lined up with a broader industry wide surge that researchers linked to promotional rate offers and seasonal optimism across banking as a whole.
By the fourth quarter, fees, lower deposit rates, and service fatigue pulled the score back toward where it started the year. Researchers described this as a temporary high from mid year promotions fading once year end financial realities set in.
The pattern was not unique to Chase. Bank of America’s NPS fell from a Q3 high of 57 down to 27 in Q4, and U.S. Bank dropped from 46 to 36 over the same stretch. That shared timing suggests the pullback reflected sector wide pressure rather than a problem specific to Chase.
How does Chase compare to other major banks?
In the fourth quarter of 2025, Chase’s NPS placed it in the middle of the pack among major U.S. banks and credit unions, well behind USAA but ahead of several national competitors.
| Bank or credit union | Q4 2025 NPS |
| USAA | 56 |
| Capital One | 49 |
| Chase | 38 |
| U.S. Bank | 36 |
| Bank of America | 27 |
| Citibank | 22 |
| Local credit unions | 20 |
| Wells Fargo | 15 |
Capital One’s NPS also pulled back from a Q3 high, while USAA was the only major brand in the category to actually improve its score across the second half of the year.
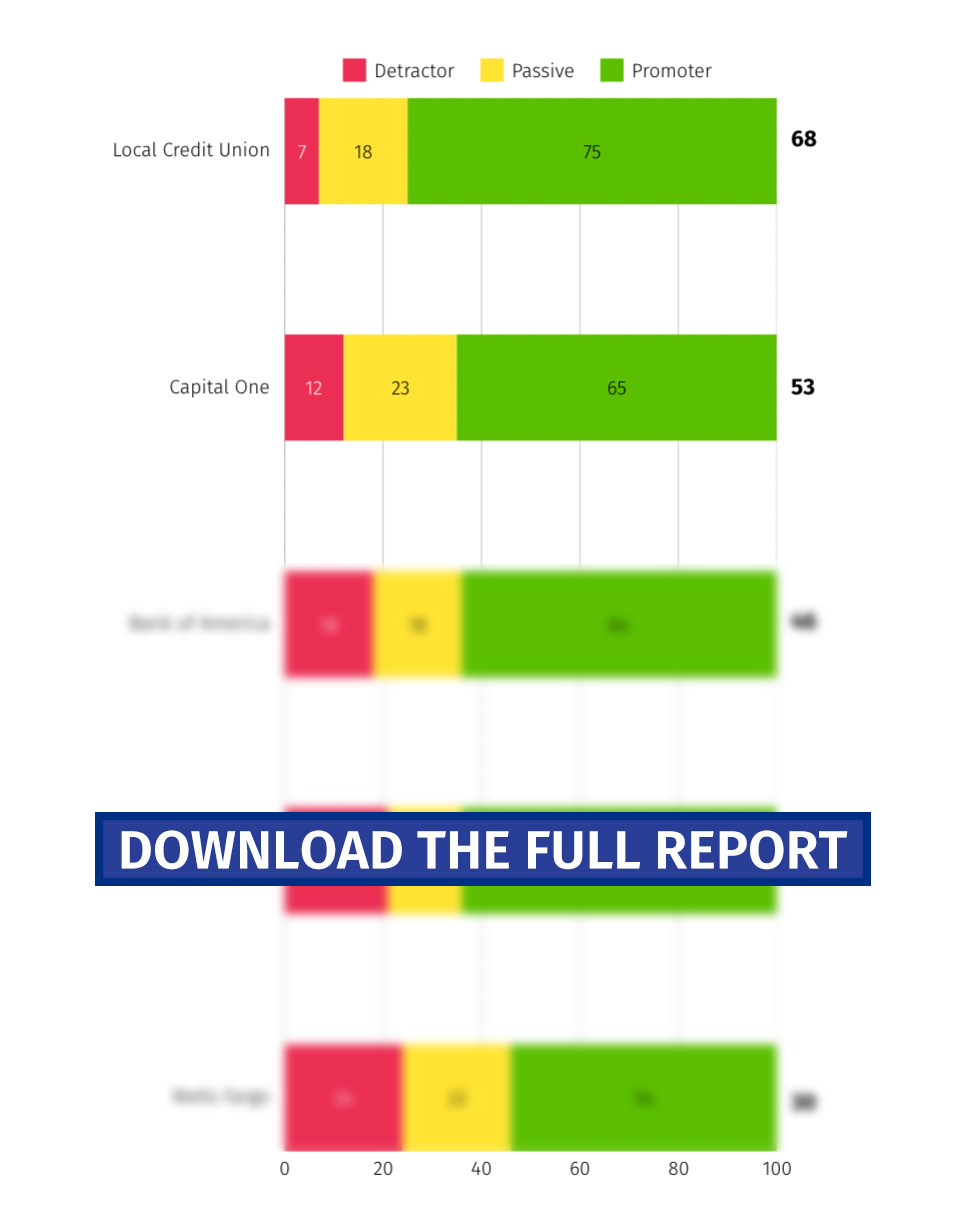
These insights are based on QuestionPro’s latest study, which surveyed 1,000 participants to calculate the NPS of various companies and industries. This report represents real user opinions from Q1 2025 and is updated quarterly.
Why do NPS scores for Chase vary across different sources?
Search for Chase’s NPS score and several different numbers show up, and each one comes from a different sample, question, and time period.
- QuestionPro’s Q4 2025 study put Chase’s NPS at 38, based on a survey of more than 1,000 U.S. consumers involved in household purchasing decisions in November 2025.
- Comparably, a brand and workplace review platform, has tracked Chase at an NPS near 31 across most of 2025, based on its own visitor survey panel.
- Chase itself has reported a higher internal figure. In an investor presentation covered by Customer Experience Dive, the bank said its “One Chase” NPS survey of primary deposit customers and highly engaged card members reached 65.
None of these numbers is wrong on its own. They measure different customer groups at different times using different survey designs, which is exactly why any single NPS figure needs a stated source, date, and sample before it gets used to make a real decision.
What counts as a good NPS score in banking?
There is no universal passing score for NPS, but industry benchmarks make it possible to judge a number like Chase’s 38 fairly. A score above 50 generally signals excellent loyalty, a score between 30 and 50 signals solid customer advocacy, a score between 0 and 30 leaves clear room for improvement, and a negative score points to a serious trust problem.
Chase’s 38 falls into the solid range, similar to where the wider banking industry benchmarks sat for most of 2025. For a second reference point, the J.D. Power 2025 U.S. National Banking Satisfaction Study ranked Capital One first, U.S. Bank second, and Chase third among large national banks on a related satisfaction measure. That result reinforces that Chase sits in the upper half of the market without leading it outright.
What is driving customer sentiment at Chase right now?
Two other 2025 metrics help explain what sits behind the recommendation score itself: customer satisfaction, or CSAT, which measures happiness with one specific interaction, and future purchase intent, which tracks whether a customer plans to keep using the bank.
| Metric | Q3 2025 | Q4 2025 |
| Customer satisfaction (CSAT) | 91% | 89% |
| Future purchase intent | 93% | 82% |
Chase’s Q4 CSAT of 89 percent was the highest of any brand tracked in the banking and credit union category that quarter, and its purchase intent of 82 percent tied Capital One for the top spot. Real product moves likely reinforce that stability. Chase has continued expanding Chase Travel for booking flights and hotels, added credit score and wealth planning tools inside its app, and kept opening new branches as part of a multi year expansion plan. Together, these point to a bank whose day to day service experience remains strong even while its customer sentiment toward recommending it fluctuated.
Common mistakes to avoid when benchmarking a bank’s NPS
Comparing NPS scores across banks and time periods is easy to get wrong, and a handful of recurring mistakes distort the picture more than the underlying data does.
- Comparing scores from different quarters without noting the date, since a single quarter’s swing, like Chase’s Q3 spike to 60, can look permanent when it was temporary.
- Mixing NPS with unrelated metrics such as CSAT or star ratings, which use different scales and cannot be averaged together.
- Treating a small sample third party score as equivalent to a company’s own large scale internal survey, when sample size and respondent type shift results significantly.
- Ignoring industry context, since Wells Fargo’s NPS of 15 means something very different in banking than the same number would in a lower scoring industry.
How to measure and track your own bank’s NPS score
Benchmarking Chase or any competitor only matters if you can track your own customers with the same rigor.
- Send a single 0 to 10 recommendation question right after a key interaction, such as opening an account or resolving a support ticket.
- Group responses into promoters, passives, and detractors, then calculate the score using the standard formula.
- Segment results by channel, product, and region to find where loyalty is strongest and weakest.
- Track the score every quarter rather than once a year, since Chase’s own 2025 numbers show how much a score can move in three months.
QuestionPro Customer Experience includes ready made NPS survey templates and live dashboards that handle the first three steps automatically, which frees a CX team to spend more time acting on feedback instead of building the survey from scratch.
Where Chase’s NPS story goes from here
Chase closed 2025 with a score that sat above the industry average despite falling from its third quarter peak, a pattern shared by most of its large bank peers rather than a problem specific to one institution.
The real signal for anyone tracking this number is not the single point figure but the trend line behind it. A 38 built on a stable base of high satisfaction and strong purchase intent tells a very different story than a 38 built on eroding trust. Chase’s next few quarterly reports will show whether the Q4 pullback was the same seasonal cooling every major bank experienced, or the start of something longer.
Need help optimizing your NPS strategy? QuestionPro Customer Experience offers a wide range of tools and platforms so you can not only measure your NPS, but also track satisfaction levels and collect feedback from your users at every point of contact. Keep control of your customer journey and improve your company’s satisfaction levels. Schedule a call now, and we’ll happily collaborate to achieve your goals.
Frequently Asked Questions (FAQs)
Chase’s Q4 2025 NPS of 38 ranks fourth among the eight major banks and credit unions QuestionPro tracked, ahead of Bank of America, Citibank, and Wells Fargo, but well behind USAA and Capital One, which led the category that same quarter.
QuestionPro updates its banking NPS research every quarter, and Chase’s score moved by double digits three separate times in 2025. That pace shows how much a single annual average can hide compared to a full quarterly trend.
Yes. Chase has reported an internal “One Chase” NPS in investor materials, measuring primary deposit customers and highly engaged cardholders specifically, which typically produces a higher score than broader third-party consumer panels because the sample skews toward its most loyal customers.
NPS measures whether a customer would recommend a company using a 0 to 10 scale, while CSAT measures satisfaction with one specific interaction on a shorter scale. A bank can score well on one and differently on the other in the same quarter.
Yes. The 0 to 10 recommendation question and the promoter and detractor formula work the same regardless of company size. What changes is sample size and survey frequency, which smaller teams can scale down while still tracking the same score over time.
JPMorgan Chase & Co isn’t the only company in the banking and credit unions industry with valuable lessons for those looking to improve their customer service and experience. Below, we recommend a few articles where you can learn how other major brands manage to maintain a high NPS and a loyal customer base — you’ll surely find some useful insights along the way.