Standard deviation tells you how spread out a set of numbers is around its average. A small standard deviation means most values sit close to the mean. A large one means the data is scattered across a wide range, whether that is survey ratings, ad revenue, or investment returns.
Analysts, researchers, and HR teams all rely on this single number to judge how consistent or volatile their data really is. An average satisfaction score of 8 out of 10 can mean two very different things. Every respondent might have rated it 7 to 9, or scores could have ranged all the way from 2 to 10.
In this article, we’ll learn what standard deviation measures and the formula behind it. We’ll also explore a step-by-step calculation example and where the measure shows up in research, finance, and marketing.
What is standard deviation?
Standard deviation is a statistic that measures how much individual data points differ, on average, from the mean of a data set. It is expressed in the same unit as the original data, which makes it easier to interpret than variance.
- Low standard deviation: Values cluster tightly around the mean. Two classes averaging 75% on a test, with every score between 70 and 80, would show a low standard deviation.
- High standard deviation: Values spread out widely. A second class averaging that same 75%, but with scores ranging from 40 to 100, would show a much higher standard deviation despite the identical average.
This is why standard deviation is one of the core measures in descriptive statistics. The mean alone tells you the center of a data set. Standard deviation tells you how much you can trust that center to represent every individual point.
Standard deviation vs. Variance vs. range: What’s the difference?
These three terms all describe data spread, but they answer slightly different questions. They get confused often enough to warrant a direct comparison.
| Term | What it measures | Unit | Best used when |
|---|---|---|---|
| Range | Distance between the highest and lowest value | Same as the data | You need a quick, rough sense of spread |
| Variance | Average of the squared differences from the mean | Squared unit of the data | You need an input for further statistical formulas |
| Standard deviation | Square root of variance | Same as the data | You need a spread measure that is easy to interpret and compare |
Range only looks at the two most extreme points and ignores everything in between, so a single outlier can distort it. Variance uses every data point, which makes it more reliable. Its squared unit, such as dollars squared or points squared, is hard to interpret on its own. Standard deviation solves that by taking the square root of variance, bringing the measure back into the data’s original unit.
Standard deviation formula: Population vs. Sample
There are two versions of the formula, and using the wrong one is one of the most common calculation errors.
Population standard deviation
Use this when your data set includes every member of the group you care about.
σ = √( Σ(X − μ)² / N ).
Sample standard deviation
Use this when your data is a subset drawn from a larger population.
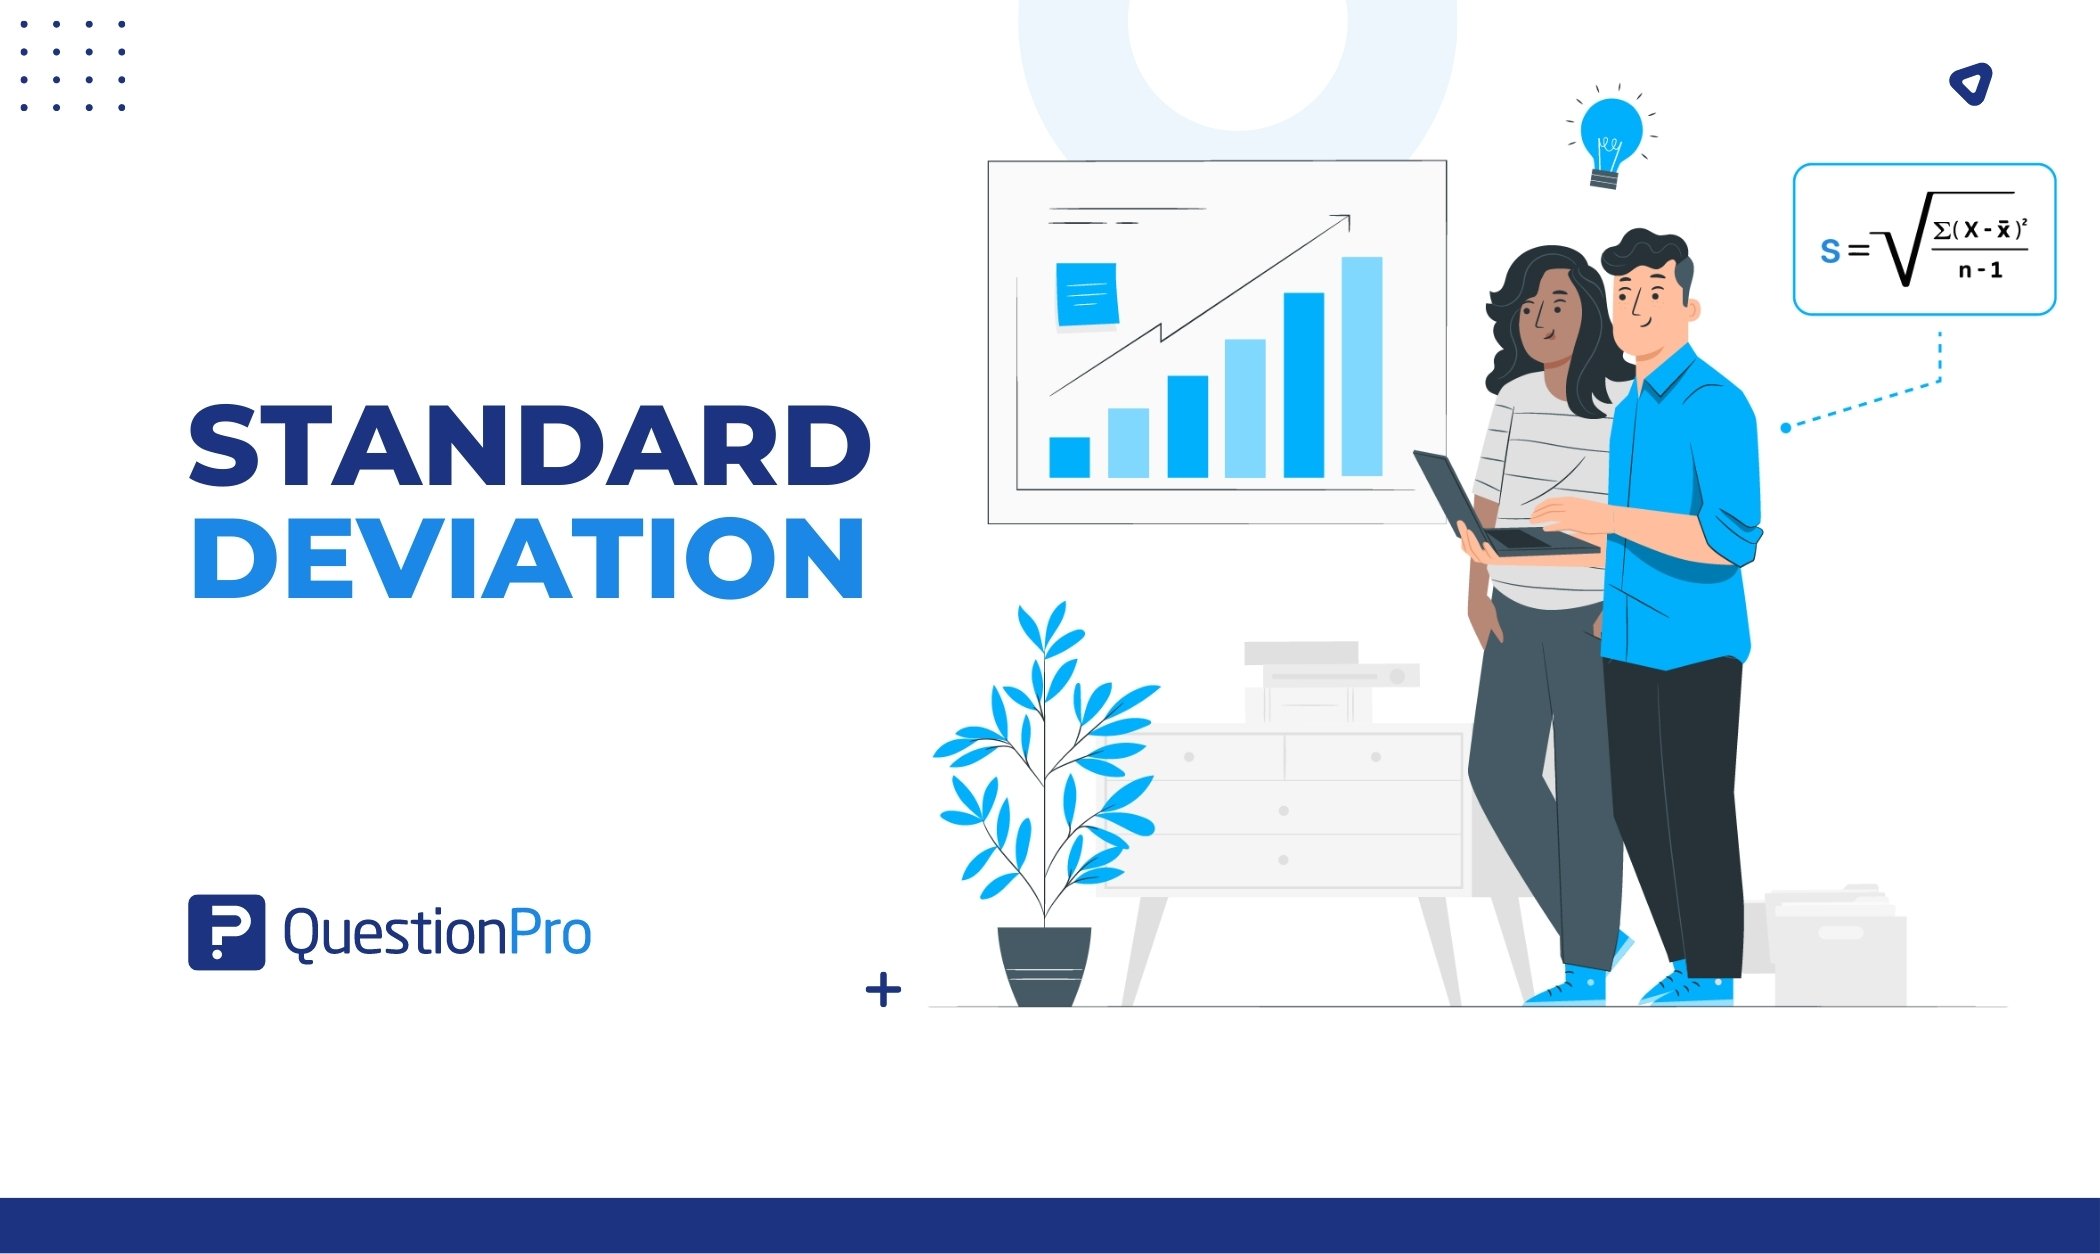
s = √( Σ(X − x̄)² / (n − 1) ).
Here’s what each symbol represents.
- X = each individual value
- μ = population mean, x̄ = sample mean
- N = population size, n = sample size
- Σ = sum of
Which formula should you use?
Use the population formula only when you have data for every unit in the group. Test scores for every student in a single class are a good example. Use the sample formula whenever your data is a sample meant to represent a larger population. This covers most survey and research work.
The sample formula divides by n − 1 instead of n, because dividing by n would consistently underestimate variability. Dividing by n − 1 gives a more conservative, less biased estimate of spread when working from a sample.
How to calculate standard deviation step by step
Here is a worked example using the sample formula, since most real-world data sets are samples.
Data set: 45, 67, 30, 58, 50 (n = 5)
- Find the mean. Add all values and divide by n: (45 + 67 + 30 + 58 + 50) / 5 = 250 / 5 = 50.
- Find each difference from the mean. Subtract the mean from each value.
- Square each difference. This removes negative signs and weights larger gaps more heavily.
- Sum the squared differences, then divide by (n − 1) to get the variance.
- Take the square root of the variance to get the standard deviation.
| Value (X) | Difference (X − x̄) | Squared difference |
|---|---|---|
| 45 | -5 | 25 |
| 67 | 17 | 289 |
| 30 | -20 | 400 |
| 58 | 8 | 64 |
| 50 | 0 | 0 |
Sum of squared differences = 25 + 289 + 400 + 64 + 0 = 778.
Variance = 778 / (5 − 1) = 778 / 4 = 194.5.
Standard deviation = √194.5 ≈ 13.95.
On average, each value in this data set sits about 13.95 points away from the mean of 50.
Why standard deviation matters in data analysis
Standard deviation earns its place as a go-to measure of spread for a few concrete reasons.
- It uses every data point. Unlike range, which only checks the extremes, standard deviation factors in each value, making it a more complete picture of variability.
- It supports further statistical work. Standard deviation feeds directly into confidence intervals, hypothesis tests, and other statistical analysis methods that require a spread measure in the data’s original unit.
- It flags uneven distribution. A high standard deviation signals that a data set isn’t just spread out, but spread unevenly, which often points to subgroups behaving differently.
- It has a fixed, well-defined value for any given data set, so results are reproducible and comparable across studies.
Common uses of standard deviation
Standard deviation shows up anywhere someone needs to judge consistency, not just an average.
Investment risk and volatility
- A fund with a high standard deviation swings further from its average return year to year, which signals more volatility.
- Two funds can post the same average return with very different standard deviations, meaning very different risk profiles behind an identical headline number.
- Investopedia frames this in financial terms: a volatile stock carries a high standard deviation, while a steady, stable stock typically carries a low one.
Marketing and ad performance
Marketers calculate the standard deviation of revenue or conversions across ad sets to understand how much fluctuation to expect from a given campaign.
- A high standard deviation in daily ad revenue suggests performance is unpredictable day to day, even if the monthly average looks healthy.
- A low standard deviation across competitor ad spend suggests the market follows a fairly stable, predictable pattern worth benchmarking against.
HR and compensation
Recruiting and compensation teams calculate the standard deviation of pay within a role before setting an offer range. Doing so shows how much salary variation already exists. A low standard deviation suggests a tight, well-defined pay band. A high one suggests pay varies widely by tenure, location, or negotiation history, which is worth investigating before extending a new offer.
Quality control in operations
Manufacturing and operations teams track the standard deviation of a measurement, such as product weight or delivery time. Doing so catches process drift before it becomes a defect.
- A sudden jump in standard deviation, even with a steady average, often signals a process problem worth investigating immediately.
- A shrinking standard deviation over time usually confirms a process improvement is holding.
How to interpret standard deviation values
A standard deviation number means little on its own. Two ways to give it context:
| Interpretation method | How it works | Example |
|---|---|---|
| Compare to the mean (coefficient of variation) | Divide standard deviation by the mean | An SD of 5 on a mean of 100 (5%) is low variability; an SD of 5 on a mean of 10 (50%) is high |
| Apply the empirical rule (normal distributions only) | About 68% of values fall within 1 SD of the mean, 95% within 2 SD, 99.7% within 3 SD | A mean score of 50 with an SD of 14 means roughly 95% of scores fall between 22 and 78 |
The empirical rule only holds for data that follows a roughly normal, bell-shaped distribution. For skewed data, such as income or response-time data, rely on the coefficient of variation or percentile-based measures instead.
Common mistakes when calculating standard deviation
A few errors show up repeatedly, even among people who understand the concept well.
- Using N instead of n − 1 for sample data, which understates variability.
- Confusing standard deviation with standard error. Standard error measures uncertainty in an estimated mean; standard deviation measures spread in the raw data.
- Ignoring outliers. A single extreme value can inflate standard deviation sharply, especially in small data sets.
- Comparing standard deviations across different units or scales without converting to the coefficient of variation first, which leads to misleading conclusions about which data set is “more variable.”
Standard deviation in survey research
Survey and market research work leans on standard deviation constantly. It helps size studies correctly and makes sense of the responses once they’re collected.
Calculating sample size and margin of error
Standard deviation is a direct input into the margin of error formula.
- A higher standard deviation in the underlying population requires a larger sample to hit the same margin of error.
- This relationship drives sample size planning before a study launches, since researchers need to estimate expected variability up front to avoid under- or over-sampling.
Measuring response consistency with Likert-scale data
Once responses are in, standard deviation shows whether a rating question got broadly consistent answers or a split crowd. A satisfaction question averaging 4.2 out of 5 with a tight standard deviation suggests most respondents genuinely agree. The same average paired with a wide standard deviation instead suggests very satisfied and very dissatisfied respondents hiding behind one tidy number.
QuestionPro’s dashboard documentation confirms the platform calculates mean, variance, standard deviation, standard error, and confidence interval automatically for scaled survey questions. Researchers don’t need to export raw data just to run these numbers by hand.
Standard deviation is only useful when you know what to do with it
A standard deviation by itself is just a number. Its value comes from pairing it with the mean, the sample size, and the context of what’s being measured. A 10-point spread means something very different in a 100-point exam than it does on a 5-point satisfaction scale. Whether the goal is sizing investment risk, checking pay equity, or reading survey results, the same questions apply.
- How spread out is the data?
- Is that spread even or lopsided across the data set?
- Does the sample size support drawing a real conclusion from it?
Frequently Asked Questions (FAQs)
There is no universal “good” standard deviation. It depends on the scale of the data and what is being measured. Compare it to the mean using the coefficient of variation to judge whether a data set’s spread counts as high or low.
Standard deviation measures how spread out individual data points are around the mean. Standard error measures how much a sample mean likely differs from the true population mean. Unlike standard deviation, standard error shrinks as sample size grows.
No. Standard deviation is always zero or a positive number. It comes from the square root of squared differences, and squaring removes negative signs. A standard deviation of zero means every value in the data set is identical.
Many analysts flag a value as a potential outlier once it falls more than two to three standard deviations from the mean. This threshold isn’t fixed; it depends on the data’s distribution shape, sample size, and how costly a misclassified value would be.
US researchers use standard deviation to check how consistent survey responses are across regions, demographics, or business units. A national study with a low standard deviation suggests a fairly uniform experience. A high one signals that segments feel very differently about the same brand.