
Correlation is a fundamental concept in statistics and data analysis, helping to understand the relationship between two variables. While strong positive or negative correlations are often highlighted, zero correlation is equally important.
It means there is no linear relationship between the variables. In other words, changes in one variable do not predict changes in the other.
In this blog, we will explore the concept of zero correlation, providing a clear definition, illustrative examples, and methods to determine it.
What is a Zero Correlation?
Zero correlation is a statistical term that describes a situation where there is no linear relationship between two variables. When two variables have zero correlation, changes in one variable do not predict changes in the other. The correlation coefficient, which measures the degree and direction of the relationship between variables, is exactly zero in this case.
Understanding this correlation is important in statistical analysis because it helps identify variables that do not have a predictive relationship with each other, which is crucial when building statistical models or interpreting data patterns.
Why is Zero Correlation important?
Zero correlation is an important concept in statistics and data analysis for several reasons such as:
It Identifies Independence
It helps identify variables that are linearly independent of each other. If two variables have zero correlation, changes in one variable do not provide any information about changes in the other. This is crucial for understanding the structure of the data and the relationships (or lack thereof) between variables.
It Improves Statistical Models
In regression analysis and other statistical models, including variables with this correlation to the dependent variable can add noise and reduce the model’s predictive power. By identifying and excluding such variables, models can be simplified and made more efficient, leading to better performance and interpretability.
This Correlation Helps Avoiding Misinterpretation
Understanding this correlation prevents misinterpretation of data.
- For example, a researcher might mistakenly infer a relationship between two variables based on intuition or initial observations.
Calculating the correlation coefficient and finding it to be zero clarifies that no linear relationship exists, avoiding false conclusions.
It Highlights Non-linear Relationships
It highlights the possibility of non-linear relationships. If two variables have zero correlation, it doesn’t necessarily mean they are unrelated; they might have a complex, non-linear relationship. Recognizing this can prompt further investigation using other methods, such as non-linear regression or data transformations.
Correlation Helps in Guiding Experimental Design
In experimental design, knowing which variables have zero correlation can guide the selection of variables to include or control for. This helps in designing more robust experiments where the influence of irrelevant variables is minimized, leading to clearer, more reliable results.
It Understands Variable Behavior
It provides insights into the behavior of variables in a dataset. In financial analysis, understanding which assets have zero correlation with each other can help in portfolio diversification, as combining such assets can reduce overall risk.
It Supports Hypothesis Testing
In hypothesis testing, this correlation is often a null hypothesis.
- For example, in testing whether two variables are related, the null hypothesis might state that the correlation between them is zero.
Establishing whether this is true or false helps in validating or refuting hypotheses.
What are the Examples of Zero Correlation?
Examples of this correlation, where changes in one variable do not correspond with changes in another variable, can be found across various fields such as:
Field of Research
Example: Number of Scientific Publications and Favorite Ice Cream Flavor
A study investigates the relationship between the number of scientific publications a researcher has and their favorite ice cream flavor.
There is no logical connection between the number of scientific papers a researcher publishes and their preference for a particular ice cream flavor. As a result, these two variables are expected to exhibit this correlation.
Field of Education
Example: Students’ Shoe Size and Their Grades in Mathematics
An educational study examines whether there is any relationship between students’ shoe sizes and their grades in mathematics.
Shoe size is a physical characteristic that has no bearing on a student’s academic performance in mathematics. Therefore, the correlation between shoe size and math grades is likely to be zero.
Field of Healthcare
Example: Blood Type and Incidence of the Common Cold
A healthcare study looks into whether there is a relationship between a person’s blood type and the number of times they catch the common cold in a year.
Blood type is not associated with the frequency of contracting the common cold, which is influenced by various other factors such as exposure to viruses and immune system strength. Hence, the correlation between blood type and the incidence of the common cold is expected to be zero.
How to Identify Zero Correlation?
Here, we’ll explore how to identify this correlation through visual inspection, statistical calculation, hypothesis testing, and contextual analysis.
1. Visual The Inspection Using Scatter Plots
Scatter plots are an effective tool for visually assessing the relationship between two variables.
Create a Scatter Plot:
- Place one variable on the x-axis and the other on the y-axis.
- Look for any discernible trend or pattern in the data points.
Identifying Correlation:
- If the points are scattered randomly with no clear trend (neither upward nor downward), it suggests correlation.
- A random scatter implies that no line (whether straight or curved) can fit the data points well.
Example:
- Students’ Shoe Sizes vs. Math Grades: If you plot shoe sizes against math grades and see a random scatter of points with no trend, this indicates zero correlation.
2. Calculate the Correlation Coefficient
The Pearson correlation coefficient (r) is the most common measure of linear correlation.
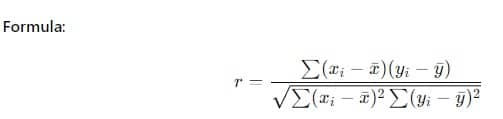
Steps:
- Gather paired data points for the two variables.
- Find the mean (average) of each variable.
- Calculate how far each data point is from the mean.
- Multiply the deviations for each pair and sum the products.
- Use the formula to find the correlation coefficient.
Interpreting Correlation:
Value Close to 0: If 𝑟 r is close to 0, it indicates little to no linear relationship between the variables.
Example:
- Shoe Sizes and Math Grades: If the calculated 𝑟 is approximately 0, it confirms zero correlation.
3. Do The Hypothesis Testing
Statistical hypothesis testing can determine whether an observed correlation coefficient is significantly different from zero.
Steps:
- Null Hypothesis: Assume that the correlation coefficient is zero.
- Alternative Hypothesis: Assume that the correlation coefficient is not zero.
- Compute Test Statistic: Use a t-test for the correlation coefficient.
- Determine p-value: Compare the p-value to a significance level (e.g., 0.05).
Zero Correlation:
- If the p-value is greater than the significance level, do not reject the null hypothesis, suggesting that the correlation is not significantly different from zero.
Example:
- Blood Type and Common Cold Incidence: Testing the correlation between blood type and the incidence of the common cold, if the p-value is high, it indicates that any observed correlation is not statistically significant, supporting zero correlation.
4. Understanding Contextual Analysis
Understanding the context and theoretical background of the variables is essential for interpreting correlation results.
Steps:
- Examine Variables: Consider the nature and expected relationships between the variables.
- Apply Domain Knowledge: Use knowledge from the field to hypothesize whether a relationship is expected.
Zero Correlation:
- If theory and prior research suggest no logical relationship, this supports the finding of this correlation.
Example:
- Blood Type and Common Cold Incidence: Knowing that blood type does not affect susceptibility to the common cold supports the interpretation of zero correlation if found.
Negative vs Positive Correlation vs Zero Correlation
Correlation is a statistical measure that describes the strength and direction of the relationship between two variables. Here’s a detailed explanation of negative, positive, and zero correlation:
Positive Correlation
- Definition: A positive correlation occurs when two variables move in the same direction. As one variable increases, the other variable also increases, and as one decreases, the other also decreases.
- Example: The relationship between height and weight. Generally, as a person’s height increases, their weight also tends to increase.
- Graphical Representation: In a scatter plot, points tend to cluster around a line that slopes upwards from left to right.
Negative Correlation
- Definition: A negative correlation occurs when two variables move in opposite directions. As one variable increases, the other variable decreases, and vice versa.
- Example: The relationship between the amount of time spent studying and the number of errors made on a test. Generally, as the time spent studying increases, the number of errors decreases.
- Graphical Representation: In a scatter plot, points tend to cluster around a line that slopes downwards from left to right.
Zero Correlation
- Definition: It indicates that there is no relationship between the two variables. Changes in one variable do not predict changes in the other variable.
- Example: The relationship between a person’s shoe size and their intelligence quotient (IQ). There is no logical connection between these two variables.
- Graphical Representation: In a scatter plot, points are distributed randomly with no discernible pattern or slope.
How QuestionPro Can Help in Correlation Analysis?
QuestionPro, a robust survey platform, offers comprehensive tools to facilitate correlation analysis effectively. Here’s how QuestionPro can help you in conducting correlation analysis:
Effortless Data Collection
QuestionPro simplifies the data collection process through its user-friendly survey creation tools. You can design and distribute surveys to gather quantitative data on various variables of interest. The platform supports various question types, allowing you to capture detailed and relevant data efficiently.
Automated Data Analysis
Once the data is collected, QuestionPro provides built-in analytics tools for correlation analysis. You can easily calculate correlations, which measure the strength and direction of the linear relationship between two variables. The linear correlation coefficient ranges from -1 to 1, where:
- 1 indicates a perfect positive correlation.
- -1 indicates a perfect negative correlation.
- 0 indicates no correlation.
Visual Representation
QuestionPro offers visualization tools to help you interpret the results of your correlation analysis. Scatter plots and correlation matrices can be generated to provide a clear graphical representation of the relationships between variables. This visual aid is crucial for quickly identifying trends and patterns.
Identifying Patterns and Trends
Using QuestionPro’s correlation analysis, researchers observed correlation ( positive, negative, or zero) between variables:
- Positive Correlation: Both variables move in the same direction. For example, increased advertising spending may correlate with increased sales.
- Negative Correlation: The variables tend to move in opposite directions. For example, increased screen time might correlate with decreased academic performance.
- Zero Correlation: No relationship exists between the variables. For example, the number of years in school might not correlate with the number of letters in a person’s name.
Practical Applications
Correlation analysis in QuestionPro can be used for various practical applications, such as:
- Market Research: Measure the effectiveness of marketing campaigns by correlating advertising spending with sales performance.
- Healthcare: Assess the relationship between medication usage and patient outcomes, such as blood pressure levels.
- Education: Determine the impact of study habits on academic performance by correlating hours studied with grades.
Conclusion
Zero correlation between two variables signifies the absence of a linear relationship, indicating that changes in one variable do not correspond with changes in another. By computing correlation coefficients and visualizing data through scatter plots, researchers can accurately determine whether variables are correlated, positively correlated, negatively correlated, or show this correlation.
Using QuestionPro for correlation analysis in your surveys provides a powerful way to uncover meaningful relationships between variables. By exploring QuestionPro’s intuitive interface, advanced analytical tools, and comprehensive reporting features, you can efficiently conduct correlation analysis and derive valuable insights from your data. Contact QuestionPro today for further information!