• Skip to main content
  • Skip to primary sidebar
  • Skip to footer
QuestionPro

QuestionPro

questionpro logo
  • Products
    survey software iconSurvey softwareEasy to use and accessible for everyone. Design, send and analyze online surveys.research edition iconResearch SuiteA suite of enterprise-grade research tools for market research professionals.CX iconCustomer ExperienceExperiences change the world. Deliver the best with our CX management software.WF iconEmployee ExperienceCreate the best employee experience and act on real-time data from end to end.
  • Solutions
    IndustriesGamingAutomotiveSports and eventsEducationGovernment
    Travel & HospitalityFinancial ServicesHealthcareCannabisTechnology
    Use CaseAskWhyCommunitiesAudienceContactless surveysMobile
    LivePollsMember ExperienceGDPRPositive People Science360 Feedback Surveys
  • Resources
    BlogeBooksSurvey TemplatesCase StudiesTrainingHelp center
  • Features
  • Pricing
Language
  • English
  • Español (Spanish)
  • Português (Portuguese (Brazil))
  • Nederlands (Dutch)
  • العربية (Arabic)
  • Français (French)
  • Italiano (Italian)
  • 日本語 (Japanese)
  • Türkçe (Turkish)
  • Svenska (Swedish)
  • Hebrew IL (Hebrew)
  • ไทย (Thai)
  • Deutsch (German)
  • Portuguese de Portugal (Portuguese (Portugal))
Call Us
+1 800 531 0228 +1 (647) 956-1242 +52 999 402 4079 +49 301 663 5782 +44 20 3650 3166 +81-3-6869-1954 +61 2 8074 5080 +971 529 852 540
Log In Log In
SIGN UP FREE

Home QuestionPro Training

Beyond the bar chart

When analyzing survey responses, it’s easy to stick to the familiar bar charts, pie charts, and line graphs. While those tools are great, there are other tools that you can use to delve deeper into your data for richer insights.

Let’s start with the following terms: mean, confidence interval at 95%, standard deviation, and standard error. These values are all calculated for single choice questions asked in a survey in QuestionPro. You’ll find them at the bottom of the charts for each question.

stats_bottomofchart

What does mean…mean?

The mean is the average value from a group of values. Basically, looking at the mean, you can infer that, on average, people responded with that value.

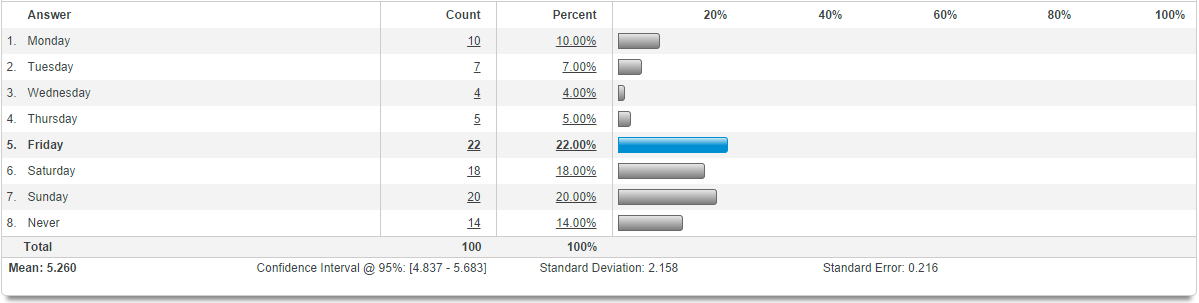
In the example below, the question had to do with what day people would be most likely to attend an event. Because most surveys ask respondents to answer using text-based values instead of numerical values, each answer option was assigned a number: Monday – 1, Tuesday – 2, Wednesday – 3, and so on, through Sunday – 7. This allows us to run calculations while still keeping text values available for our respondents. You’ll see below that the mean was about 5, which was assigned to the answer “Friday.” On average, then, people were most likely to attend a Friday event.

mean_event_day

How confident can I be?

The next value you’ll see is the confidence interval at 95%. This simply means that 95% of the time, we can be certain that respondents’ answers would fall in this range. Going back to the question about what day people would be most likely to attend an event, we see that 95% of the time, respondents’ answers fell between 4.8 and 5.6. When we relate that back to the value for each answer, that lines up to support the average answer of Friday.

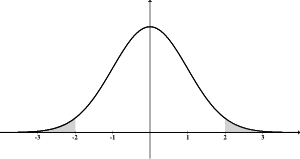
What’s a standard deviation?

Here is where we get into a bit more statistical parlance. Standard deviation has to do with the distribution of answers received. Generally, answers to questions fall on what is referred to as a “normal distribution” curve, or a bell curve. Looking at this curve, we can infer that most answers would fall somewhat close to the average, or mean. The answers that fall on the edges are called outliers.

normal_both_tails_shaded_outside_twos

If you talk to a statistician, you may hear things like, “values within one standard deviation.” If the data gathered followed a normal distribution, or bell curve, this means that about 68% of the values are in this standard deviation. Two standard deviations account for about 95% of the answers. Three standard deviations account for about 99.7% of the answers. Anything outside of the three standard deviations is a definite outlier.

If a standard deviation value is small, it means that about 68% of the answers were really close to the mean, or average answer. If the standard deviation value is large, it means that the answers received were more spread out.

What’s a large or small standard deviation? Well, it depends on the question asked and the values recorded. For the question we’re investigating about event dates, we only had eight options. So, a standard deviation of 2.1 tells us that 68% of the answers to this question were between the values 3.1 and 7.2 (mean plus and minus that standard deviation value). When we look at the values for each answer option, that means about 68% of our responses were between Wednesday and Sunday. If that standard deviation had been smaller, then we could have inferred a time span closer to Friday (say, Thursday through Saturday).

If we had asked a question with a 100-answer question set, a small standard deviation might be 5, while a large standard deviation might be 30.

For our example, we could say that the mean was plus-or-minus the standard deviation. With a standard deviation of 2.1, that’s about two days. So, we would say that our average response was Friday, plus-or-minus two days, which broadens the answers to Wednesday through Sunday. (Note: this shows that answers were pretty spread out!)

Standard Error

The standard error calculated by QuestionPro is the standard error of the mean. This value is a reflection of how accurate our data represents the population we’re studying, and, for those interested in the math behind it, is calculated by dividing the standard deviation by the square root of the sample size. A high standard error means we’re not representing the population very well. A low standard error means we’re representing the population better. The more responses you get to a survey, the more representation you’re getting for the population you’re studying, which, in turn, means the standard error will decrease. In statistical terms, standard error is the standard deviation of the sample mean from the population mean. In plainer terms, it’s how far off our mean that we calculated from the sample we studied is from the mean we would get if we were able to get the entire population to answer the survey. The trick here is that standard error does not deal with the individual values, only the mean.

In our example, the standard error was 0.2. Applied, we could say that the mean was 5.2 plus or minus 0.2. Our sample’s answer was within 0.2 of the population’s answer, if the entire target population for our study had answered the survey.

Summary

Hopefully, this gives you a bit more understanding of means, confidence intervals, standard deviations, and standard errors. The next time you read about or listen to statistics given about a study, pay attention and see if they use these terms!


SHARE THIS ARTICLE:

About the author
Zontziry (Z) Johnson

View all posts by Zontziry (Z) Johnson

Primary Sidebar

Gain insights with 80+ features for free

Create, Send and Analyze Your Online Survey in under 5 mins!

Create a Free Account

RELATED ARTICLES

HubSpot - QuestionPro Integration

Don’t Overpromise — Tuesday CX Thoughts

May 24,2022

HubSpot - QuestionPro Integration

Strategic Vision: Guide for Companies with Examples

Feb 16,2023

HubSpot - QuestionPro Integration

Performance Management: Best Practices + Examples

Oct 15,2022

BROWSE BY CATEGORY

  • Academic
  • Academic Research
  • Artificial Intelligence
  • Assessments
  • Audience
  • Brand Awareness
  • Business
  • Case Studies
  • Communities
  • Consumer Insights
  • Customer effort score
  • Customer Engagement
  • Customer Experience
  • Customer Loyalty
  • Customer Research
  • Customer Satisfaction
  • CX
  • Employee Benefits
  • Employee Engagement
  • Employee Engagement
  • Employee Retention
  • Enterprise
  • Events
  • Forms
  • Friday Five
  • General Data Protection Regulation
  • Guest Post
  • Insights Hub
  • Life@QuestionPro
  • LivePolls
  • Market Research
  • Marketing
  • Mobile
  • Mobile App
  • Mobile diaries
  • Mobile Surveys
  • New Features
  • non-profit
  • NPS
  • Online Communities
  • Polls
  • Question Types
  • Questionnaire
  • QuestionPro
  • QuestionPro Products
  • Release Notes
  • Research Tools and Apps
  • Revenue at Risk
  • Startups
  • Survey Templates
  • Surveys
  • Tech News
  • Tips
  • Training
  • Training Tips
  • Trending
  • Tuesday CX Thoughts (TCXT)
  • Uncategorized
  • VOC
  • Webinar
  • Webinars
  • What’s Coming Up
  • Workforce
  • Workforce Intelligence

Footer

MORE LIKE THIS

data-augmentation

What is Data Augmentation? Methods & Uses in Research

May 22, 2025

livecast a new way to do research

Here’s how LiveCast can help you survive the great Stanley Cup debate of 2025

May 22, 2025

Credit-Unions-NPS-2025

Credit Unions NPS Leading in Loyalty in 2025

May 21, 2025

ken tcxt

Experience – What’s Included? | Tuesday CX Toughts

May 20, 2025

Other categories

  • Academic
  • Academic Research
  • Artificial Intelligence
  • Assessments
  • Audience
  • Brand Awareness
  • Business
  • Case Studies
  • Communities
  • Consumer Insights
  • Customer effort score
  • Customer Engagement
  • Customer Experience
  • Customer Loyalty
  • Customer Research
  • Customer Satisfaction
  • CX
  • Employee Benefits
  • Employee Engagement
  • Employee Engagement
  • Employee Retention
  • Enterprise
  • Events
  • Forms
  • Friday Five
  • General Data Protection Regulation
  • Guest Post
  • Insights Hub
  • Life@QuestionPro
  • LivePolls
  • Market Research
  • Marketing
  • Mobile
  • Mobile App
  • Mobile diaries
  • Mobile Surveys
  • New Features
  • non-profit
  • NPS
  • Online Communities
  • Polls
  • Question Types
  • Questionnaire
  • QuestionPro
  • QuestionPro Products
  • Release Notes
  • Research Tools and Apps
  • Revenue at Risk
  • Startups
  • Survey Templates
  • Surveys
  • Tech News
  • Tips
  • Training
  • Training Tips
  • Trending
  • Tuesday CX Thoughts (TCXT)
  • Uncategorized
  • VOC
  • Webinar
  • Webinars
  • What’s Coming Up
  • Workforce
  • Workforce Intelligence

questionpro-logo-nw
Help center Live Chat SIGN UP FREE
  • Sample questions
  • Sample reports
  • Survey logic
  • Branding
  • Integrations
  • Professional services
  • Security
  • Survey Software
  • Customer Experience
  • Workforce
  • Communities
  • Audience
  • Polls Explore the QuestionPro Poll Software - The World's leading Online Poll Maker & Creator. Create online polls, distribute them using email and multiple other options and start analyzing poll results.
  • Research Edition
  • LivePolls
  • InsightsHub
  • Blog
  • Articles
  • eBooks
  • Survey Templates
  • Case Studies
  • Training
  • Webinars
  • All Plans
  • Nonprofit
  • Academic
  • Qualtrics Alternative Explore the list of features that QuestionPro has compared to Qualtrics and learn how you can get more, for less.
  • SurveyMonkey Alternative
  • VisionCritical Alternative
  • Medallia Alternative
  • Likert Scale Complete Likert Scale Questions, Examples and Surveys for 5, 7 and 9 point scales. Learn everything about Likert Scale with corresponding example for each question and survey demonstrations.
  • Conjoint Analysis
  • Net Promoter Score (NPS) Learn everything about Net Promoter Score (NPS) and the Net Promoter Question. Get a clear view on the universal Net Promoter Score Formula, how to undertake Net Promoter Score Calculation followed by a simple Net Promoter Score Example.
  • Offline Surveys
  • Customer Satisfaction Surveys
  • Employee Survey Software Employee survey software & tool to create, send and analyze employee surveys. Get real-time analysis for employee satisfaction, engagement, work culture and map your employee experience from onboarding to exit!
  • Market Research Survey Software Real-time, automated and advanced market research survey software & tool to create surveys, collect data and analyze results for actionable market insights.
  • GDPR & EU Compliance
  • Employee Experience
  • Customer Journey
  • Synthetic Data
  • About us
  • Executive Team
  • In the news
  • Testimonials
  • Advisory Board
  • Careers
  • Brand
  • Media Kit
  • Contact Us

QuestionPro in your language

  • English
  • Español (Spanish)
  • Português (Portuguese (Brazil))
  • Nederlands (Dutch)
  • العربية (Arabic)
  • Français (French)
  • Italiano (Italian)
  • 日本語 (Japanese)
  • Türkçe (Turkish)
  • Svenska (Swedish)
  • Hebrew IL (Hebrew)
  • ไทย (Thai)
  • Deutsch (German)
  • Portuguese de Portugal (Portuguese (Portugal))

Awards & certificates

  • survey-leader-asia-leader-2023
  • survey-leader-asiapacific-leader-2023
  • survey-leader-enterprise-leader-2023
  • survey-leader-europe-leader-2023
  • survey-leader-latinamerica-leader-2023
  • survey-leader-leader-2023
  • survey-leader-middleeast-leader-2023
  • survey-leader-mid-market-leader-2023
  • survey-leader-small-business-leader-2023
  • survey-leader-unitedkingdom-leader-2023
  • survey-momentumleader-leader-2023
  • bbb-acredited
The Experience Journal

Find innovative ideas about Experience Management from the experts

  • © 2022 QuestionPro Survey Software | +1 (800) 531 0228
  • Sitemap
  • Privacy Statement
  • Terms of Use