• Skip to main content
  • Skip to primary sidebar
  • Skip to footer
QuestionPro

QuestionPro

questionpro logo
  • Products
    survey software iconSurvey softwareEasy to use and accessible for everyone. Design, send and analyze online surveys.research edition iconResearch SuiteA suite of enterprise-grade research tools for market research professionals.CX iconCustomer ExperienceExperiences change the world. Deliver the best with our CX management software.WF iconEmployee ExperienceCreate the best employee experience and act on real-time data from end to end.
  • Solutions
    IndustriesGamingAutomotiveSports and eventsEducationGovernment
    Travel & HospitalityFinancial ServicesHealthcareCannabisTechnology
    Use CaseAskWhyCommunitiesAudienceContactless surveysMobile
    LivePollsMember ExperienceGDPRPositive People Science360 Feedback Surveys
  • Resources
    BlogeBooksSurvey TemplatesCase StudiesTrainingHelp center
  • Features
  • Pricing
Language
  • English
  • Español (Spanish)
  • Português (Portuguese (Brazil))
  • Nederlands (Dutch)
  • العربية (Arabic)
  • Français (French)
  • Italiano (Italian)
  • 日本語 (Japanese)
  • Türkçe (Turkish)
  • Svenska (Swedish)
  • Hebrew IL (Hebrew)
  • ไทย (Thai)
  • Deutsch (German)
  • Portuguese de Portugal (Portuguese (Portugal))
Call Us
+1 800 531 0228 +1 (647) 956-1242 +52 999 402 4079 +49 301 663 5782 +44 20 3650 3166 +81-3-6869-1954 +61 2 8074 5080 +971 529 852 540
Log In Log In
SIGN UP FREE

Home Surveys Academic Research

Understanding Data – How to Make it Mean Something

Understanding Data

We’ve been having a rather intense conversations around decisions and data lately- so imagine my happy surprise when I received this guest article from Nathan Yau, author of Data Points: Visualization That Means Something.  I was thrilled because this article shows the power that context brings to data.  

As you read this, consider how you can use the QuestionPro App to bring patterns and context to light for your own survey data!

By Nathan Yau,
Author of Data Points: Visualization That Means Something

Look up at the night sky, and the stars look like dots on a flat surface. The lack of visual depth makes the translation from sky to paper fairly straightforward, which makes it easier to imagine constellations. Just connect the dots. However, although you perceive stars to be the same distance away from you, they are actually varying light years away.Understanding Data - How to Make it Mean Something

If you could fly out beyond the stars, what would the constellations look like? This is what Santiago Ortiz wondered as he visualized stars from a different perspective, as shown in Figure 1-25.

The initial view places the stars in a global layout, the way you see them. You look at Earth beyond the stars, but as if they were an equal distance away from the planet.

Zoom in, and you can see constellations how you would from the ground, bundled in a sleeping bag in the mountains, staring up at a clear sky.

The perceived view is fun to see, but flip the switch to show actual distance, and it gets interesting. Stars transition, and the easy-to-distinguish constellations are practically unrecognizable. The data looks different from this new angle.

This is what context can do. It can completely change your perspective on a dataset, and it can help you decide what the numbers represent and how to interpret them. After you do know what the data is about, your understanding helps you find the fascinating bits, which leads to worthwhile visualization.
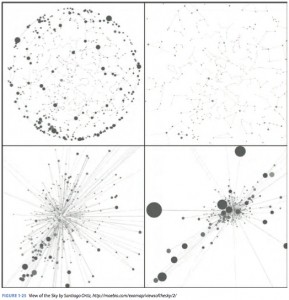
Understanding Data - How to Make it Mean SomethingFigure 1-25

Without context, data is useless, and any visualization you create with it will also be useless. Using data without knowing anything about it, other than the values themselves, is like hearing an abridged quote secondhand and then citing it as a main discussion point in an essay. It might be okay, but you risk finding out later that the speaker meant the opposite of what you thought.

You have to know the who, what, when, where, why, and how — the metadata, or the data about the data — before you can know what the numbers are actually about.

Who: A quote in a major newspaper carries more weight than one from a celebrity gossip site that has a reputation for stretching the truth. Similarly, data from a reputable source typically implies better accuracy than a random online poll.

For example, Gallup, which has measured public opinion since the 1930s, is more reliable than say, someone (for example, me) experimenting with a small, one-off Twitter sample late at night during a short period of time. Whereas the former works to create samples representative of a region, there are unknowns with the latter.

Speaking of which, in addition to who collected the data, who the data is about is also important. Going back to the gumballs, it’s often not financially feasible to collect data about everyone or everything in a population. Most people don’t have time to count and categorize a thousand gumballs, much less a million, so they sample. The key is to sample evenly across the population so that it is representative of the whole. Did the data collectors do that?

How: People often skip methodology because it tends to be complex and for a technical audience, but it’s worth getting to know the gist of how the data of interest was collected.

If you’re the one who collected the data, then you’re good to go, but when you grab a dataset online, provided by someone you’ve never met, how will you know if it’s any good? Do you trust it right away, or do you investigate? You don’t have to know the exact statistical model behind every dataset, but look out for small samples, high margins of error, and unfit         assumptions about the subjects, such as indices or rankings that incorporate spotty or unrelated information.

Sometimes people generate indices to measure the quality of life in countries, and a metric like literacy is used as a factor. However, a country might not have up-to-date information on literacy, so the data gatherer simply uses an estimate from a decade earlier. That’s going to cause problems because then the index works only under the assumption that the literacy rate one decade earlier is comparable to the present, which might not be (and probably isn’t) the case.

What: Ultimately, you want to know what your data is about, but before you can do that, you should know what surrounds the numbers. Talk to subject experts, read papers, and study accompanying documentation.

In introduction statistics courses, you typically learn about analysis methods, such as hypothesis testing, regression analysis, and modeling, in a vacuum, because the goal is to learn the math and concepts. But when you get to real-world data, the goal shifts to information gathering. You shift from, “What is in the numbers?” to “What does the data represent in the world; does it make sense; and how does this relate to other data?”

A major mistake is to treat every dataset the same and use the same canned methods and tools. Don’t do that.

When: Most data is linked to time in some way in that it might be a time series, or it’s a snapshot from a specific period. In both cases, you have to know when the data was collected. An estimate made decades ago does not equate to one in the present. This seems obvious, but it’s a common mistake to take old data and pass it off as new because it’s what’s available. Things change, people change, and places change, and so naturally, data changes.

Where: Things can change across cities, states, and countries just as they do over time. For example, it’s best to avoid global generalizations when the data comes from only a few countries. The same logic applies to digital locations. Data from websites, such as Twitter or Facebook, encapsulates the behavior of its users and doesn’t necessarily translate to the physical world.

Although the gap between digital and physical continues to shrink, the space between is still evident. For example, an animated map that represented the “history of the world” based         on geotagged Wikipedia, showed popping dots for each entry, in a geographic space. The end of the video is shown in Figure 1-26.

The result is impressive, and there is a correlation to the real-life timeline for sure, but it’s clear that because Wikipedia content is more prominent in English-speaking countries the map shows more in those areas than anywhere else.

Why: Finally, you must know the reason data was collected, mostly as a sanity check for bias. Sometimes data is collected, or even fabricated, to serve an agenda, and you should be wary of these cases. Government and elections might be the first thing that come to mind, but so-called information graphics around the web, filled with keywords and published by sites trying to grab Google juice, have also grown up to be a common culprit. (I fell for these a couple of times in my early days of blogging for FlowingData, but I learned my lesson.)

LEARN ABOUT: Speaker evaluation form

Learn all you can about your data before anything else, and your analysis and visualization will be better for it. You can then pass what you know on to readers.

Figure 1-26Understanding Data - How to Make it Mean Something

However, just because you have data doesn’t mean you should make a graphic and share it with the world. Context can help you add a dimension — a layer of information — to your data graphics, but sometimes it means it’s better to hold back because it’s the right thing to do.

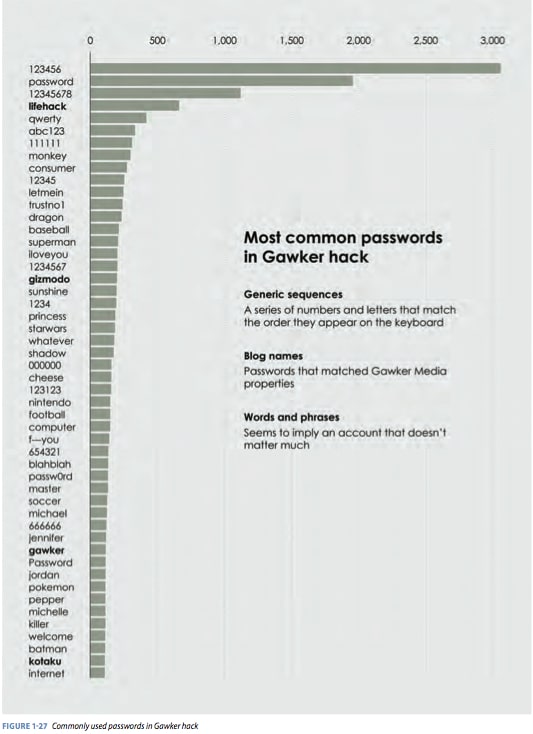
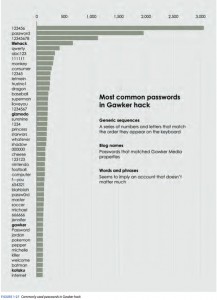
In 2010, Gawker Media, which runs large blogs like Lifehacker and Gizmodo, was hacked, and 1.3 million usernames and passwords were leaked. They were downloadable via BitTorrent. The passwords were encrypted, but the hackers cracked about 188,000 of them, which exposed more than 91,000 unique passwords. What would you do with that kind of data?

The mean thing to do would be to highlight usernames with common (read that poor) passwords, or you could go so far as to create an application that guessed passwords, given a username.

A different route might be to highlight just the common passwords, as shown in Figure 1-27. This offers some insight into the data without making it too easy to log in with someone else’s account. It might also serve as a warning to others to change their passwords to something less obvious. You know, something with at least two symbols, a digit, and a mix of lowercase and uppercase letters. Password rules are ridiculous these days. But I digress.

Figure 1-27

With data like the Gawker set, a deep analysis might be interesting, but it could also do more harm than good. In this case, data privacy is more important, so it’s better to limit what you show and look at.

Understanding Data - How to Make it Mean SomethingWhether you should use data is not always clear-cut though. Sometimes, the split between what’s right and wrong can be gray, so it’s up to you to make the call. For example, on October 22, 2010, Wikileaks, an online organization that releases private documents and media from anonymous sources, released 391,832 United States Army field reports, now known as the Iraq War Logs. The reports recorded 66,081 civilian deaths out of 109,000 recorded deaths, between 2004 and 2009.

The leak exposed incidents of abuse and erroneous reporting, such as civilian deaths classified as “enemy killed in action.” On the other hand, it can seem unjustified to publish findings         about classified data obtained through less than savory means.

Maybe there should be a golden rule for data: Treat others’ data the way you would want your data treated.

In the end, it comes back to what data represents. Data is an abstraction of real life, and real life can be complicated, but if you gather enough context, you can at least put forth a solid effort to make sense of it.

Excerpted with permission from the publisher, Wiley, from Data Points: Visualization That Means Something by Nathan Yau. Copyright © 2013 

Author Bio
Nathan Yau
, author of Data Points: Visualization That Means Something, has a PhD in statistics and is a statistical consultant who helps clients make use of their data through visualization. He created the popular site FlowingData.com, and is the author of Visualize This: The FlowingData Guide to Design, Visualization, and Statistics, also published by Wiley.

For more information please visit http://flowingdata.com, and follow the author on Facebook and Twitter

SHARE THIS ARTICLE:

About the author
Ivana Taylor
Ivana Taylor provides DIY Marketing advice, marketing trends and marketing how-to tips and strategies for small business owners and CEOs.
View all posts by Ivana Taylor

Reader Interactions

Trackbacks

  1. Top QuestionPro Market Research Topics of 2013 | QuestionPro Blog says:
    Dec 30, 2013 at 6:00 am

    […] How to Understand Your Data […]

  2. URL says:
    Jan 26, 2024 at 8:04 am

    … [Trackback]

    […] There you will find 12500 more Infos: questionpro.com/blog/understanding-data-context/ […]

  3. ruby carts says:
    Apr 29, 2024 at 3:06 am

    … [Trackback]

    […] Info to that Topic: questionpro.com/blog/understanding-data-context/ […]

  4. mail order Psilocybin mushroom Jefferson County Washington says:
    Apr 30, 2024 at 7:52 pm

    … [Trackback]

    […] Here you will find 65678 additional Information to that Topic: questionpro.com/blog/understanding-data-context/ […]

  5. ตกแต่งภายในหาดใหญ่ says:
    Jun 8, 2024 at 5:20 pm

    … [Trackback]

    […] Information on that Topic: questionpro.com/blog/understanding-data-context/ […]

  6. Majestic Explorer says:
    Jun 16, 2024 at 2:09 am

    … [Trackback]

    […] Info on that Topic: questionpro.com/blog/understanding-data-context/ […]

  7. สล็อตเว็บตรง says:
    Jul 6, 2024 at 5:37 pm

    … [Trackback]

    […] Find More on that Topic: questionpro.com/blog/understanding-data-context/ […]

  8. Thai Massage says:
    Jul 10, 2024 at 3:35 pm

    … [Trackback]

    […] Read More on that Topic: questionpro.com/blog/understanding-data-context/ […]

  9. Whore Parody Movie Transsex Sex Movie cuck-old sex voucher My site: anal pussy vouchers transgender Feet Fetish Latina Anal sex Shaved Pussy Medium Tits Small Tits voucher Brunette Mature MILF discount code Anal Sex porn Lesbian vouchers Threesome Promote says:
    Aug 18, 2024 at 9:00 pm

    … [Trackback]

    […] Info on that Topic: questionpro.com/blog/understanding-data-context/ […]

  10. cookies disposable vape pen 1g says:
    Sep 10, 2024 at 11:16 pm

    … [Trackback]

    […] Information to that Topic: questionpro.com/blog/understanding-data-context/ […]

  11. Morpheus8 says:
    Sep 16, 2024 at 10:05 pm

    … [Trackback]

    […] Find More on on that Topic: questionpro.com/blog/understanding-data-context/ […]

  12. dogen meme says:
    Sep 18, 2024 at 3:18 pm

    … [Trackback]

    […] Here you will find 32740 more Information on that Topic: questionpro.com/blog/understanding-data-context/ […]

  13. Morpheus8 says:
    Sep 20, 2024 at 4:00 am

    … [Trackback]

    […] Find More to that Topic: questionpro.com/blog/understanding-data-context/ […]

  14. ร้านทำเล็บเจลใกล้ฉัน says:
    Sep 20, 2024 at 8:05 am

    … [Trackback]

    […] Find More on that Topic: questionpro.com/blog/understanding-data-context/ […]

  15. สกายวินด์มีอะไรให้เล่นบ้าง says:
    Sep 22, 2024 at 4:47 am

    … [Trackback]

    […] Find More Info here on that Topic: questionpro.com/blog/understanding-data-context/ […]

  16. White Label Payment Services says:
    Sep 22, 2024 at 3:38 pm

    … [Trackback]

    […] Read More to that Topic: questionpro.com/blog/understanding-data-context/ […]

  17. Browning shotguns says:
    Sep 22, 2024 at 3:59 pm

    … [Trackback]

    […] Read More to that Topic: questionpro.com/blog/understanding-data-context/ […]

  18. fk brno 7.5 says:
    Sep 22, 2024 at 4:08 pm

    … [Trackback]

    […] Find More on on that Topic: questionpro.com/blog/understanding-data-context/ […]

  19. Winchester firearms for sale says:
    Sep 22, 2024 at 4:35 pm

    … [Trackback]

    […] Info on that Topic: questionpro.com/blog/understanding-data-context/ […]

  20. bcm upper for sale says:
    Sep 23, 2024 at 5:49 am

    … [Trackback]

    […] Read More on that Topic: questionpro.com/blog/understanding-data-context/ […]

  21. ซื้อทราย หาดใหญ่ says:
    Sep 24, 2024 at 3:40 pm

    … [Trackback]

    […] Read More on to that Topic: questionpro.com/blog/understanding-data-context/ […]

  22. Bundle extractor says:
    Sep 24, 2024 at 10:39 pm

    … [Trackback]

    […] Here you will find 23114 more Information on that Topic: questionpro.com/blog/understanding-data-context/ […]

  23. สล็oต pg เว็บตรงแตกหนัก says:
    Sep 25, 2024 at 3:57 pm

    … [Trackback]

    […] Read More here on that Topic: questionpro.com/blog/understanding-data-context/ […]

  24. bundle extractor says:
    Sep 26, 2024 at 6:05 pm

    … [Trackback]

    […] Read More on on that Topic: questionpro.com/blog/understanding-data-context/ […]

  25. zircuit dex says:
    Sep 28, 2024 at 3:21 pm

    … [Trackback]

    […] Here you will find 43515 additional Information on that Topic: questionpro.com/blog/understanding-data-context/ […]

  26. Microdose Purecybin Microdose says:
    Oct 9, 2024 at 5:30 pm

    … [Trackback]

    […] Info on that Topic: questionpro.com/blog/understanding-data-context/ […]

  27. Volnewmer says:
    Oct 12, 2024 at 2:56 am

    … [Trackback]

    […] Info on that Topic: questionpro.com/blog/understanding-data-context/ […]

  28. wps office says:
    Oct 12, 2024 at 12:45 pm

    … [Trackback]

    […] Info to that Topic: questionpro.com/blog/understanding-data-context/ […]

  29. ต่อผมแท้ says:
    Oct 12, 2024 at 3:53 pm

    … [Trackback]

    […] Find More Info here to that Topic: questionpro.com/blog/understanding-data-context/ […]

  30. เช่ารถตู้พร้อมคนขับ says:
    Oct 12, 2024 at 4:03 pm

    … [Trackback]

    […] Find More on on that Topic: questionpro.com/blog/understanding-data-context/ […]

  31. arena breakout infinite hacks says:
    Oct 14, 2024 at 10:40 am

    … [Trackback]

    […] Read More to that Topic: questionpro.com/blog/understanding-data-context/ […]

  32. ufa191 says:
    Oct 19, 2024 at 10:53 pm

    … [Trackback]

    […] Read More here to that Topic: questionpro.com/blog/understanding-data-context/ […]

  33. Iraq says:
    Oct 20, 2024 at 1:35 am

    … [Trackback]

    […] Find More Info here to that Topic: questionpro.com/blog/understanding-data-context/ […]

  34. llucabet says:
    Oct 21, 2024 at 8:43 pm

    … [Trackback]

    […] Read More to that Topic: questionpro.com/blog/understanding-data-context/ […]

  35. คาสิโนออนไลน์ sagame says:
    Oct 22, 2024 at 3:24 pm

    … [Trackback]

    […] Find More to that Topic: questionpro.com/blog/understanding-data-context/ […]

  36. บริการรับสร้างบ้าน says:
    Oct 24, 2024 at 5:04 pm

    … [Trackback]

    […] Find More on that Topic: questionpro.com/blog/understanding-data-context/ […]

  37. lucabet เว็บตรง says:
    Oct 26, 2024 at 4:00 pm

    … [Trackback]

    […] Find More Information here to that Topic: questionpro.com/blog/understanding-data-context/ […]

  38. Koh Tao Scuba Club says:
    Oct 26, 2024 at 8:04 pm

    … [Trackback]

    […] Find More to that Topic: questionpro.com/blog/understanding-data-context/ […]

  39. อาหารเสริม omg says:
    Oct 28, 2024 at 5:36 pm

    … [Trackback]

    […] Find More to that Topic: questionpro.com/blog/understanding-data-context/ […]

  40. Choi game says:
    Oct 29, 2024 at 4:30 pm

    … [Trackback]

    […] Here you can find 68225 more Info on that Topic: questionpro.com/blog/understanding-data-context/ […]

  41. สล็oต PG says:
    Nov 2, 2024 at 4:51 pm

    … [Trackback]

    […] Find More Info here on that Topic: questionpro.com/blog/understanding-data-context/ […]

  42. Miljövänlig skrotning av en Bugatti says:
    Nov 6, 2024 at 12:29 pm

    … [Trackback]

    […] Read More on on that Topic: questionpro.com/blog/understanding-data-context/ […]

  43. Miljövänlig skrotning av en Ford says:
    Nov 6, 2024 at 3:36 pm

    … [Trackback]

    […] Read More on that Topic: questionpro.com/blog/understanding-data-context/ […]

  44. som777 says:
    Nov 11, 2024 at 5:29 pm

    … [Trackback]

    […] Here you can find 52915 more Information on that Topic: questionpro.com/blog/understanding-data-context/ […]

  45. hit789 says:
    Nov 11, 2024 at 6:17 pm

    … [Trackback]

    […] Find More Info here on that Topic: questionpro.com/blog/understanding-data-context/ […]

  46. pk789 says:
    Nov 12, 2024 at 9:06 am

    … [Trackback]

    […] Read More Information here to that Topic: questionpro.com/blog/understanding-data-context/ […]

  47. rohypnol achat says:
    Nov 12, 2024 at 7:53 pm

    … [Trackback]

    […] Find More Info here on that Topic: questionpro.com/blog/understanding-data-context/ […]

Primary Sidebar

Gain insights with 80+ features for free

Create, Send and Analyze Your Online Survey in under 5 mins!

Create a Free Account

RELATED ARTICLES

HubSpot - QuestionPro Integration

Wufoo vs Google Forms: Best Survey and + Form Builder

Sep 25,2024

HubSpot - QuestionPro Integration

Research Skills: What they are and Benefits

May 26,2022

HubSpot - QuestionPro Integration

Release Notes September 2022

Sep 30,2022

BROWSE BY CATEGORY

  • Academic
  • Academic Research
  • Artificial Intelligence
  • Assessments
  • Audience
  • Brand Awareness
  • Business
  • Case Studies
  • Communities
  • Consumer Insights
  • Customer effort score
  • Customer Engagement
  • Customer Experience
  • Customer Loyalty
  • Customer Research
  • Customer Satisfaction
  • CX
  • Employee Benefits
  • Employee Engagement
  • Employee Engagement
  • Employee Retention
  • Enterprise
  • Events
  • Forms
  • Friday Five
  • General Data Protection Regulation
  • Guest Post
  • Insights Hub
  • Life@QuestionPro
  • LivePolls
  • Market Research
  • Marketing
  • Mobile
  • Mobile App
  • Mobile diaries
  • Mobile Surveys
  • New Features
  • non-profit
  • NPS
  • Online Communities
  • Polls
  • Question Types
  • Questionnaire
  • QuestionPro
  • QuestionPro Products
  • Release Notes
  • Research Tools and Apps
  • Revenue at Risk
  • Startups
  • Survey Templates
  • Surveys
  • Tech News
  • Tips
  • Training
  • Training Tips
  • Trending
  • Tuesday CX Thoughts (TCXT)
  • Uncategorized
  • VOC
  • Webinar
  • Webinars
  • What’s Coming Up
  • Workforce
  • Workforce Intelligence

Footer

MORE LIKE THIS

data-augmentation

What is Data Augmentation? Methods & Uses in Research

May 22, 2025

livecast a new way to do research

Here’s how LiveCast can help you survive the great Stanley Cup debate of 2025

May 22, 2025

Credit-Unions-NPS-2025

Credit Unions NPS Leading in Loyalty in 2025

May 21, 2025

ken tcxt

Experience – What’s Included? | Tuesday CX Toughts

May 20, 2025

Other categories

  • Academic
  • Academic Research
  • Artificial Intelligence
  • Assessments
  • Audience
  • Brand Awareness
  • Business
  • Case Studies
  • Communities
  • Consumer Insights
  • Customer effort score
  • Customer Engagement
  • Customer Experience
  • Customer Loyalty
  • Customer Research
  • Customer Satisfaction
  • CX
  • Employee Benefits
  • Employee Engagement
  • Employee Engagement
  • Employee Retention
  • Enterprise
  • Events
  • Forms
  • Friday Five
  • General Data Protection Regulation
  • Guest Post
  • Insights Hub
  • Life@QuestionPro
  • LivePolls
  • Market Research
  • Marketing
  • Mobile
  • Mobile App
  • Mobile diaries
  • Mobile Surveys
  • New Features
  • non-profit
  • NPS
  • Online Communities
  • Polls
  • Question Types
  • Questionnaire
  • QuestionPro
  • QuestionPro Products
  • Release Notes
  • Research Tools and Apps
  • Revenue at Risk
  • Startups
  • Survey Templates
  • Surveys
  • Tech News
  • Tips
  • Training
  • Training Tips
  • Trending
  • Tuesday CX Thoughts (TCXT)
  • Uncategorized
  • VOC
  • Webinar
  • Webinars
  • What’s Coming Up
  • Workforce
  • Workforce Intelligence

questionpro-logo-nw
Help center Live Chat SIGN UP FREE
  • Sample questions
  • Sample reports
  • Survey logic
  • Branding
  • Integrations
  • Professional services
  • Security
  • Survey Software
  • Customer Experience
  • Workforce
  • Communities
  • Audience
  • Polls Explore the QuestionPro Poll Software - The World's leading Online Poll Maker & Creator. Create online polls, distribute them using email and multiple other options and start analyzing poll results.
  • Research Edition
  • LivePolls
  • InsightsHub
  • Blog
  • Articles
  • eBooks
  • Survey Templates
  • Case Studies
  • Training
  • Webinars
  • All Plans
  • Nonprofit
  • Academic
  • Qualtrics Alternative Explore the list of features that QuestionPro has compared to Qualtrics and learn how you can get more, for less.
  • SurveyMonkey Alternative
  • VisionCritical Alternative
  • Medallia Alternative
  • Likert Scale Complete Likert Scale Questions, Examples and Surveys for 5, 7 and 9 point scales. Learn everything about Likert Scale with corresponding example for each question and survey demonstrations.
  • Conjoint Analysis
  • Net Promoter Score (NPS) Learn everything about Net Promoter Score (NPS) and the Net Promoter Question. Get a clear view on the universal Net Promoter Score Formula, how to undertake Net Promoter Score Calculation followed by a simple Net Promoter Score Example.
  • Offline Surveys
  • Customer Satisfaction Surveys
  • Employee Survey Software Employee survey software & tool to create, send and analyze employee surveys. Get real-time analysis for employee satisfaction, engagement, work culture and map your employee experience from onboarding to exit!
  • Market Research Survey Software Real-time, automated and advanced market research survey software & tool to create surveys, collect data and analyze results for actionable market insights.
  • GDPR & EU Compliance
  • Employee Experience
  • Customer Journey
  • Synthetic Data
  • About us
  • Executive Team
  • In the news
  • Testimonials
  • Advisory Board
  • Careers
  • Brand
  • Media Kit
  • Contact Us

QuestionPro in your language

  • English
  • Español (Spanish)
  • Português (Portuguese (Brazil))
  • Nederlands (Dutch)
  • العربية (Arabic)
  • Français (French)
  • Italiano (Italian)
  • 日本語 (Japanese)
  • Türkçe (Turkish)
  • Svenska (Swedish)
  • Hebrew IL (Hebrew)
  • ไทย (Thai)
  • Deutsch (German)
  • Portuguese de Portugal (Portuguese (Portugal))

Awards & certificates

  • survey-leader-asia-leader-2023
  • survey-leader-asiapacific-leader-2023
  • survey-leader-enterprise-leader-2023
  • survey-leader-europe-leader-2023
  • survey-leader-latinamerica-leader-2023
  • survey-leader-leader-2023
  • survey-leader-middleeast-leader-2023
  • survey-leader-mid-market-leader-2023
  • survey-leader-small-business-leader-2023
  • survey-leader-unitedkingdom-leader-2023
  • survey-momentumleader-leader-2023
  • bbb-acredited
The Experience Journal

Find innovative ideas about Experience Management from the experts

  • © 2022 QuestionPro Survey Software | +1 (800) 531 0228
  • Sitemap
  • Privacy Statement
  • Terms of Use