




Airline NPS score benchmarks reveal a blunt truth about air travel. Passengers forgive a delayed flight far more easily than they forgive being ignored. Net Promoter Score (NPS) is the single-question metric that shows how many customers would recommend an airline, versus warn friends away. Switching carriers takes one click today, so that gap shapes revenue more than almost any other number airlines track.
Ticket prices, baggage fees, and delays make headlines every year. Yet some carriers still turn frustrated travelers into repeat customers, while others watch satisfied fliers quietly book elsewhere next time.
In this article, we’ll explore the latest airline NPS score benchmarks by carrier. It also compares them against a broader 2026 satisfaction study and covers how airlines can turn that data into a loyalty strategy.
What Is Net Promoter Score (NPS)?
Net Promoter Score (NPS) is a single-question survey metric, scored from -100 to 100. It measures how likely customers are to recommend a company to someone else.
Airlines typically ask it right after a flight, a booking, or a customer service call. The question is simple: “On a scale of 0 to 10, how likely are you to recommend us to a friend or colleague?” The answer sorts every passenger into one of three groups.
- Promoters (9-10): Enthusiastic passengers who actively recommend the airline to others.
- Passives (7-8): Satisfied but unenthusiastic flyers who could switch carriers without much friction.
- Detractors (0-6): Unhappy passengers who may discourage others from booking.
To calculate NPS, subtract the percentage of Detractors from the percentage of Promoters:
NPS = % Promoters − % Detractors
A score of 50 means half of surveyed passengers are net advocates once detractors are subtracted out. There’s no universal “perfect” score. But the formula makes it easy to track movement over time and compare carriers on equal footing.
NPS vs. CSAT: Two Metrics Airlines Often Confuse
NPS and Customer Satisfaction Score (CSAT) measure different things. Mixing them up leads airlines to misread their own data.
CSAT asks how satisfied a passenger was with one specific interaction, like check-in or boarding. NPS asks about overall willingness to recommend the airline as a whole. An airline can score well on CSAT for a smooth boarding experience. It can still post a mediocre NPS if passengers don’t trust the brand enough to vouch for it elsewhere.
| Metric | What it measures | Typical scale | Best used for |
|---|---|---|---|
| NPS | Overall loyalty and likelihood to recommend | -100 to 100 | Tracking brand-level loyalty over time |
| CSAT | Satisfaction with one specific touchpoint | 1-5 or percentage | Diagnosing a single step in the journey |
| JD Power satisfaction index | Weighted satisfaction across 7 service dimensions | 1 to 1,000 | Benchmarking detailed service quality against competitors |
Airlines that rely on only one of these metrics tend to miss half the picture. A strong CSAT after check-in doesn’t guarantee a passenger will recommend the airline. If the in-flight experience or baggage handling falls short later, NPS still drops.
What Counts as a Good Airline NPS Score in 2026?
A good NPS score for an airline currently sits at or above 33, the industry average. Anything above 50 is considered excellent for the sector.
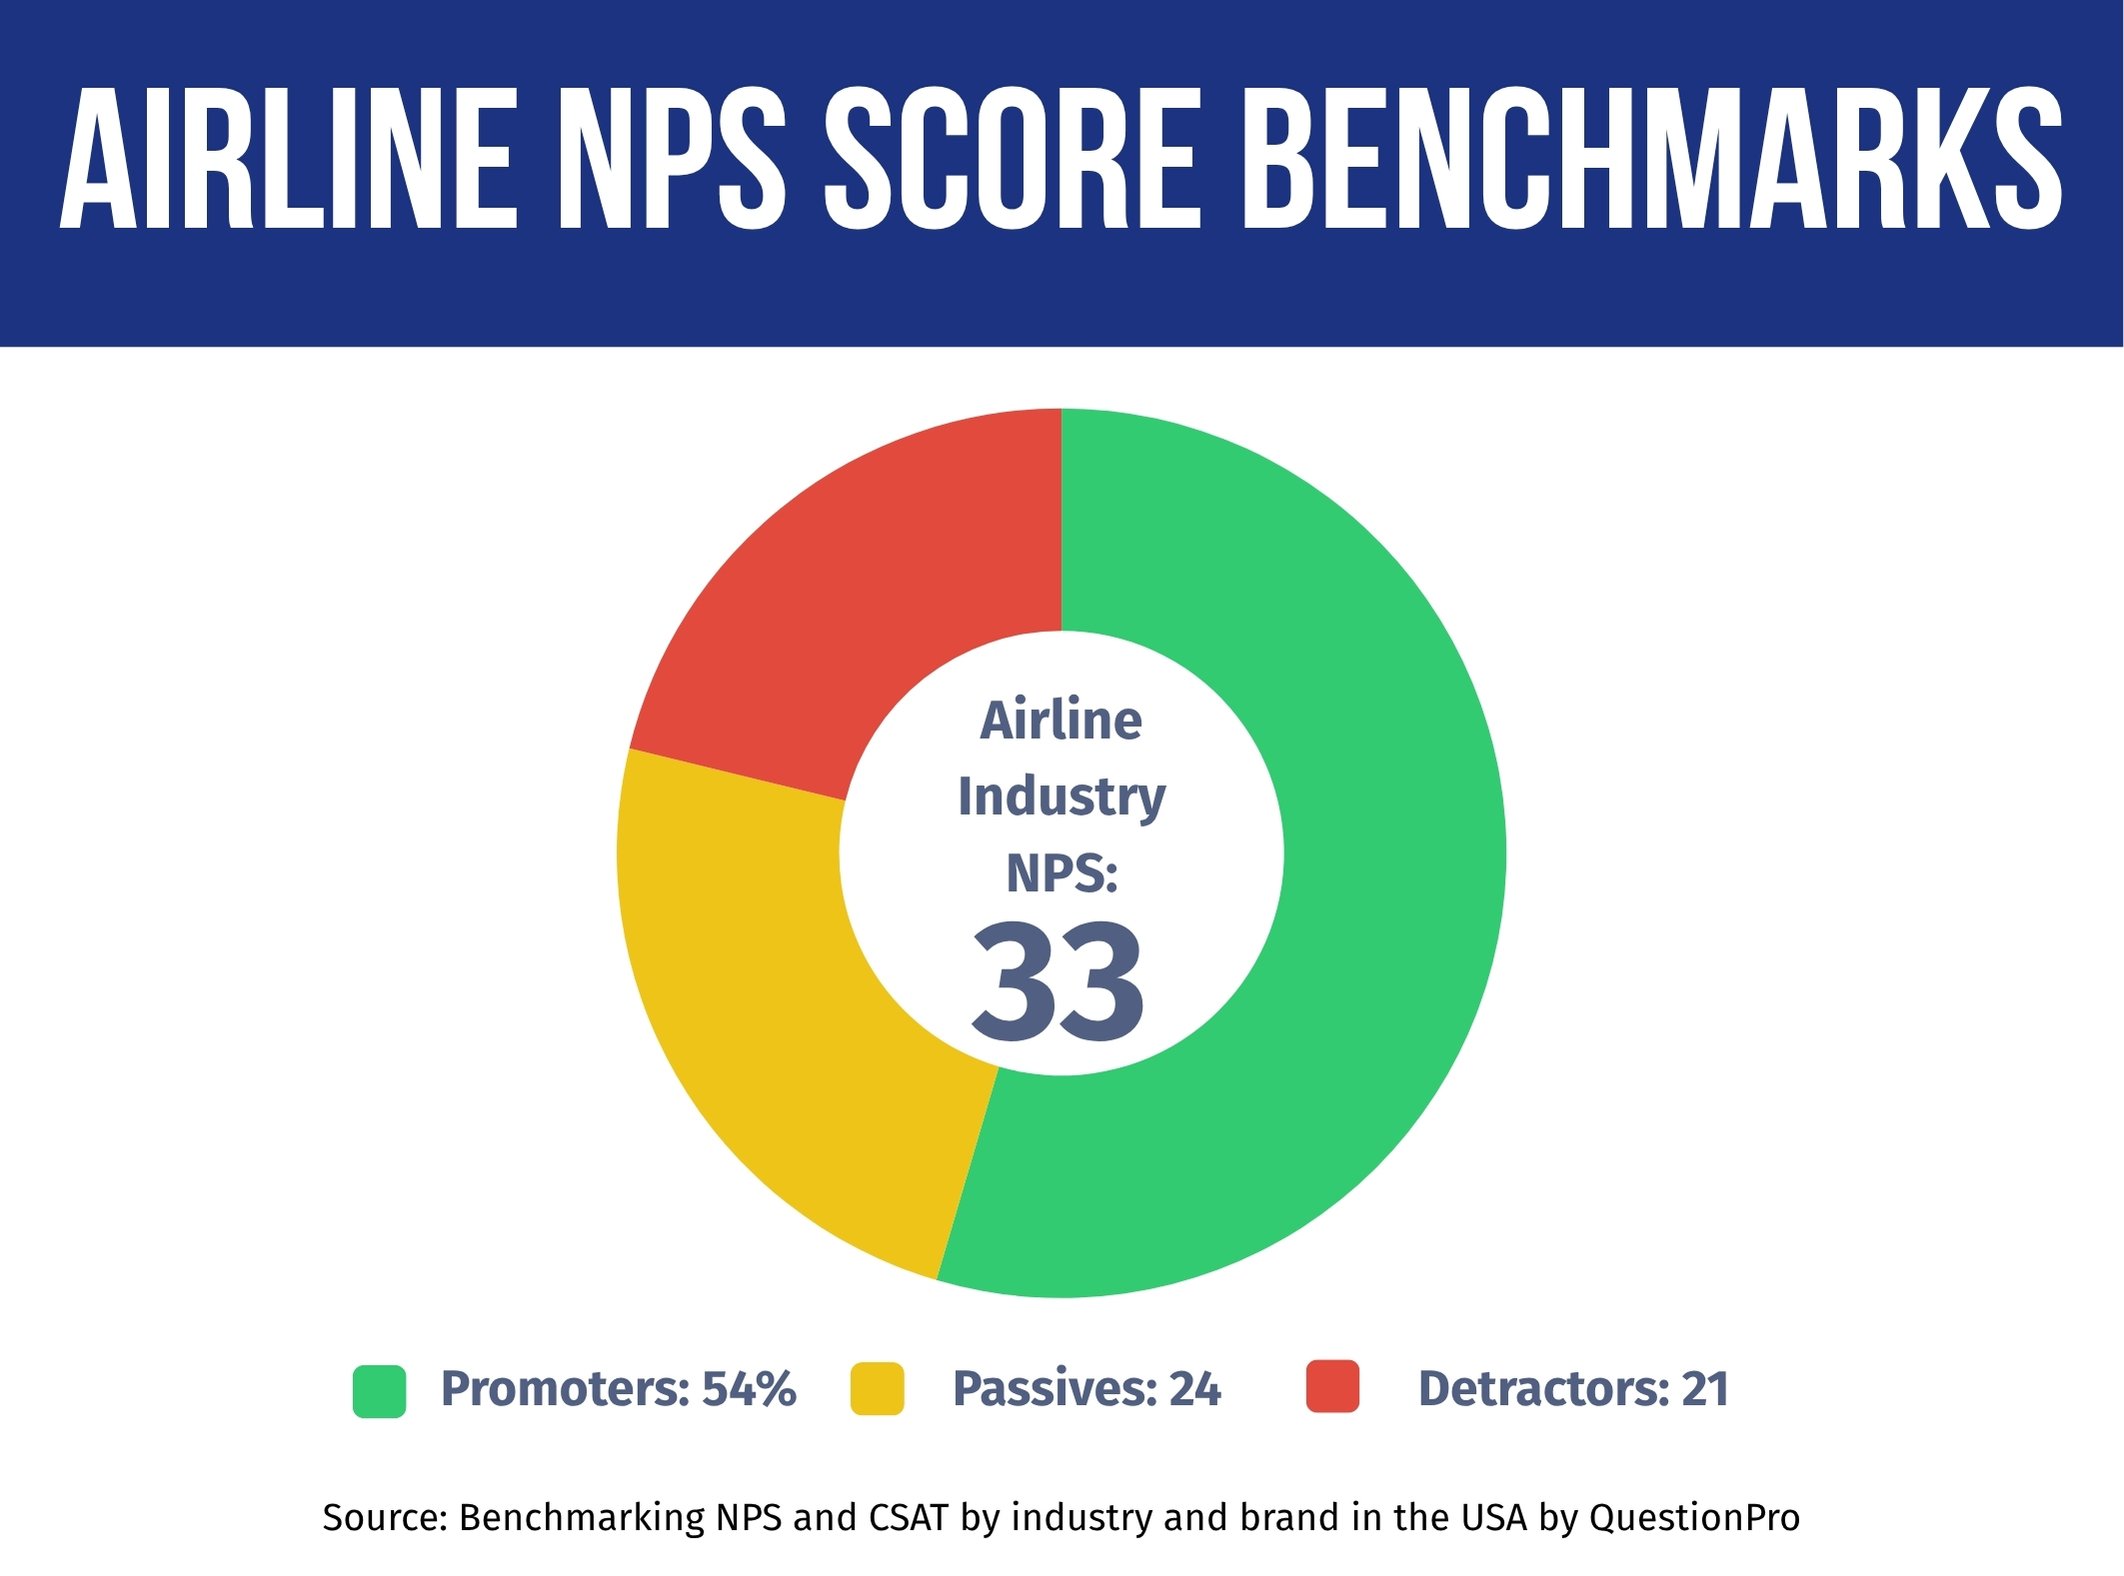
According to QuestionPro’s Q1 2025 Benchmarking NPS and CSAT Report, the airline industry posted an average NPS of 33 among seven U.S. industries studied. That places airlines in the middle of the pack:
- Hotel & Hospitality: 44 NPS
- Banking & Credit Unions: 41 NPS
- Automotive: 41 NPS
- Big Box Retail: 37 NPS
- Grocery Retail: 37 NPS
- Airlines: 33 NPS
- Insurance: 23 NPS
Here’s how to interpret an airline NPS score in practice. Above 50 is excellent, meaning passengers are strong brand advocates. A score of 30 to 50 is good, meaning most passengers are satisfied and willing to recommend the airline. From 0 to 30 is acceptable, meaning experiences are inconsistent and improvement is needed. Below 0 is poor, meaning detractors outnumber promoters.
At 33, airlines sit in the “good” range. But the gap between top and bottom carriers shows that average doesn’t mean uniform.
Airline NPS Score Benchmarks by Carrier: Who’s Winning in 2026
JetBlue Airways leads major U.S. carriers with an NPS of 50. United Airlines trails at 25, a 25-point gap that reflects real differences in service consistency and passenger trust.
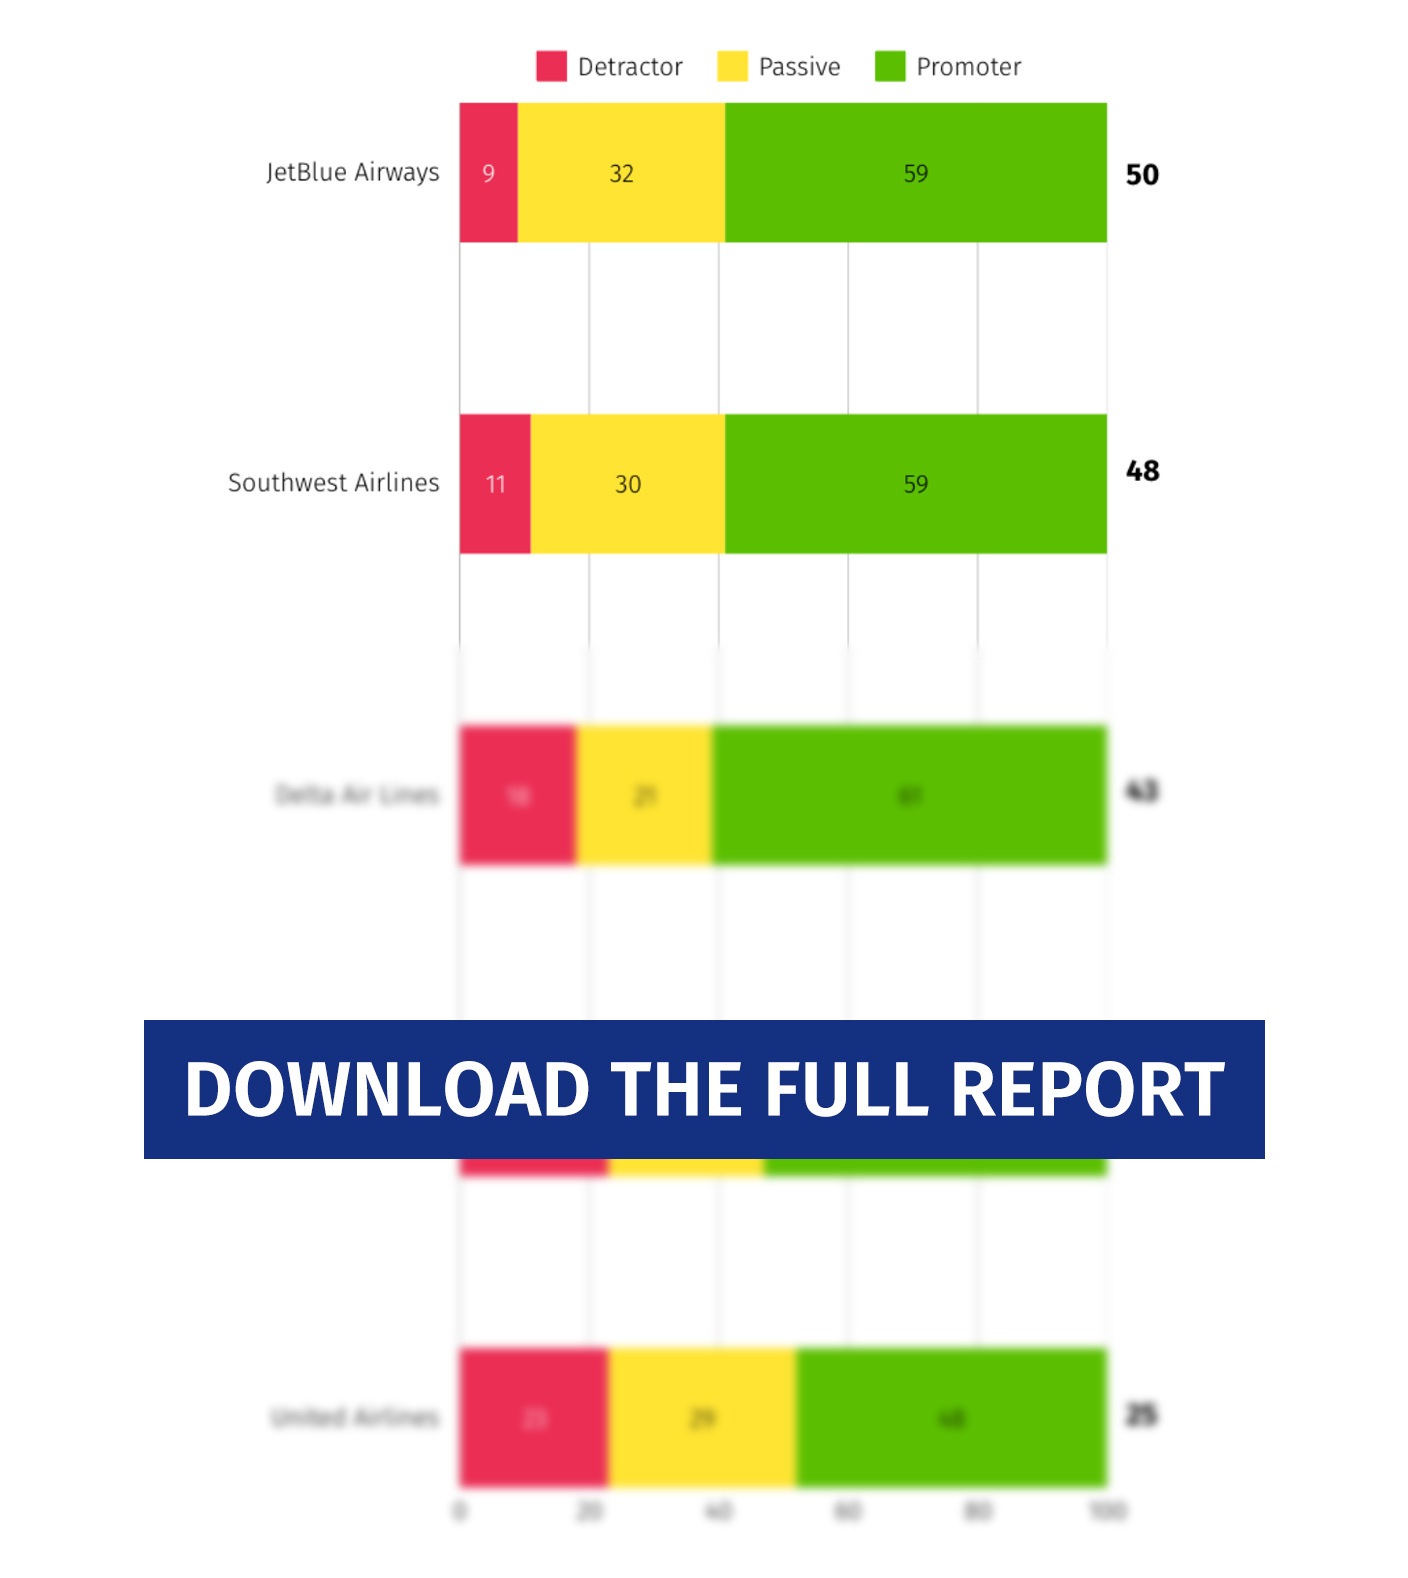
These figures come from QuestionPro’s Q1 2025 Benchmarking NPS and CSAT Report, based on 1,000 surveyed passengers across leading airline brands. They remain the most recent airline-specific NPS breakdown available from the study.
| Airline | NPS score | vs. industry average (33) |
|---|---|---|
| JetBlue Airways | 50 | +17 |
| Southwest Airlines | 48 | +15 |
| Delta Air Lines | 43 | +10 |
| American Airlines | 30 | -3 |
| United Airlines | 25 | -8 |
JetBlue’s lead comes with a passenger sentiment split of roughly 68% promoters and only 10% detractors. Generous legroom, free in-flight entertainment, and complimentary snacks all play a role. United sits at the opposite end. Its higher share of detractors ties back to inconsistent service recovery after delays and cancellations.
A broader benchmark adds useful context here. J.D. Power’s 2026 North America Airline Satisfaction Study surveyed nearly 11,000 passengers. It ranked Southwest Airlines highest in the economy segment, with Delta second and JetBlue third, on a 1,000-point satisfaction scale rather than NPS. The two studies measure different things: satisfaction with a single flight versus willingness to recommend the brand overall. That’s exactly why airlines benefit from tracking both.
What Separates High-NPS Airlines from Low-NPS Airlines
The airlines with the highest NPS scores share three habits: consistent service culture, transparent policies, and a comfortable in-flight experience.
Customer-centric service culture
JetBlue and Southwest consistently train staff to handle friction calmly. A late boarding call or a missed connection gets handled the same way every time. Passengers remember two things most:
- How a problem got resolved, not just whether one happened.
- Whether staff treated them as a person or a ticket number.
Transparent and flexible policies
Top performers avoid surprise fees. They make change or cancellation policies easy to understand upfront, which builds trust before a passenger ever needs to use them.
- Southwest’s free checked bags and no change fees remove a major source of frustration.
- Clear, upfront pricing prevents the “gotcha” moment that quietly creates detractors.
- Predictable rebooking policies during disruptions keep frustrated passengers from becoming vocal critics.
Comfortable and consistent in-flight experience
Extra legroom, free entertainment, and reliable Wi-Fi contribute to promoter behavior. But that only holds true when paired with on-time performance:
- Comfort without reliability rarely moves NPS on its own.
- Reliability without comfort caps how high a score can climb.
Common Mistakes That Drag Down Airline NPS
Airlines with weaker NPS scores tend to repeat the same three mistakes. Each one is fixable with the right measurement in place.
Treating scale as an excuse for inconsistency
As airlines grow their fleets and routes, service quality gets harder to standardize. A handful of poorly handled flights can quietly pull down an otherwise strong score. Common warning signs include:
- One hub or region consistently scoring below the fleet average.
- No system flagging which crews or routes need support.
Under-investing in disruption recovery
Weather delays, mechanical issues, and cancellations are unavoidable. How an airline communicates during them is not. Carriers that lag on NPS, like United, often face a longer trust-rebuilding process.
- Slow or vague communication during disruptions increases detractor rates fast.
- Lack of proactive rebooking options forces passengers to solve problems themselves.
- No follow-up after a bad experience means a fixable detractor stays lost.
Letting technology replace service instead of supporting it
Mobile check-in, live flight updates, and automated chat support are now standard. They frustrate passengers when they replace human help instead of speeding it up. A few signs technology is working against passengers:
- Chatbots with no clear path to a live agent during disruptions.
- App notifications that arrive after the passenger already missed the gate change.
How to Measure and Improve Your Airline’s NPS
Airlines improve NPS by surveying passengers at key touchpoints, segmenting the results, and closing the loop with detractors before they churn.
- Survey at the moments that matter most.
Send NPS surveys after booking, after landing, and after any customer service interaction. Skip the single generic survey sent months later. - Collect enough responses to trust the number.
Aim for at least a few hundred responses per route or segment each quarter. Smaller samples swing wildly and can mask real problems. - Segment by route, cabin, and flyer status.
A strong overall NPS can hide a struggling regional route or a weak economy cabin experience. - Prioritize the touchpoint with the most detractors first.
Fixing the single biggest friction point moves the score faster than spreading effort evenly across everything. - Close the loop with detractors.
A follow-up call or email after a poor experience can turn a one-time detractor into a returning passenger.
Tools like QuestionPro Customer Experience support this kind of tracking. The platform collects feedback across booking, in-flight, and post-flight touchpoints, then flags detractor patterns before they show up as a falling quarterly score. For a quick, one-off calculation, the QuestionPro NPS Calculator turns raw promoter, passive, and detractor counts into a score in seconds. That’s useful for spot-checking a single survey without setting up a full tracking program.
Where Airline Loyalty Is Headed in 2026
The 25-point spread between JetBlue and United shows that airline NPS isn’t decided by ticket price or route map. It comes down to whether passengers trust the airline when something goes wrong.
Airlines closing that gap in 2026 treat NPS as an operational signal, not just a scorecard. They segment feedback by route and cabin. Disruptions get met with real communication instead of silence. Comfort and reliability work together in these carriers, rather than one compensating for the other. That combination, more than any single perk or policy, turns a satisfied passenger into a repeat one.
Frequently Asked Questions (FAQs)
A good airline NPS score sits at or above 33, the current U.S. industry average. Scores above 50 are considered excellent, while anything below 0 signals passengers actively discourage others from booking with that carrier.
NPS measures whether a passenger would recommend the airline overall, scored from -100 to 100. JD Power’s satisfaction index measures detailed service quality across seven dimensions on a 1,000-point scale, so the two can rank airlines differently.
JetBlue Airways currently leads major U.S. carriers with an NPS of 50, according to QuestionPro’s Q1 2025 Benchmarking NPS and CSAT Report. Comfort, free entertainment, and low detractor rates drive most of that lead.
Airlines get the most value from measuring NPS quarterly at a minimum. Layer ongoing surveys at key touchpoints, like booking, post-flight, and customer service interactions, on top for real-time signal between formal benchmarks.
Some gains come fast, like fixing a confusing rebooking process. Trust rebuilt after repeated service failures takes longer. Airlines that segment feedback and act on the biggest detractor driver first tend to see movement within two to three quarters.



