
Uncertainty is a natural part of decision-making, whether a simple task like shooting a basketball or a complex one involving data analysis. The confidence interval formula helps quantify this uncertainty by predicting an estimate’s accuracy.
In this blog, we’ll break down a confidence interval, how to calculate it, and why it’s crucial for experiments and data analysis. Whether surveying customers or testing new ideas, understanding the confidence interval formula enables you to make more informed decisions with a clear sense of confidence about your results. Let’s dive into the details!
What is Confidence Interval?
A confidence interval is a statistical tool to estimate the range within which a population parameter (like a mean or proportion) is likely to fall. Rather than providing a single point estimate, a confidence interval gives a range of values that you can be fairly certain includes the true parameter. This range is based on sample data and a chosen confidence level (typically 90%, 95%, or 99%).
For example, suppose you survey a sample and calculate an average response time. In that case, confidence intervals might show that you can be 95% confident that the true average response time for the entire population falls between 10 and 15 minutes. This interval helps account for variability in the data and offers a range to guide decision-making rather than relying on a single estimate.
What is the Confidence Interval Formula?
The confidence interval formula is a powerful equation that lets us put a range around our sample results, giving us insight into where the true population value might fall if we repeated the experiment or survey multiple times. It’s a way of quantifying uncertainty, allowing us to make confident predictions, even if we can’t know the exact value.
How Confidence Levels Work
When we calculate a confidence interval, we choose a confidence level—often 95%, but sometimes 90% or 99%—to determine the range. This confidence level represents the likelihood that the interval we calculate from our sample data includes the actual population mean.
For example, with a 95% confidence level, we’d expect that if we repeated our experiment 100 times, 95 of those intervals would contain the true population mean.
The Confidence Interval Formula
The formula for calculating a confidence interval is:

The confidence level is set by the alpha value used in the experiment and represents the number of times (out of 100) you think the expected result will be reproduced. If the alpha were 1, the confidence level would be 1-.1=.9, or 90%.
The overall confidence interval represents the average of your estimate plus or minus the variation within the estimate. This is the expected range of values; with a certain amount of confidence, your values will fall into.
Why Is the Confidence Interval Formula Important?
Establishing a confidence interval is important in terms of probability sampling and certainty. The formula above allows survey conductors to estimate how well results will be reproduced and what they expect with high accuracy.
Setting clear expectations is important to understanding how well a survey is understood and acted on and how accurate an initial data set might be. Additionally, setting expectations can be helpful when conducting a customer needs analysis.
The confidence interval formula is also helpful for establishing confidence in a given audience. When conducting surveys and outreach with your customers, it can be useful to understand what they think and how they respond.
The confidence interval allows you to use this information to predict how they should respond to future experiments accurately and will tell you if something changes in the audience.
Here’s why it’s important:
Provides a Range of Values
Instead of a single-point estimate, the confidence interval offers a range within which the true value is expected to fall. For example, when estimating average income, the interval provides upper and lower bounds, offering a more informative result, especially in data variability.
Quantifies Uncertainty
Data collected is typically from a sample, only some of the population. The confidence interval formula quantifies the uncertainty around the sample estimate. For instance, a 95% confidence interval means the true value will fall within the range of 95 out of 100 times if the experiment is repeated.
Supports Decision-Making
The confidence interval gives businesses, researchers, and policymakers insight into how much trust to place in findings. It helps ensure that conclusions are not based on small sample sizes or chance, thus increasing result validity.
Helps Compare Data Sets
Confidence intervals aid in comparing different datasets. If the intervals for two groups do not overlap, it suggests a significant difference; if they do overlap, the difference may not be meaningful.
Improves Precision with Larger Samples
Larger sample sizes lead to narrower confidence intervals, improving precision. This encourages the collection of more data for better accuracy in conclusions.
Essential for Statistical Inference
Confidence intervals are key for statistical inference. They help draw conclusions about populations based on sample data, such as in hypothesis testing.
Sets Realistic Expectations
Rather than focusing on point estimates, confidence intervals set realistic expectations, reminding us that all estimates are subject to variation. This leads to more informed decision-making.
Confidence Interval Formula Use Guide & Example
Here is a step-by-step guide for using the confidence interval formula. For this example, we will use an imaginary sample of people shooting 100 free throws.
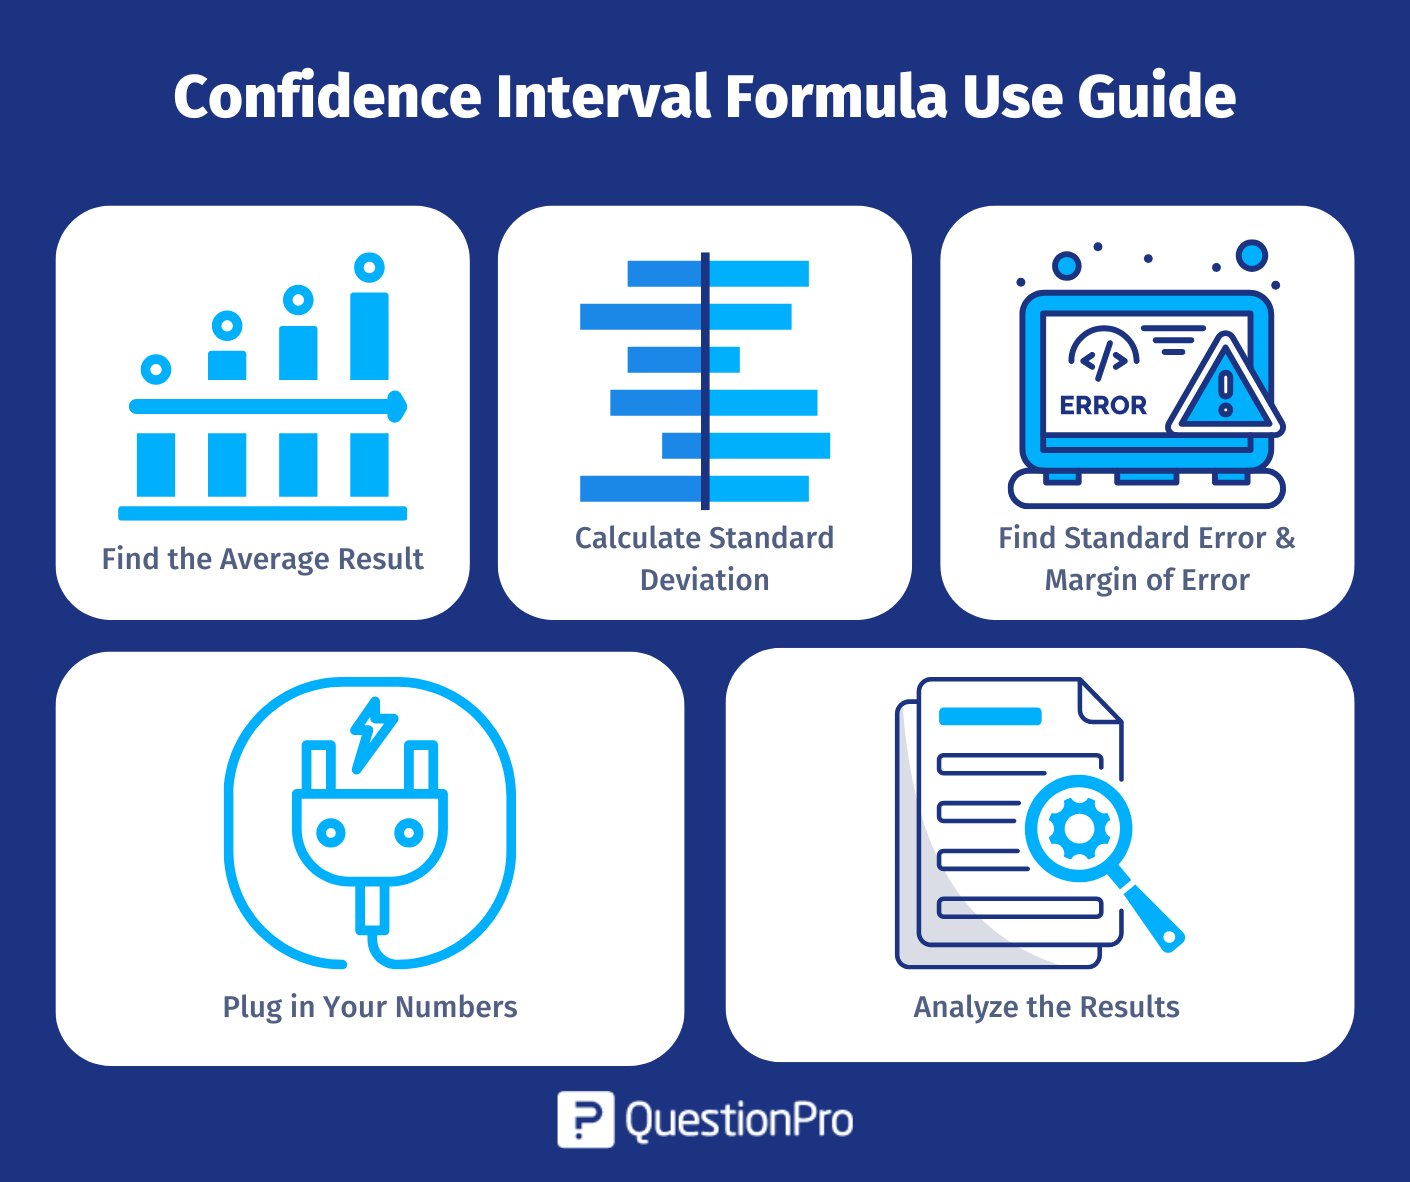
Find the Average Result
The first piece of information you need is the sample mean. This is the average result across all participants. To find this, add up all the scores and divide them by the number of participants.
Our sample for shots made is 75, 80, 75, 80, 90, 75, 85, 75, 90, 80. Adding these up and dividing by the total shooters (10) gives us 80.5. This means that across all shooters, the average score was 80.5. The confidence interval will calculate the certainty that the next experiment will score the same average amount of shots.
Calculate Standard Deviation
After finding the sample average, you need to calculate the standard deviation. This will be the difference from the average for the sample size. To find the standard deviation, you must subtract the sample mean from each result and square each answer. Then, add them all up and take the square root of that number. This will be the sample standard deviation.
For our example data set, this looks like (75 – 80.5)² + (80 – 80.5)² + (75 – 80.5)² + (80 – 80.5)² + (90 – 80.5)² + (75 – 80.5)² + (85 – 80.5)² + (75 – 80.5)² + (90 – 80.5)² + (80 – 80.5)² = 30.25 + 0.25 + 30.25 + 0.25 + 90.25 + 30.25 + 20.25 + 30.25 + 90.25 + 0.25 = 322.5 ÷ 10 total shooters = 32.25.
Find Standard Error & Margin of Error
You can now use the sample mean and standard deviation to calculate the standard error of your study. This number will represent how closely the sample represents the total population. In our example of free throws, you margin of error calculator calculator the standard error by dividing the standard deviation by the size of the study: 32.25 / 10 = 3.225.
After figuring out the standard error, you can easily calculate the margin of error. This tells you how confident you can be when conducting the same experiment for the total population. A larger margin of error will mean less confidence in reproducing the results. To find this, multiply the standard error by two. For our data, this looks like 3.225 x 2 = 6.45.
Plug in Your Numbers
Once you have your numbers, you can plug them into the formula and calculate your confidence interval. We will assume that the Z-value is 95% and, therefore, 0.95.
Confidence interval (CI) = ‾X ± Z(S ÷ √n) = 80.5 ± 0.95(32.25 ÷ √10) = 80.5 ± 0.95(32.25 ÷ 3.16) = 80.5 ± 0.95(10.21) = 80.5 ± 9.70 = 90.2, 70.8.
Analyze the Results
The confidence interval formula determines if your results are likely to be repeated for the total population of your sample. Higher confidence shows a higher probability of repetition, while lower confidence shows a lower likelihood of seeing the same results. With these numbers, you can get an accurate picture of the boundaries of expected results when you conduct your experiment again. With that, you can analyze population changes and predicted data.
Our confidence interval for people shooting free throws was between 90.2 and 70.8 free throws made. This means the average number of shots made for the whole population should fall between these two values (with 95% confidence).
Conclusion
The confidence interval formula is a powerful tool in data analysis. It provides a range that allows you to make predictions with a quantifiable level of confidence. By understanding how to calculate and interpret confidence intervals, you can make more informed decisions and better manage the uncertainty of working with sample data. This process is valuable in any field where data-driven decisions matter, from customer surveys to scientific research.
For those seeking efficient data analysis, QuestionPro offers robust tools like real-time dashboards and comprehensive analytics, making it easier to turn data insights into actionable outcomes. Start exploring the possibilities with QuestionPro today to elevate your data analysis and confidently make decisions!
Frequently Asked Questions (FAQ’s)
A: A confidence interval is a statistical range that estimates where a population parameter (like a mean) will fall based on sample data and a specific confidence level.
A: The confidence interval formula calculates a range around a sample mean by considering the standard deviation, sample size, and a Z-score based on the confidence level.
A: Confidence intervals quantify the uncertainty of sample estimates, enabling more informed decisions by providing a likely range for the true population parameter.
A: Confidence levels (e.g., 90%, 95%) indicate the likelihood that the calculated interval contains the true population parameter if repeated over multiple samples.