
Do you know your company’s eNPS score, or how it compares to the eNPS scores for top companies?
The best-looking job ad does not guarantee a strong workplace. That is what eNPS reveals. Some companies in 2025 are thriving because employees feel proud and supported. Others are losing talent because everyday culture is broken.
A single score is the difference between loyalty and turnover. eNPS or Employee Net Promoter Score is calculated by subtracting detractors from promoters. This number has become a clear measure of trust and future success.
Let’s take a closer look at what top-performing companies are doing right, how their eNPS scores reflect that, and what steps you can take to raise the bar in your own workplace.
Why Knowing eNPS Scores for Top Companies Matters
Looking at eNPS scores for top companies is not about copying them. It is about seeing how different strategies play out in real workplaces and what you can learn from them.
By measuring employee satisfaction through eNPS surveys, organizations gain actionable insights to build a great workplace.
When you study leaders in the space, you can see strategies in action. Here’s how understanding eNPS scores for top companies can help you:
- Benchmarking Against the Best
Tech leaders and financial firms often top the list with eNPS fueled by career growth, innovation, and strong benefits. Measuring yourself against them exposes gaps and sets realistic goals.
- Learning From Wins and Failures
Financial services use profit sharing to turn employees into advocates. Retail struggles with negative scores when schedules are too rigid. Education’s recent dip highlights how accountability gaps show up in the data. These lessons reveal what actually works.
- Retention & Recruitment Power
High scores keep employees loyal and turn them into recruiters. Low scores raise turnover risk and damage reputation. The difference between the two shows up in costs and culture alike.
- Employer Brand That Attracts Automatically
Top companies are not shy about their eNPS. They post it in job ads and share it on social media. A strong score has become a proof point that attracts talent.
- A Direct Line to Business Success
High eNPS connects directly to productivity, customer loyalty, and profits. Happy employees create happy customers, and companies that understand this build stronger brands.
- Leadership Accountability, Made Measurable
When scores drop, leaders see it immediately. They cannot hide behind vague promises. The number forces action.
You do not need the highest eNPS in the world. You need to build a workplace where employees are proud enough to promote you. And that pride is the real competitive advantage.
2025 eNPS Leaders: Industries Dominated by Top Companies
The industries winning in 2025 are not the ones with the loudest ads or the flashiest perks. They are the ones where employees feel proud, supported, and motivated to advocate for their workplace.
That pride shows up in the numbers. eNPS has become more than a survey result. It’s a cultural signal, a reputation metric, and a business predictor.
The Top Three Industries Leading in 2025
Some sectors have mastered the balance of flexibility, recognition, and growth. Their scores prove that employee advocacy is a direct measure of cultural strength.
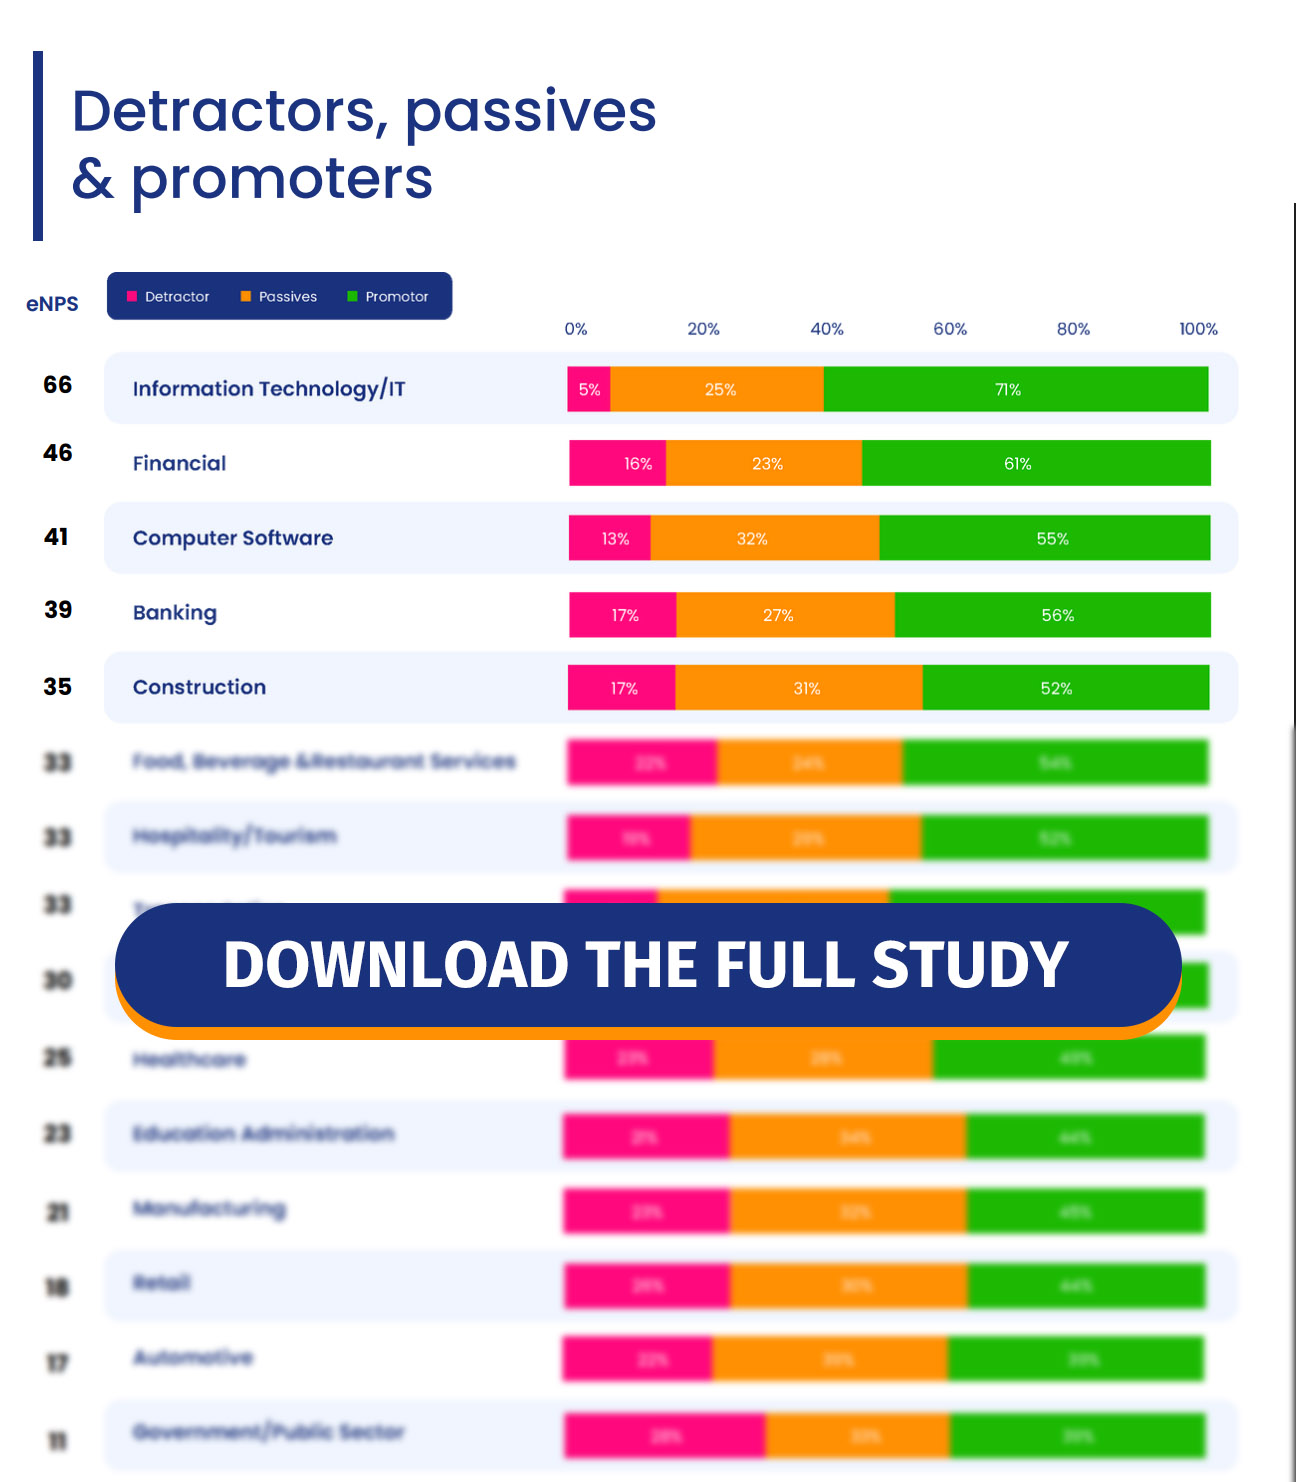
- Information Technology (eNPS 66)
Google and Microsoft lead the way with cultures built on innovation, remote flexibility, and career growth. Only 5 percent of employees fall into the detractor category.
Key Insight: Employees thrive when they have autonomy and space to create.
- Financial Services (eNPS 46)
JPMorgan Chase and Goldman Sachs stand out with competitive salaries, clear promotion paths, and profit-sharing opportunities. Sixty-one percent of employees are active promoters.
Key Insight: Financial stability and clear rewards fuel loyalty.
- Computer Software (eNPS 41)
Adobe and Oracle sustain advocacy through agile workflows and heavy R&D investment. Fifty-five percent of employees actively recommend their workplace.
Key Insight: Continuous learning and project ownership drive long-term engagement.
Comparing Leaders and Laggards
Not every sector is keeping pace. Some industries remain stuck in rigid structures and outdated practices that drain morale.
- Government and Public Sector (eNPS 11): Bureaucratic red tape and outdated policies leave one in four employees disengaged.
- Education Administration (eNPS 23): Hybrid learning challenges and funding cuts result in burnout and 21 percent detractors.
The difference between leaders and laggards is not just about numbers. It is about how companies value their people in daily decisions.
Positive Year-Over-Year Trends
Beyond the traditional leaders, several industries have turned adversity into a source of resilience. By listening to employees and adapting to post-pandemic realities, they transformed passives into promoters.
- Food, Beverage, and Restaurants (+27 points)
After years of disruption, the sector rebuilt loyalty through mental health support and flexible scheduling. Starbucks led with free counseling and app-based shift swaps. Scores jumped from 6 to 33.
Lesson: Addressing burnout directly changes the narrative.
- Transportation (+14 points)
Uber introduced safety bonuses, and FedEx used AI to reduce driver fatigue. Scores rose from 19 to 33 as employees felt safer and recognized.
Lesson: Small but visible investments make a measurable difference.
- Hospitality and Tourism (+6 points)
Marriott and Hilton used wellness stipends and flexible scheduling to rebuild trust. Employees who once felt passive became vocal promoters.
Lesson: Flexibility and well-being build advocacy faster than perks alone.
In 2025, the industries leading in eNPS are the ones that turned culture into strategy. The laggards are still weighed down by old habits.
The gap between them proves one point. Employees no longer measure value in paychecks or perks. They measure it in whether they feel respected, supported, and proud.
That is the true competitive edge in today’s workplace.
Understand More About: eNPS Surveys and How they are Revolutionizing and
Enhancing Employee Experiences.
How to Calculate Your Own eNPS
Employee Net Promoter Score looks simple, but it is one of the clearest ways to see how loyal your workforce really is.
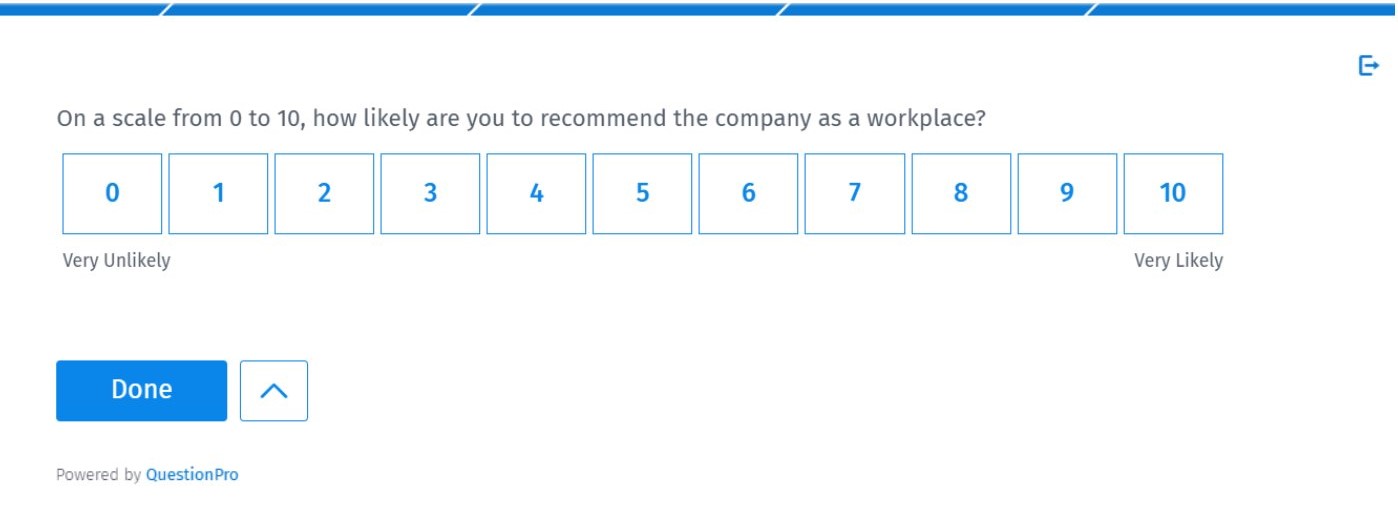
The entire process starts with one question:
“On a scale of 0 to 10, how likely are you to recommend this company as a workplace?”
That single answer unlocks a powerful measure of culture and engagement.
Every employee response falls into one of three categories:
- Detractors (0–6): Unhappy employees who may harm reputation.
- Passives (7–8): Satisfied but unenthusiastic.
- Promoters (9–10): Loyal advocates who recommend your workplace.
These groups are not just numbers. They reveal how your culture is performing in real time.
Once you have the responses, the calculation is straightforward.
eNPS = % Promoters – % Detractors

The score ranges from -100 to +100.
- Positive scores mean you have more advocates than critics.
- Negative scores signal more disengagement than loyalty.
The IT sector leads in 2025 with an eNPS of 66. Seventy-one percent of employees are promoters, while only five percent are detractors. The result is a strong culture of advocacy.
Government, by contrast, struggles with an eNPS of 11. Thirty-nine percent of employees are promoters, but twenty-five percent are detractors. The narrow gap highlights morale and engagement challenges.
Detractors, passives, and promoters are more than survey labels. They are signals about your future.
- Detractors expose weak spots that can damage retention.
- Passives reveal areas where potential is untapped.
- Promoters prove that loyalty and pride are already working for you.
Together, these groups provide a roadmap for building a stronger workplace.
When you calculate eNPS and pay attention to what each group reveals, you gain the clearest picture of where your culture is thriving and where it needs attention.
The benefit of using QuestionPro is that the system automatically calculates your NPS or eNPS score based on the responses. It subtracts the percentage of Detractors from the percentage of Promoters to give you the final score.
Also, you can check out our calculators to calculate eNPS and NPS.
Detractors, Passives, and Promoters: What They Reveal
Every employee voice carries insight into whether your company is thriving or struggling. When you group responses into detractors, passives, and promoters, you gain a clear path to improve retention, morale, and long-term growth.
This data comes from QuestionPro’s latest report, which surveyed 5,000 respondents who were employed in full-time positions to measure the Employee Net Promoter Score (eNPS).
Step 1: Identify Pain Points
High levels of detractors highlight urgent issues.
For example, the retail industry reports 26 percent detractors, signaling challenges like:
- Poor work-life balance
- Low wages or weak benefits
- Limited career growth
Action: Conduct anonymous surveys to identify the root causes and prioritize necessary fixes.
Step 2: Highlight Success Factors
A high number of promoters shows what you are doing right.
For example, the financial services achieved 61 percent promoters, reflecting strengths such as:
- Competitive pay
- Recognition and rewards
- Clear career development
Action: Double down on these strengths. Celebrate and reward promoters to maintain high advocacy levels.
Step 3: Unlock the Passive Majority
Passives may look neutral, but they are the group with the most potential to shift. For example, 25% of passives could become promoters with programs like mentorship or skill-building workshops.
Action: Design engagement strategies to move passives into active advocates.
Use benchmarks to set realistic goals and track progress. Follow this checklist:
- Calculate your eNPS with the formula.
- Compare with industry averages. For example, reduce detractors below Retail’s 26 percent.
- Analyze detractors with focus groups to address common frustrations.
- Leverage promoters through referral programs, similar to Financial’s strong base of advocates.
- Engage passives with clear promotion paths and development opportunities.
- Track results by resurveying quarterly and adjusting strategies accordingly.
Detractors, passives, and promoters are a living snapshot of your culture. When you act on what each group reveals, you can hit benchmarks and create new ones.
Learn More: All You Need to Know About eNPS: Interpretation, Improvement
Strategies & Industry Benchmarks
How Top Companies Achieve Exceptional eNPS Scores
Treating eNPS is not a metric to chase but a roadmap to fix what is broken and amplify what works. Proven strategies turn employees into advocates and improve overall workplace culture:
1. It Identifies and Fixes Systemic Weaknesses
Top companies tackle employee dissatisfaction head-on. Take Retail, where 26% of employees are detractors.
- Flexible Scheduling: Stores like Target introduced shift-swap apps to support work-life balance.
- Fair Wages: Costco’s hourly pay hikes reduced turnover and silenced employee frustration.
Detractors aren’t complainers; they’re messengers. Listen to them
HR Leader – A Fortune 500 retailer
2. It Amplifies Advocacy and Drives Organic Growth
The Financial sector leads with 61% promoters, turning engagement into recruitment power.
- Recognition Programs: Banks like JPMorgan reward top performers with bonuses and peer shoutouts.
- Career Growth: Promotions are fast-tracked, and tuition reimbursement encourages professional development.
Happy employees recruit for you. Our promoters bring in 30% of new hires
HR Director – A Financial Service
3. It Holds Leadership Accountable for Culture and Engagement
High eNPS starts with leadership prioritizing employee experience.
- Align with Customer Metrics: Tying eNPS to customer NPS creates urgency and cross-functional focus.
- Transparent Reporting: Tech companies like Salesforce share eNPS results company-wide to drive accountability.
When leaders care, employees notice. It’s not HR’s metric; it’s everyone’s
CHRO – Silicon Valley
4. It Unlocks Untapped Potential in the Workforce
Neutral employees, often 25–35% of your workforce, represent the largest growth opportunity.
- IT Sector Example: Microsoft’s hackathons and upskilling programs turn passives into innovators.
- Feedback Loops: Regular pulse surveys show employees that their input is valued and drives change.
Top companies don’t chase perfection; they focus on what matters most to employees. Whether it is fixing shift challenges in Retail or celebrating wins in Finance, the formula is simple: Listen, adapt, repeat.
Get the Full Story: What is a Good eNPS Score + eNPS Survey Tips
Using QuestionPro Employee Experience to Improve Your eNPS
Improving your eNPS is not about chasing numbers. It’s about understanding employee sentiment and taking action to build loyalty, engagement, and advocacy. QuestionPro Employee Experience gives you the tools to do just that.
Create Targeted Surveys
The first step is asking the right questions. Start with the main eNPS question:
“On a scale of 0–10, how likely are you to recommend the company as a workplace?”
Responses fall into three groups:
- Detractors (0–6)
- Passives (7–8)
- Promoters (9–10)
Follow-up questions help you understand the reasons behind the scores. For example:
- What is the main reason for your rating?
- How satisfied are you with career development or company culture?
Segment responses by department, role, or tenure to uncover patterns and trends. Here are some tips for success:
- Keep surveys short and focused (5–7 questions).
- Use smart logic so employees see only relevant questions.
- Send surveys at key moments, like after training sessions or quarterly check-ins.
Leverage Ready-Made Templates
QuestionPro offers pre-built templates to save time and ensure consistency:
- eNPS Survey Template: Includes the main question and follow-ups.
- Employee Engagement Template: Measures eNPS and evaluates culture, values, and tools.
- Exit Survey Templates: Capture insights from new hires and departing employees.
- Pulse Surveys: Short, frequent surveys to track engagement over time.
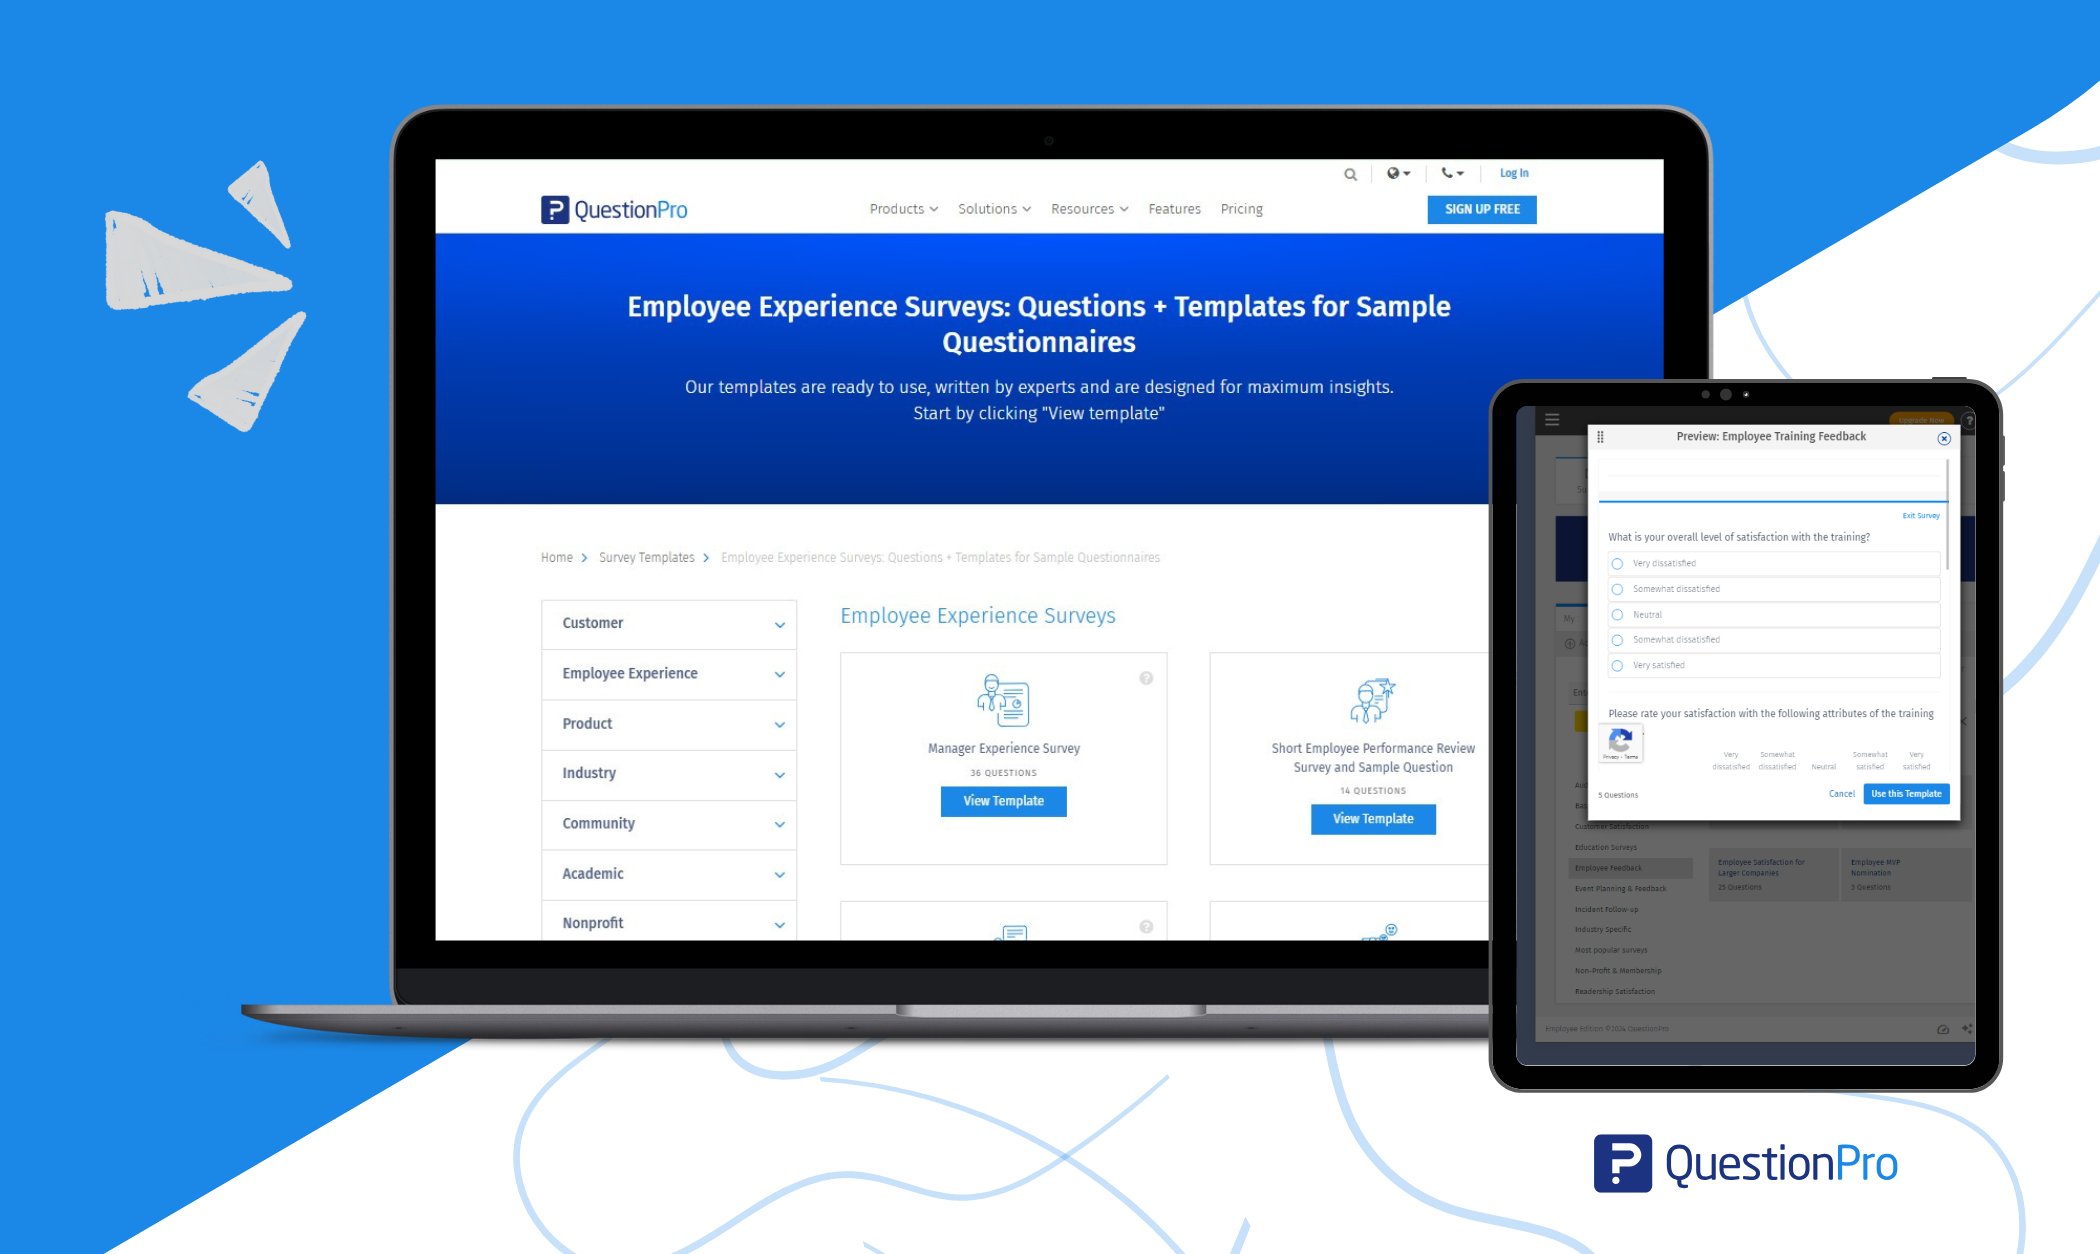
Templates can be customized with your logo, branding, and company-specific questions. Keep responses anonymous to encourage honest feedback.
Take Action on Insights
Collecting data is only the first step. The real value comes from acting on what you learn.
- Address Detractors: Resolve pain points like workload, recognition gaps, or scheduling conflicts.
- Engage Passives: Use mentorship, skill-building, or wellness programs to shift them toward advocacy.
- Empower Promoters: Recognize and reward them to amplify their influence on recruitment and culture.
QuestionPro connects employees and leadership, ensuring feedback translates into tangible improvements in the workplace.
Next Read: Top eNPS Survey Tool to Boost Employee Engagement
Conclusion
High eNPS reflects a workplace culture built on flexibility, career growth, and recognition. Companies with strong eNPS enjoy higher retention, more engaged employees, and improved productivity.
eNPS is not just a number. It is a window into how your team truly feels. Measuring employee sentiment reveals what drives loyalty and what sparks frustration, such as Retail’s rigid schedules.
Tools like QuestionPro Employee Experience help you act on these insights. Targeted surveys, in-depth feedback analysis, and actionable improvements can make a real difference.
By learning from industry leaders, addressing detractors’ concerns, and engaging passive employees through career development or wellness initiatives, companies can turn neutral employees into promoters.
Frequently Asked Questions (FAQs)
Answer: eNPS (Employee Net Promoter Score) measures employee loyalty by asking how likely they are to recommend their workplace.
Answer: eNPS = % Promoters (9–10 ratings) – % Detractors (0–6 ratings)
Example: IT’s 71% Promoters – 5% Detractors = 66 eNPS.
Answer: High eNPS correlates with productivity, customer satisfaction, and profitability. Engaged employees, like Apple’s retail teams, drive innovation and advocacy.
Answer: By aligning eNPS with customer metrics, sharing results transparently (like Salesforce), and prioritizing employee-centric policies.
Answer: Key tactics include reducing detractors, encouraging promoters, and engaging passives through career development.